

Key Insights
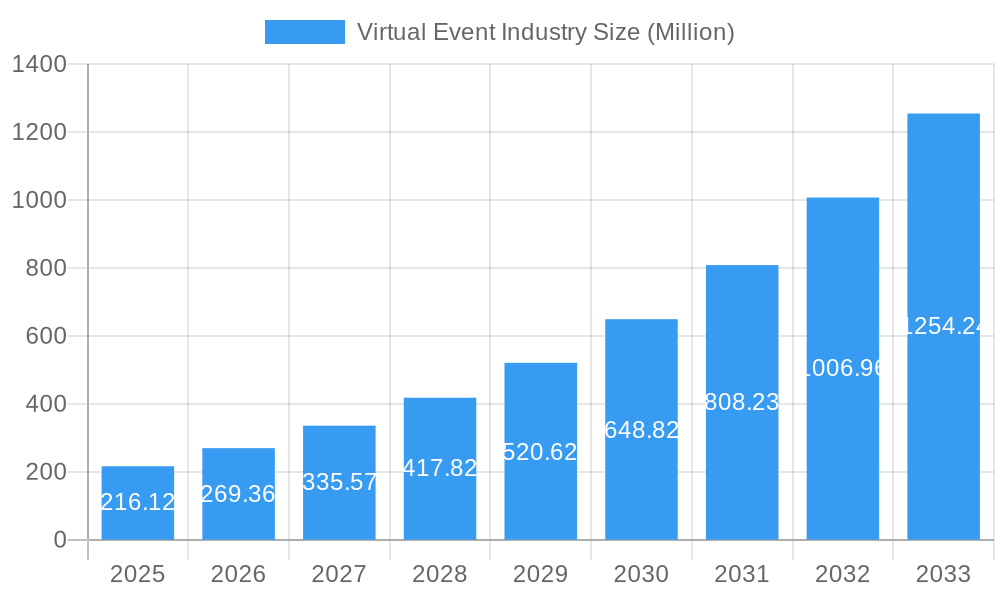
The virtual event industry is experiencing explosive growth, projected to reach a market size of $216.12 million in 2025 and exhibiting a remarkable Compound Annual Growth Rate (CAGR) of 24.92%. This surge is driven by several key factors. The increasing adoption of digital technologies across various sectors, coupled with the cost-effectiveness and enhanced accessibility of virtual events compared to their physical counterparts, is a significant driver. Furthermore, the flexibility and scalability offered by virtual platforms allow businesses to reach wider audiences, both geographically and demographically, leading to increased participation and engagement. The diverse applications of virtual events—from conferences and exhibitions to training and recruitment—further contribute to this robust growth. Specific segments like recruitment and sales & marketing are experiencing particularly strong growth as businesses discover new ways to interact with clients and candidates virtually. The global reach of virtual events is also a key contributor to the market expansion, with North America and Europe currently holding the largest market shares, but Asia-Pacific showing significant growth potential. While challenges like ensuring high-quality engagement and overcoming technological hurdles exist, ongoing improvements in virtual event platforms and increasing digital literacy are mitigating these constraints.
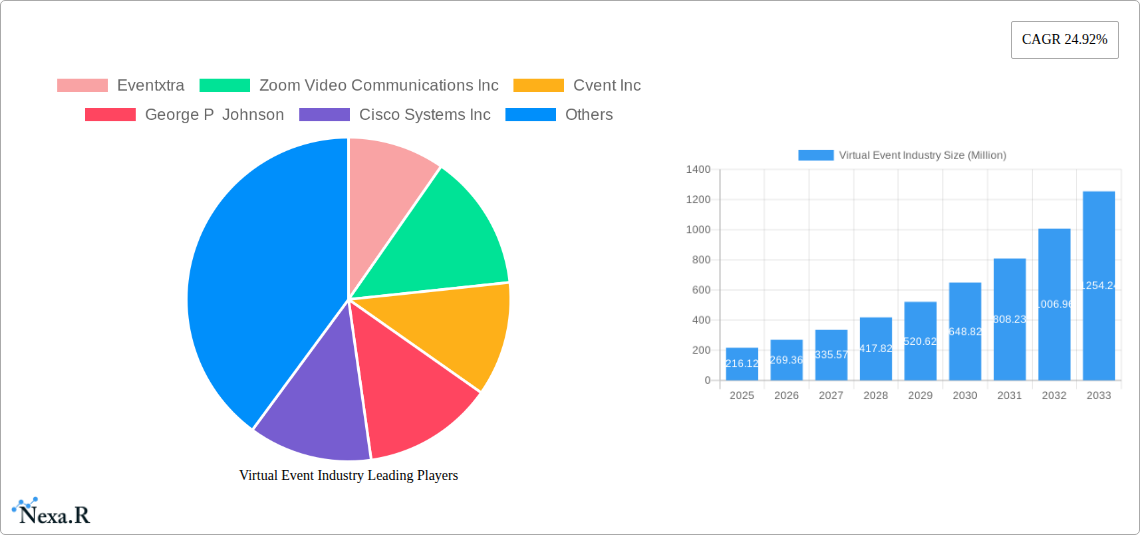
Virtual Event Industry Market Size (In Million)
The continued refinement of virtual event technology, incorporating features such as enhanced interactive elements, improved networking capabilities, and seamless integration with other business tools, will further fuel market expansion. The expanding adoption across various end-user industries, including educational institutions and enterprises, showcases the versatility and applicability of virtual events. Moreover, the emergence of hybrid event models, combining the benefits of both physical and virtual formats, is creating new opportunities for growth. The competitive landscape comprises a mix of established technology providers and specialized event management companies, each contributing to the market's dynamism. Looking ahead, the market is poised for sustained growth driven by technological advancements, increased user adoption, and the broadening scope of applications across diverse sectors and geographies. The forecasted period (2025-2033) is expected to witness even more rapid expansion as the industry matures and further penetrates untapped markets.
Virtual Event Industry Company Market Share
Virtual Event Industry Market Report: 2019-2033
This comprehensive report provides a detailed analysis of the Virtual Event Industry, encompassing market dynamics, growth trends, dominant segments, and key players. The study period covers 2019-2033, with 2025 as the base and estimated year. This report is crucial for industry professionals, investors, and anyone seeking to understand the evolving landscape of virtual events. The market is segmented by service type (Communication, Recruitment, Sales & Marketing, Training), application (Conferences, Exhibitions/Trade Shows, Summits, Others), and end-user industry (Educational Institutions, Enterprise, Organizations, Other End-User Industries). Key players analyzed include Eventxtra, Zoom Video Communications Inc, Cvent Inc, George P Johnson, Cisco Systems Inc, 6Connex International sp z o o, GES, Alive Events Agency, Avaya LLC, Arkadin Cloud Communications, and ALE International.
Virtual Event Industry Market Dynamics & Structure
The virtual event industry, valued at xx Million in 2024, is experiencing rapid growth driven by technological advancements and shifting consumer preferences. Market concentration is moderately high, with a few major players dominating specific segments. Technological innovation, particularly in areas like immersive experiences and AI-powered engagement tools, is a key driver. Regulatory frameworks, while largely nascent, are evolving to address data privacy and accessibility concerns. Competitive product substitutes include traditional in-person events, but the cost-effectiveness and scalability of virtual events provide a significant advantage. The end-user demographic is broadening, encompassing businesses of all sizes and diverse educational institutions. M&A activity is relatively high, with xx deals recorded between 2019 and 2024, indicating consolidation within the sector.
- Market Concentration: Moderately high, with top 5 players holding xx% market share (2024).
- Technological Innovation: Focus on VR/AR integration, AI-powered analytics, and enhanced interactivity.
- Regulatory Landscape: Emerging regulations focusing on data privacy and accessibility are anticipated.
- M&A Activity: xx deals recorded between 2019 and 2024, suggesting industry consolidation.
- Innovation Barriers: High initial investment costs for advanced technologies, integration complexities, and skills gap.
Virtual Event Industry Growth Trends & Insights
The virtual event industry exhibits robust growth, fueled by increasing adoption across various sectors and technological disruptions. The market size experienced a CAGR of xx% during 2019-2024, reaching xx Million in 2024 and is projected to reach xx Million by 2033, exhibiting a CAGR of xx% during the forecast period (2025-2033). This growth is attributed to several factors: the rising preference for cost-effective and accessible events, advancements in virtual event platforms, and evolving consumer expectations for seamless digital experiences. Market penetration within various end-user industries remains relatively low, indicating significant untapped potential. Consumer behavior shifts towards greater digital engagement and the need for flexible event formats are driving this rapid adoption.
Dominant Regions, Countries, or Segments in Virtual Event Industry
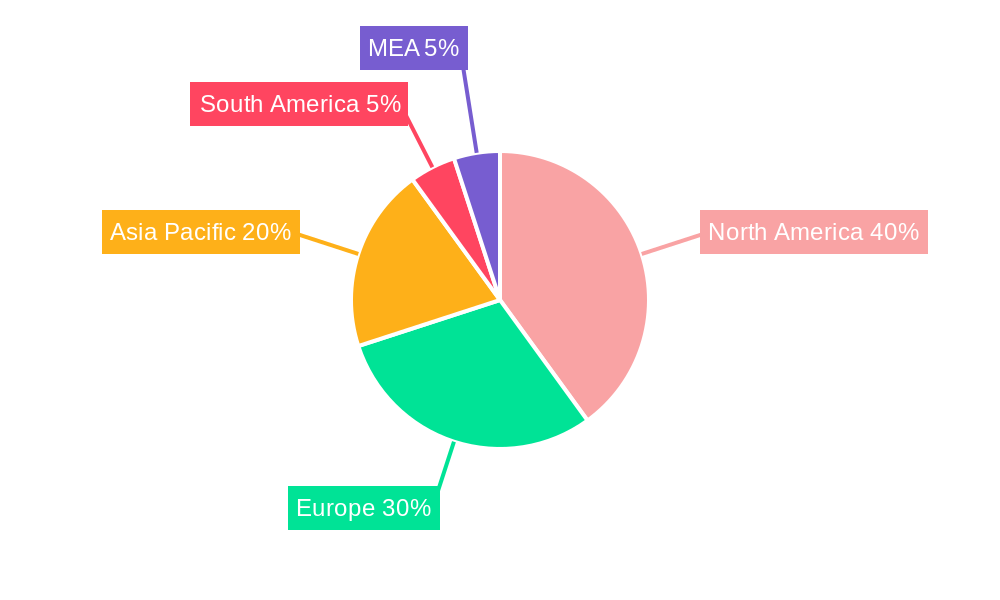
North America currently dominates the virtual event market, holding a xx% market share in 2024, followed by Europe at xx%. This dominance is attributed to factors including high technological adoption rates, robust internet infrastructure, and a large base of enterprise clients. Within service types, Communication and Sales & Marketing segments are currently leading, contributing to a substantial portion of the overall market revenue. The Enterprise end-user industry also dominates, due to high adoption of virtual events for training, conferences and internal communications. Asia-Pacific is expected to witness the fastest growth during the forecast period due to increasing internet penetration and rising demand for virtual events across various sectors.
- Key Drivers (North America): Advanced technological infrastructure, high internet penetration, strong enterprise adoption.
- Key Drivers (Asia-Pacific): Rapidly increasing internet penetration, growing adoption of digital technologies, cost-effectiveness.
- Dominant Segment (Service Type): Communication and Sales & Marketing.
- Dominant Segment (End-User Industry): Enterprise.
Virtual Event Industry Product Landscape
The virtual event product landscape is characterized by a wide array of platforms offering diverse functionalities, from basic video conferencing to highly immersive VR/AR experiences. Key innovations include AI-powered analytics for event optimization, seamless integration with other business tools, and personalized attendee experiences. These platforms compete on features like scalability, customization options, and integration capabilities. The unique selling propositions often center on ease of use, enhanced engagement features, and robust analytics dashboards.
Key Drivers, Barriers & Challenges in Virtual Event Industry
Key Drivers:
- Increased demand for cost-effective and scalable events.
- Advancements in virtual event technologies, including VR/AR and AI.
- Growing adoption across various industries.
- Rising internet penetration and accessibility.
Key Challenges:
- Competition from established players and new entrants.
- Ensuring effective attendee engagement and overcoming virtual event fatigue.
- Addressing technical glitches and ensuring platform stability.
- Maintaining data security and privacy.
- Managing the complexity of event logistics in a virtual environment.
Emerging Opportunities in Virtual Event Industry
The integration of metaverse technologies presents significant opportunities, enabling highly immersive and interactive virtual events. The expansion into untapped markets, such as developing economies with increasing internet penetration, presents growth potential. The demand for specialized virtual events tailored to specific industry needs (e.g., virtual trade shows for niche sectors) is also expected to increase. The focus on data analytics to enhance event effectiveness will also open up market opportunities.
Growth Accelerators in the Virtual Event Industry
Technological breakthroughs in VR/AR, AI, and interactive tools are key growth catalysts. Strategic partnerships between event technology providers and industry leaders will further accelerate market expansion. Increased investment in virtual event infrastructure and marketing will broaden market reach and adoption. Government initiatives promoting digital technologies will also support industry growth.
Key Players Shaping the Virtual Event Industry Market
- Eventxtra
- Zoom Video Communications Inc
- Cvent Inc
- George P Johnson
- Cisco Systems Inc
- 6Connex International sp z o o
- GES
- Alive Events Agency
- Avaya LLC
- Arkadin Cloud Communications
- ALE International
Notable Milestones in Virtual Event Industry Sector
- October 2022: Zoom launched 'Zoom Events' in India, introducing immersive virtual event capabilities.
- May 2023: VOSMOS launched VOSMOS.Events, a platform for user-created virtual events, catering to events of varying sizes (100 to over 100,000 participants).
In-Depth Virtual Event Industry Market Outlook
The virtual event industry is poised for sustained growth, driven by technological innovation and evolving consumer preferences. Strategic partnerships, expansion into new markets, and the adoption of immersive technologies will shape the future landscape. Companies focused on delivering seamless, engaging, and data-driven virtual experiences are well-positioned to capitalize on the significant market potential.
Virtual Event Industry Segmentation
-
1. Service Type
- 1.1. Communication
- 1.2. Recruitment
- 1.3. Sales and Marketing
- 1.4. Training
-
2. Application
- 2.1. Conferences
- 2.2. Exhibitions/Trade Shows
- 2.3. Summits
- 2.4. Other Applications
-
3. End-User Industry
- 3.1. Educational Institutions
- 3.2. Enterprise
- 3.3. Organizations
- 3.4. Other End-User Industries
Virtual Event Industry Segmentation By Geography
- 1. North America
- 2. Europe
- 3. Asia
- 4. Australia and New Zealand
- 5. Latin America
- 6. Middle East and Africa
Virtual Event Industry Regional Market Share
Geographic Coverage of Virtual Event Industry
Virtual Event Industry REPORT HIGHLIGHTS
| Aspects | Details |
|---|---|
| Study Period | 2020-2034 |
| Base Year | 2025 |
| Estimated Year | 2026 |
| Forecast Period | 2026-2034 |
| Historical Period | 2020-2025 |
| Growth Rate | CAGR of 24.92% from 2020-2034 |
| Segmentation |
|
Table of Contents
- 1. Introduction
- 1.1. Research Scope
- 1.2. Market Segmentation
- 1.3. Research Objective
- 1.4. Definitions and Assumptions
- 2. Executive Summary
- 2.1. Market Snapshot
- 3. Market Dynamics
- 3.1. Market Drivers
- 3.2. Market Restrains
- 3.3. Market Trends
- 3.4. Market Opportunities
- 4. Market Factor Analysis
- 4.1. Porters Five Forces
- 4.1.1. Bargaining Power of Suppliers
- 4.1.2. Bargaining Power of Buyers
- 4.1.3. Threat of New Entrants
- 4.1.4. Threat of Substitutes
- 4.1.5. Competitive Rivalry
- 4.2. PESTEL analysis
- 4.3. BCG Analysis
- 4.3.1. Stars (High Growth, High Market Share)
- 4.3.2. Cash Cows (Low Growth, High Market Share)
- 4.3.3. Question Mark (High Growth, Low Market Share)
- 4.3.4. Dogs (Low Growth, Low Market Share)
- 4.4. Ansoff Matrix Analysis
- 4.5. Supply Chain Analysis
- 4.6. Regulatory Landscape
- 4.7. Current Market Potential and Opportunity Assessment (TAM–SAM–SOM Framework)
- 4.8. NRP Analyst Note
- 4.1. Porters Five Forces
- 5. Market Analysis, Insights and Forecast 2021-2033
- 5.1. Market Analysis, Insights and Forecast - by Service Type
- 5.1.1. Communication
- 5.1.2. Recruitment
- 5.1.3. Sales and Marketing
- 5.1.4. Training
- 5.2. Market Analysis, Insights and Forecast - by Application
- 5.2.1. Conferences
- 5.2.2. Exhibitions/Trade Shows
- 5.2.3. Summits
- 5.2.4. Other Applications
- 5.3. Market Analysis, Insights and Forecast - by End-User Industry
- 5.3.1. Educational Institutions
- 5.3.2. Enterprise
- 5.3.3. Organizations
- 5.3.4. Other End-User Industries
- 5.4. Market Analysis, Insights and Forecast - by Region
- 5.4.1. North America
- 5.4.2. Europe
- 5.4.3. Asia
- 5.4.4. Australia and New Zealand
- 5.4.5. Latin America
- 5.4.6. Middle East and Africa
- 5.1. Market Analysis, Insights and Forecast - by Service Type
- 6. Global Virtual Event Industry Analysis, Insights and Forecast, 2021-2033
- 6.1. Market Analysis, Insights and Forecast - by Service Type
- 6.1.1. Communication
- 6.1.2. Recruitment
- 6.1.3. Sales and Marketing
- 6.1.4. Training
- 6.2. Market Analysis, Insights and Forecast - by Application
- 6.2.1. Conferences
- 6.2.2. Exhibitions/Trade Shows
- 6.2.3. Summits
- 6.2.4. Other Applications
- 6.3. Market Analysis, Insights and Forecast - by End-User Industry
- 6.3.1. Educational Institutions
- 6.3.2. Enterprise
- 6.3.3. Organizations
- 6.3.4. Other End-User Industries
- 6.1. Market Analysis, Insights and Forecast - by Service Type
- 7. North America Virtual Event Industry Analysis, Insights and Forecast, 2020-2032
- 7.1. Market Analysis, Insights and Forecast - by Service Type
- 7.1.1. Communication
- 7.1.2. Recruitment
- 7.1.3. Sales and Marketing
- 7.1.4. Training
- 7.2. Market Analysis, Insights and Forecast - by Application
- 7.2.1. Conferences
- 7.2.2. Exhibitions/Trade Shows
- 7.2.3. Summits
- 7.2.4. Other Applications
- 7.3. Market Analysis, Insights and Forecast - by End-User Industry
- 7.3.1. Educational Institutions
- 7.3.2. Enterprise
- 7.3.3. Organizations
- 7.3.4. Other End-User Industries
- 7.1. Market Analysis, Insights and Forecast - by Service Type
- 8. Europe Virtual Event Industry Analysis, Insights and Forecast, 2020-2032
- 8.1. Market Analysis, Insights and Forecast - by Service Type
- 8.1.1. Communication
- 8.1.2. Recruitment
- 8.1.3. Sales and Marketing
- 8.1.4. Training
- 8.2. Market Analysis, Insights and Forecast - by Application
- 8.2.1. Conferences
- 8.2.2. Exhibitions/Trade Shows
- 8.2.3. Summits
- 8.2.4. Other Applications
- 8.3. Market Analysis, Insights and Forecast - by End-User Industry
- 8.3.1. Educational Institutions
- 8.3.2. Enterprise
- 8.3.3. Organizations
- 8.3.4. Other End-User Industries
- 8.1. Market Analysis, Insights and Forecast - by Service Type
- 9. Asia Virtual Event Industry Analysis, Insights and Forecast, 2020-2032
- 9.1. Market Analysis, Insights and Forecast - by Service Type
- 9.1.1. Communication
- 9.1.2. Recruitment
- 9.1.3. Sales and Marketing
- 9.1.4. Training
- 9.2. Market Analysis, Insights and Forecast - by Application
- 9.2.1. Conferences
- 9.2.2. Exhibitions/Trade Shows
- 9.2.3. Summits
- 9.2.4. Other Applications
- 9.3. Market Analysis, Insights and Forecast - by End-User Industry
- 9.3.1. Educational Institutions
- 9.3.2. Enterprise
- 9.3.3. Organizations
- 9.3.4. Other End-User Industries
- 9.1. Market Analysis, Insights and Forecast - by Service Type
- 10. Australia and New Zealand Virtual Event Industry Analysis, Insights and Forecast, 2020-2032
- 10.1. Market Analysis, Insights and Forecast - by Service Type
- 10.1.1. Communication
- 10.1.2. Recruitment
- 10.1.3. Sales and Marketing
- 10.1.4. Training
- 10.2. Market Analysis, Insights and Forecast - by Application
- 10.2.1. Conferences
- 10.2.2. Exhibitions/Trade Shows
- 10.2.3. Summits
- 10.2.4. Other Applications
- 10.3. Market Analysis, Insights and Forecast - by End-User Industry
- 10.3.1. Educational Institutions
- 10.3.2. Enterprise
- 10.3.3. Organizations
- 10.3.4. Other End-User Industries
- 10.1. Market Analysis, Insights and Forecast - by Service Type
- 11. Latin America Virtual Event Industry Analysis, Insights and Forecast, 2020-2032
- 11.1. Market Analysis, Insights and Forecast - by Service Type
- 11.1.1. Communication
- 11.1.2. Recruitment
- 11.1.3. Sales and Marketing
- 11.1.4. Training
- 11.2. Market Analysis, Insights and Forecast - by Application
- 11.2.1. Conferences
- 11.2.2. Exhibitions/Trade Shows
- 11.2.3. Summits
- 11.2.4. Other Applications
- 11.3. Market Analysis, Insights and Forecast - by End-User Industry
- 11.3.1. Educational Institutions
- 11.3.2. Enterprise
- 11.3.3. Organizations
- 11.3.4. Other End-User Industries
- 11.1. Market Analysis, Insights and Forecast - by Service Type
- 12. Middle East and Africa Virtual Event Industry Analysis, Insights and Forecast, 2020-2032
- 12.1. Market Analysis, Insights and Forecast - by Service Type
- 12.1.1. Communication
- 12.1.2. Recruitment
- 12.1.3. Sales and Marketing
- 12.1.4. Training
- 12.2. Market Analysis, Insights and Forecast - by Application
- 12.2.1. Conferences
- 12.2.2. Exhibitions/Trade Shows
- 12.2.3. Summits
- 12.2.4. Other Applications
- 12.3. Market Analysis, Insights and Forecast - by End-User Industry
- 12.3.1. Educational Institutions
- 12.3.2. Enterprise
- 12.3.3. Organizations
- 12.3.4. Other End-User Industries
- 12.1. Market Analysis, Insights and Forecast - by Service Type
- 13. Competitive Analysis
- 13.1. Company Profiles
- 13.1.1 Eventxtra
- 13.1.1.1. Company Overview
- 13.1.1.2. Products
- 13.1.1.3. Company Financials
- 13.1.1.4. SWOT Analysis
- 13.1.2 Zoom Video Communications Inc
- 13.1.2.1. Company Overview
- 13.1.2.2. Products
- 13.1.2.3. Company Financials
- 13.1.2.4. SWOT Analysis
- 13.1.3 Cvent Inc
- 13.1.3.1. Company Overview
- 13.1.3.2. Products
- 13.1.3.3. Company Financials
- 13.1.3.4. SWOT Analysis
- 13.1.4 George P Johnson
- 13.1.4.1. Company Overview
- 13.1.4.2. Products
- 13.1.4.3. Company Financials
- 13.1.4.4. SWOT Analysis
- 13.1.5 Cisco Systems Inc
- 13.1.5.1. Company Overview
- 13.1.5.2. Products
- 13.1.5.3. Company Financials
- 13.1.5.4. SWOT Analysis
- 13.1.6 6Connex International sp z o o
- 13.1.6.1. Company Overview
- 13.1.6.2. Products
- 13.1.6.3. Company Financials
- 13.1.6.4. SWOT Analysis
- 13.1.7 GES*List Not Exhaustive
- 13.1.7.1. Company Overview
- 13.1.7.2. Products
- 13.1.7.3. Company Financials
- 13.1.7.4. SWOT Analysis
- 13.1.8 Alive Events Agency
- 13.1.8.1. Company Overview
- 13.1.8.2. Products
- 13.1.8.3. Company Financials
- 13.1.8.4. SWOT Analysis
- 13.1.9 Avaya LLC
- 13.1.9.1. Company Overview
- 13.1.9.2. Products
- 13.1.9.3. Company Financials
- 13.1.9.4. SWOT Analysis
- 13.1.10 Arkadin Cloud Communications
- 13.1.10.1. Company Overview
- 13.1.10.2. Products
- 13.1.10.3. Company Financials
- 13.1.10.4. SWOT Analysis
- 13.1.11 ALE International
- 13.1.11.1. Company Overview
- 13.1.11.2. Products
- 13.1.11.3. Company Financials
- 13.1.11.4. SWOT Analysis
- 13.1.1 Eventxtra
- 13.2. Market Entropy
- 13.2.1 Company's Key Areas Served
- 13.2.2 Recent Developments
- 13.3. Company Market Share Analysis 2025
- 13.3.1 Top 5 Companies Market Share Analysis
- 13.3.2 Top 3 Companies Market Share Analysis
- 13.4. List of Potential Customers
- 14. Research Methodology
List of Figures
- Figure 1: Global Virtual Event Industry Revenue Breakdown (Million, %) by Region 2025 & 2033
- Figure 2: North America Virtual Event Industry Revenue (Million), by Service Type 2025 & 2033
- Figure 3: North America Virtual Event Industry Revenue Share (%), by Service Type 2025 & 2033
- Figure 4: North America Virtual Event Industry Revenue (Million), by Application 2025 & 2033
- Figure 5: North America Virtual Event Industry Revenue Share (%), by Application 2025 & 2033
- Figure 6: North America Virtual Event Industry Revenue (Million), by End-User Industry 2025 & 2033
- Figure 7: North America Virtual Event Industry Revenue Share (%), by End-User Industry 2025 & 2033
- Figure 8: North America Virtual Event Industry Revenue (Million), by Country 2025 & 2033
- Figure 9: North America Virtual Event Industry Revenue Share (%), by Country 2025 & 2033
- Figure 10: Europe Virtual Event Industry Revenue (Million), by Service Type 2025 & 2033
- Figure 11: Europe Virtual Event Industry Revenue Share (%), by Service Type 2025 & 2033
- Figure 12: Europe Virtual Event Industry Revenue (Million), by Application 2025 & 2033
- Figure 13: Europe Virtual Event Industry Revenue Share (%), by Application 2025 & 2033
- Figure 14: Europe Virtual Event Industry Revenue (Million), by End-User Industry 2025 & 2033
- Figure 15: Europe Virtual Event Industry Revenue Share (%), by End-User Industry 2025 & 2033
- Figure 16: Europe Virtual Event Industry Revenue (Million), by Country 2025 & 2033
- Figure 17: Europe Virtual Event Industry Revenue Share (%), by Country 2025 & 2033
- Figure 18: Asia Virtual Event Industry Revenue (Million), by Service Type 2025 & 2033
- Figure 19: Asia Virtual Event Industry Revenue Share (%), by Service Type 2025 & 2033
- Figure 20: Asia Virtual Event Industry Revenue (Million), by Application 2025 & 2033
- Figure 21: Asia Virtual Event Industry Revenue Share (%), by Application 2025 & 2033
- Figure 22: Asia Virtual Event Industry Revenue (Million), by End-User Industry 2025 & 2033
- Figure 23: Asia Virtual Event Industry Revenue Share (%), by End-User Industry 2025 & 2033
- Figure 24: Asia Virtual Event Industry Revenue (Million), by Country 2025 & 2033
- Figure 25: Asia Virtual Event Industry Revenue Share (%), by Country 2025 & 2033
- Figure 26: Australia and New Zealand Virtual Event Industry Revenue (Million), by Service Type 2025 & 2033
- Figure 27: Australia and New Zealand Virtual Event Industry Revenue Share (%), by Service Type 2025 & 2033
- Figure 28: Australia and New Zealand Virtual Event Industry Revenue (Million), by Application 2025 & 2033
- Figure 29: Australia and New Zealand Virtual Event Industry Revenue Share (%), by Application 2025 & 2033
- Figure 30: Australia and New Zealand Virtual Event Industry Revenue (Million), by End-User Industry 2025 & 2033
- Figure 31: Australia and New Zealand Virtual Event Industry Revenue Share (%), by End-User Industry 2025 & 2033
- Figure 32: Australia and New Zealand Virtual Event Industry Revenue (Million), by Country 2025 & 2033
- Figure 33: Australia and New Zealand Virtual Event Industry Revenue Share (%), by Country 2025 & 2033
- Figure 34: Latin America Virtual Event Industry Revenue (Million), by Service Type 2025 & 2033
- Figure 35: Latin America Virtual Event Industry Revenue Share (%), by Service Type 2025 & 2033
- Figure 36: Latin America Virtual Event Industry Revenue (Million), by Application 2025 & 2033
- Figure 37: Latin America Virtual Event Industry Revenue Share (%), by Application 2025 & 2033
- Figure 38: Latin America Virtual Event Industry Revenue (Million), by End-User Industry 2025 & 2033
- Figure 39: Latin America Virtual Event Industry Revenue Share (%), by End-User Industry 2025 & 2033
- Figure 40: Latin America Virtual Event Industry Revenue (Million), by Country 2025 & 2033
- Figure 41: Latin America Virtual Event Industry Revenue Share (%), by Country 2025 & 2033
- Figure 42: Middle East and Africa Virtual Event Industry Revenue (Million), by Service Type 2025 & 2033
- Figure 43: Middle East and Africa Virtual Event Industry Revenue Share (%), by Service Type 2025 & 2033
- Figure 44: Middle East and Africa Virtual Event Industry Revenue (Million), by Application 2025 & 2033
- Figure 45: Middle East and Africa Virtual Event Industry Revenue Share (%), by Application 2025 & 2033
- Figure 46: Middle East and Africa Virtual Event Industry Revenue (Million), by End-User Industry 2025 & 2033
- Figure 47: Middle East and Africa Virtual Event Industry Revenue Share (%), by End-User Industry 2025 & 2033
- Figure 48: Middle East and Africa Virtual Event Industry Revenue (Million), by Country 2025 & 2033
- Figure 49: Middle East and Africa Virtual Event Industry Revenue Share (%), by Country 2025 & 2033
List of Tables
- Table 1: Global Virtual Event Industry Revenue Million Forecast, by Service Type 2020 & 2033
- Table 2: Global Virtual Event Industry Revenue Million Forecast, by Application 2020 & 2033
- Table 3: Global Virtual Event Industry Revenue Million Forecast, by End-User Industry 2020 & 2033
- Table 4: Global Virtual Event Industry Revenue Million Forecast, by Region 2020 & 2033
- Table 5: Global Virtual Event Industry Revenue Million Forecast, by Service Type 2020 & 2033
- Table 6: Global Virtual Event Industry Revenue Million Forecast, by Application 2020 & 2033
- Table 7: Global Virtual Event Industry Revenue Million Forecast, by End-User Industry 2020 & 2033
- Table 8: Global Virtual Event Industry Revenue Million Forecast, by Country 2020 & 2033
- Table 9: Global Virtual Event Industry Revenue Million Forecast, by Service Type 2020 & 2033
- Table 10: Global Virtual Event Industry Revenue Million Forecast, by Application 2020 & 2033
- Table 11: Global Virtual Event Industry Revenue Million Forecast, by End-User Industry 2020 & 2033
- Table 12: Global Virtual Event Industry Revenue Million Forecast, by Country 2020 & 2033
- Table 13: Global Virtual Event Industry Revenue Million Forecast, by Service Type 2020 & 2033
- Table 14: Global Virtual Event Industry Revenue Million Forecast, by Application 2020 & 2033
- Table 15: Global Virtual Event Industry Revenue Million Forecast, by End-User Industry 2020 & 2033
- Table 16: Global Virtual Event Industry Revenue Million Forecast, by Country 2020 & 2033
- Table 17: Global Virtual Event Industry Revenue Million Forecast, by Service Type 2020 & 2033
- Table 18: Global Virtual Event Industry Revenue Million Forecast, by Application 2020 & 2033
- Table 19: Global Virtual Event Industry Revenue Million Forecast, by End-User Industry 2020 & 2033
- Table 20: Global Virtual Event Industry Revenue Million Forecast, by Country 2020 & 2033
- Table 21: Global Virtual Event Industry Revenue Million Forecast, by Service Type 2020 & 2033
- Table 22: Global Virtual Event Industry Revenue Million Forecast, by Application 2020 & 2033
- Table 23: Global Virtual Event Industry Revenue Million Forecast, by End-User Industry 2020 & 2033
- Table 24: Global Virtual Event Industry Revenue Million Forecast, by Country 2020 & 2033
- Table 25: Global Virtual Event Industry Revenue Million Forecast, by Service Type 2020 & 2033
- Table 26: Global Virtual Event Industry Revenue Million Forecast, by Application 2020 & 2033
- Table 27: Global Virtual Event Industry Revenue Million Forecast, by End-User Industry 2020 & 2033
- Table 28: Global Virtual Event Industry Revenue Million Forecast, by Country 2020 & 2033
Frequently Asked Questions
1. What is the projected Compound Annual Growth Rate (CAGR) of the Virtual Event Industry?
The projected CAGR is approximately 24.92%.
2. Which companies are prominent players in the Virtual Event Industry?
Key companies in the market include Eventxtra, Zoom Video Communications Inc, Cvent Inc, George P Johnson, Cisco Systems Inc, 6Connex International sp z o o, GES*List Not Exhaustive, Alive Events Agency, Avaya LLC, Arkadin Cloud Communications, ALE International.
3. What are the main segments of the Virtual Event Industry?
The market segments include Service Type, Application, End-User Industry.
4. Can you provide details about the market size?
The market size is estimated to be USD 216.12 Million as of 2022.
5. What are some drivers contributing to market growth?
Technology Advancements such as Growing Acceptance of Unified Communication as a Service (UCAAS). VR. etc.; Increased Frequency of Business Events; Global Reach. Accessibility. and Cost Efficiency.
6. What are the notable trends driving market growth?
Increased Frequency of Business Events may Drive the Market Growth.
7. Are there any restraints impacting market growth?
Data Security and Privacy Issues; Technology Constraints and Experiential Limitations.
8. Can you provide examples of recent developments in the market?
May 2023: Tech startup VOSMOS, which focuses on the metaverse and virtual experiences, has introduced VOSMOS. Events, a platform for user-created virtual events Individuals and organizations may organize dynamic, secure virtual events of any size with the help of VOSMOS.Events. The offering, created by the Indian company VOSMOS, provides a subscription-based business model and allows customers to conduct virtual events with anywhere between 100 and more than 1 lakh participants.
9. What pricing options are available for accessing the report?
Pricing options include single-user, multi-user, and enterprise licenses priced at USD 4750, USD 5250, and USD 8750 respectively.
10. Is the market size provided in terms of value or volume?
The market size is provided in terms of value, measured in Million.
11. Are there any specific market keywords associated with the report?
Yes, the market keyword associated with the report is "Virtual Event Industry," which aids in identifying and referencing the specific market segment covered.
12. How do I determine which pricing option suits my needs best?
The pricing options vary based on user requirements and access needs. Individual users may opt for single-user licenses, while businesses requiring broader access may choose multi-user or enterprise licenses for cost-effective access to the report.
13. Are there any additional resources or data provided in the Virtual Event Industry report?
While the report offers comprehensive insights, it's advisable to review the specific contents or supplementary materials provided to ascertain if additional resources or data are available.
14. How can I stay updated on further developments or reports in the Virtual Event Industry?
To stay informed about further developments, trends, and reports in the Virtual Event Industry, consider subscribing to industry newsletters, following relevant companies and organizations, or regularly checking reputable industry news sources and publications.
Methodology
Step 1 - Identification of Relevant Samples Size from Population Database


Step 2 - Approaches for Defining Global Market Size (Value, Volume* & Price*)

Note*: In applicable scenarios
Step 3 - Data Sources
Primary Research
- Web Analytics
- Survey Reports
- Research Institute
- Latest Research Reports
- Opinion Leaders
Secondary Research
- Annual Reports
- White Paper
- Latest Press Release
- Industry Association
- Paid Database
- Investor Presentations

Step 4 - Data Triangulation
Involves using different sources of information in order to increase the validity of a study
These sources are likely to be stakeholders in a program - participants, other researchers, program staff, other community members, and so on.
Then we put all data in single framework & apply various statistical tools to find out the dynamic on the market.
During the analysis stage, feedback from the stakeholder groups would be compared to determine areas of agreement as well as areas of divergence