

Key Insights
The global Vision System Software market is poised for substantial growth, projected to reach an estimated $15.83 billion in 2025, with a compelling Compound Annual Growth Rate (CAGR) of 8.3% anticipated over the forecast period of 2025-2033. This robust expansion is primarily fueled by the increasing adoption of industrial automation across diverse sectors, particularly in automotive manufacturing where advanced machine vision systems are critical for quality control, robot guidance, and inspection processes. The aerospace industry is another significant contributor, leveraging vision systems for intricate assembly and defect detection. Furthermore, the burgeoning demand for enhanced efficiency, precision, and reduced manual labor in industrial production environments is a key driver propelling market forward. The software's capability to process vast amounts of visual data in real-time for automated decision-making is becoming indispensable for modern industrial operations.
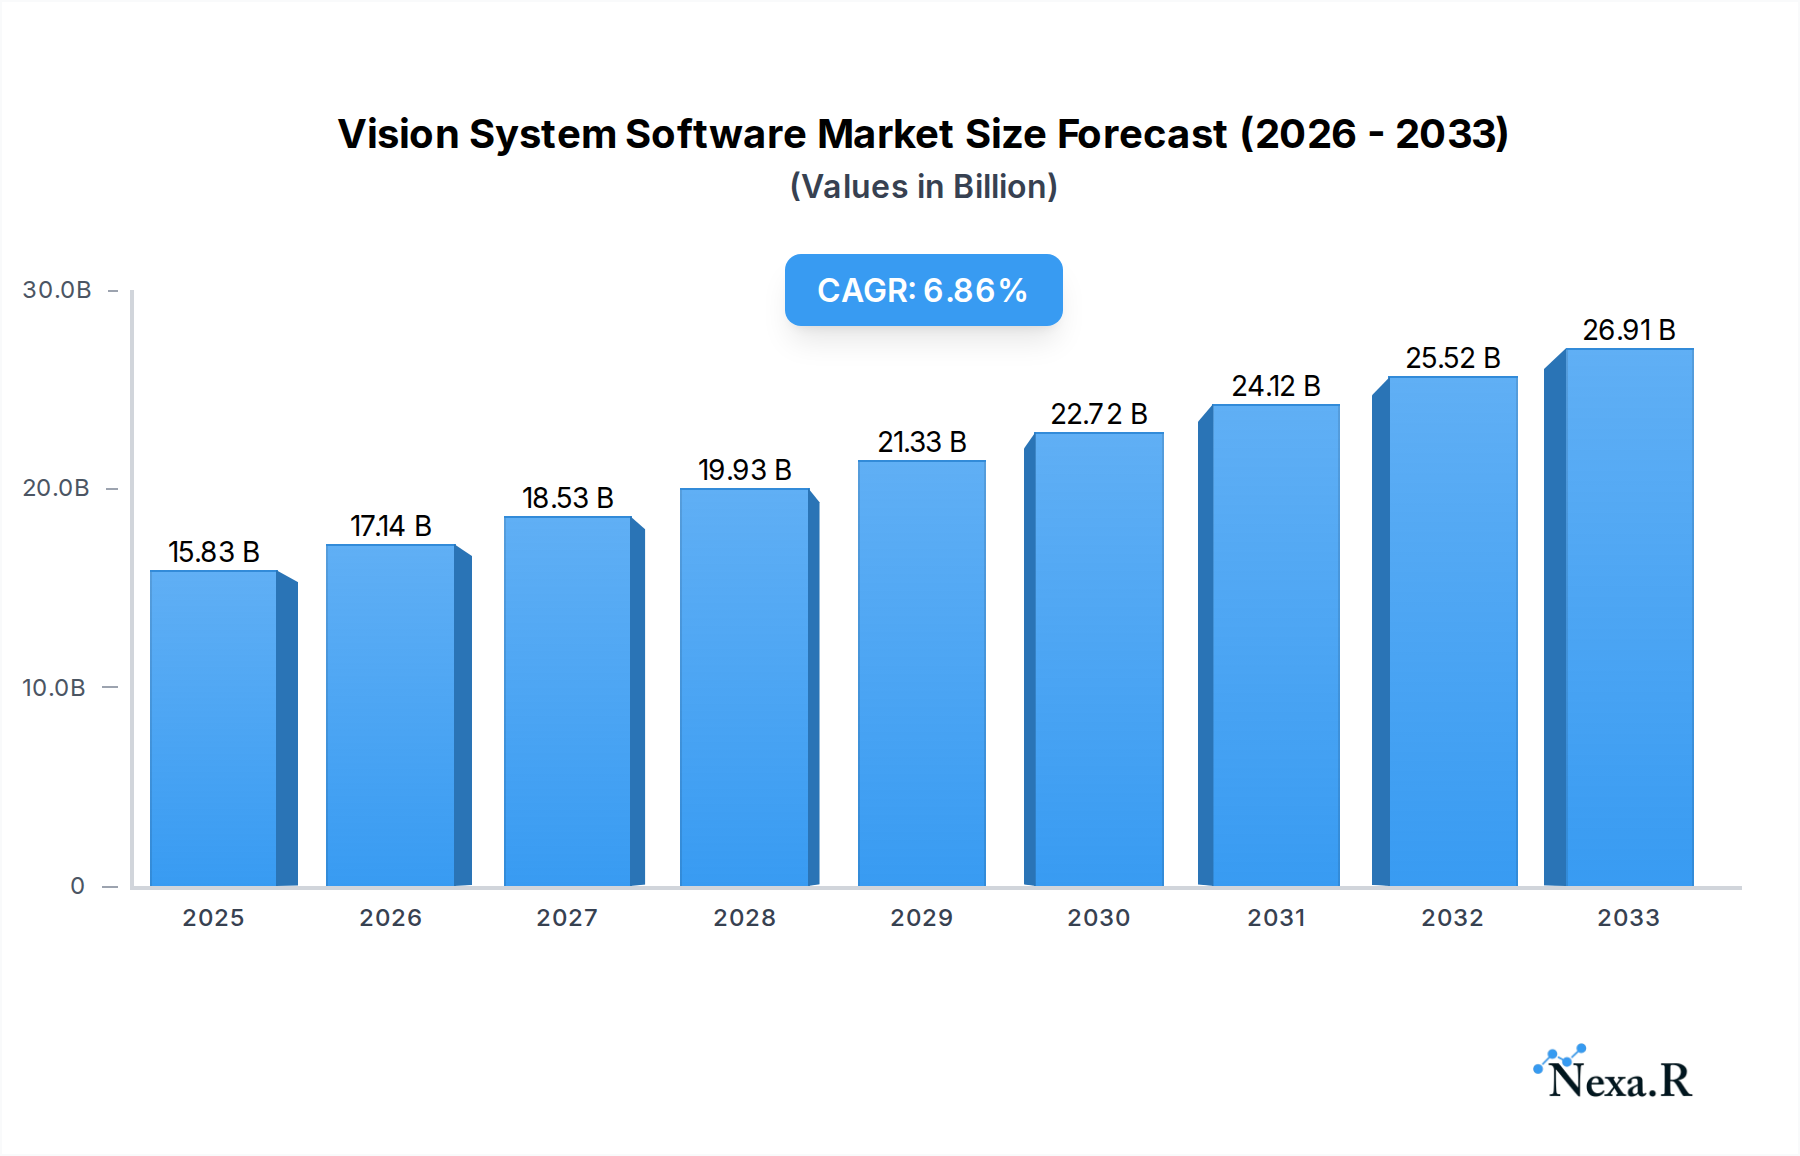
Vision System Software Market Size (In Billion)
The market is characterized by a dynamic interplay of trends and restraints, with cloud-based solutions gaining significant traction due to their scalability, accessibility, and cost-effectiveness. This shift towards cloud deployment allows businesses to manage and analyze visual data remotely, fostering greater collaboration and agility. However, challenges such as the initial investment costs associated with sophisticated vision hardware and software integration, coupled with the need for skilled personnel to operate and maintain these complex systems, present moderate restraints. Data security and privacy concerns associated with the cloud are also factors that industry players are actively addressing. Emerging trends like the integration of AI and machine learning within vision system software are set to further revolutionize capabilities, enabling more intelligent object recognition, anomaly detection, and predictive maintenance, thus reinforcing the market's upward trajectory.

Vision System Software Company Market Share
Vision System Software Market Dynamics & Structure
The vision system software market is characterized by a moderate concentration, with leading players like Cognex, Teledyne Dalsa, and Omron Microscan holding significant market share. Technological innovation is a primary driver, fueled by advancements in artificial intelligence (AI), machine learning (ML), and deep learning algorithms, enabling more sophisticated defect detection, inspection, and guidance capabilities. Regulatory frameworks, particularly concerning quality control and safety standards in industries such as automotive and aerospace, further bolster adoption. Competitive product substitutes, such as manual inspection and simpler sensing technologies, are increasingly being outpaced by the precision and efficiency offered by advanced vision systems. End-user demographics are shifting towards a greater reliance on automation across industrial production, automotive manufacturing, and aerospace assembly lines. Mergers and acquisitions (M&A) activity is on the rise as larger players aim to acquire innovative technologies or expand their market reach. For instance, the market has seen significant M&A volumes in the past few years, contributing to market consolidation and the integration of diverse technological portfolios. Innovation barriers include the high cost of development for cutting-edge AI models and the need for specialized expertise to implement and maintain complex vision solutions.
- Market Concentration: Moderate, with key players holding substantial market share.
- Technological Innovation: Driven by AI, ML, and deep learning for enhanced capabilities.
- Regulatory Influence: Strong impact from quality and safety standards in key industries.
- Competitive Landscape: Advanced vision systems are increasingly outperforming manual inspection and simpler technologies.
- End-User Adoption: Growing reliance on automation across automotive, industrial production, and aerospace.
- M&A Trends: Increasing activity for technology acquisition and market expansion.
- Innovation Barriers: High development costs for AI and specialized expertise requirements.
Vision System Software Growth Trends & Insights
The global vision system software market is poised for substantial expansion, driven by escalating demand for automation and intelligent inspection across diverse industries. The market size, valued at an estimated $4.5 billion in the base year 2025, is projected to reach an impressive $8.2 billion by the forecast year 2033, exhibiting a robust Compound Annual Growth Rate (CAGR) of approximately 7.8% during the study period 2019–2033. This significant growth trajectory is underpinned by several key trends. The increasing adoption of Industry 4.0 principles and the proliferation of smart factories are major catalysts, necessitating sophisticated vision systems for real-time data acquisition, quality control, and process optimization. In the automotive sector, the demand for vision system software is particularly high, driven by the need for advanced driver-assistance systems (ADAS), autonomous driving technology development, and stringent quality checks in vehicle manufacturing. Similarly, the aerospace industry leverages these solutions for intricate component inspection and assembly verification, ensuring unparalleled safety and precision.
Consumer behavior shifts, characterized by a growing preference for higher quality and defect-free products, further fuel the adoption of vision system software. Manufacturers are compelled to invest in advanced inspection technologies to meet these evolving expectations. The rise of cloud-based and web-based vision system software solutions is also a significant growth driver, offering enhanced scalability, accessibility, and remote management capabilities. These platforms facilitate seamless integration with existing manufacturing execution systems (MES) and enterprise resource planning (ERP) systems, providing end-to-end visibility and control. Technological disruptions, including the integration of deep learning for anomaly detection and predictive maintenance, are pushing the boundaries of what vision systems can achieve. This allows for the identification of subtle defects that were previously undetectable and the prediction of potential equipment failures, thereby minimizing downtime and operational costs. Market penetration is deepening across both established and emerging economies, as the benefits of enhanced productivity, reduced waste, and improved product quality become increasingly apparent. The ability of vision system software to adapt to new applications, such as advanced robotics guidance and sophisticated 3D inspection, further solidifies its position as a critical component of modern industrial operations. The forecast period is expected to witness continuous innovation, with a particular focus on the development of more intuitive user interfaces, faster processing speeds, and the integration of edge computing for localized data analysis, further accelerating market adoption and value creation.
Dominant Regions, Countries, or Segments in Vision System Software
The global vision system software market is experiencing dynamic growth, with distinct regional and sectoral dominance. Among the key application segments, Industrial Production stands out as the primary growth driver, projected to account for a substantial portion of the market share throughout the forecast period. This dominance is attributed to the widespread implementation of automation and smart manufacturing initiatives across a vast array of industries, including electronics, food and beverage, pharmaceuticals, and packaging. The relentless pursuit of enhanced efficiency, reduced waste, and superior product quality within manufacturing environments necessitates the adoption of sophisticated vision system software for inspection, guidance, and measurement tasks.
Within the Industrial Production application, the Automotive sub-segment is a critical engine of growth. The increasing complexity of automotive manufacturing, driven by the development of electric vehicles (EVs), advanced driver-assistance systems (ADAS), and autonomous driving technologies, demands highly precise and reliable vision inspection solutions. Companies are leveraging vision system software for everything from assembly line verification and robotic guidance to intricate component inspection and final product quality assurance. The Aerospace sector, while smaller in volume compared to automotive, also represents a high-value application segment. The stringent safety regulations and the critical nature of aerospace components mandate uncompromising quality control, making advanced vision systems indispensable for defect detection, surface inspection, and dimensional analysis of critical parts.
Geographically, North America and Europe currently hold a dominant position in the vision system software market, driven by their well-established industrial bases, high levels of technological adoption, and significant investments in Industry 4.0. Countries like the United States, Germany, and the United Kingdom are at the forefront of implementing advanced vision solutions across their manufacturing sectors. However, the Asia-Pacific region is emerging as a powerhouse for future growth. Rapid industrialization, a burgeoning manufacturing sector, and increasing government support for automation and smart technologies in countries like China, Japan, and South Korea are propelling significant adoption rates.
Considering the Types of vision system software, Cloud-Based solutions are rapidly gaining traction, offering scalability, flexibility, and remote accessibility. This type of deployment is particularly attractive for businesses looking to reduce upfront infrastructure costs and leverage advanced processing power for complex AI-driven vision tasks. Web-based solutions also play a crucial role, providing accessible interfaces for monitoring and control. The synergy between these application segments and regional strengths, coupled with the evolution of software delivery models, will continue to shape the landscape of the vision system software market, driving innovation and expanding its reach across global industries.
Vision System Software Product Landscape
The vision system software landscape is characterized by a constant stream of innovation focused on enhancing intelligence, usability, and application versatility. Leading products are increasingly integrating advanced machine learning and deep learning algorithms, enabling sophisticated defect detection, object recognition, and anomaly identification with unprecedented accuracy. Key developments include the introduction of software platforms that support 3D vision for enhanced depth perception and volumetric measurement, crucial for intricate assembly and inspection tasks. Furthermore, there is a growing emphasis on user-friendly interfaces and no-code/low-code development environments, democratizing the implementation of vision systems for a broader range of users. Real-time data analytics and predictive maintenance capabilities are also becoming standard, allowing for proactive identification of issues and optimization of production processes. The seamless integration of these software solutions with hardware components like cameras, lighting, and robotic arms is paramount, creating cohesive and powerful automation systems.
Key Drivers, Barriers & Challenges in Vision System Software
Key Drivers:
- Industry 4.0 Adoption: The widespread push for smart manufacturing and automation across sectors like automotive and industrial production is a primary catalyst, demanding sophisticated vision capabilities for quality control and efficiency.
- Advancements in AI & ML: Continuous innovation in artificial intelligence and machine learning enables more intelligent defect detection, object recognition, and predictive analytics, expanding the application scope of vision systems.
- Demand for Quality & Precision: Stringent quality standards and the pursuit of defect-free products in industries such as aerospace and pharmaceuticals necessitate high-precision inspection and measurement solutions.
- Cost Reduction & Efficiency Gains: Vision system software helps reduce operational costs through automated inspection, minimizing waste, and increasing throughput, leading to significant ROI for businesses.
Barriers & Challenges:
- High Initial Investment: The upfront cost of implementing comprehensive vision system software and associated hardware can be a significant barrier for smaller enterprises.
- Integration Complexity: Integrating vision systems with existing factory infrastructure and legacy equipment can be challenging, requiring specialized expertise.
- Data Security Concerns: With the rise of cloud-based solutions, ensuring the security and privacy of sensitive production data is a critical challenge.
- Talent Gap: A shortage of skilled professionals who can develop, implement, and maintain advanced vision system solutions can hinder widespread adoption.
- Regulatory Compliance: Navigating diverse and evolving regulatory landscapes in different industries and regions adds complexity to deployment.
Emerging Opportunities in Vision System Software
Emerging opportunities in the vision system software market are largely centered around the increasing sophistication of AI and ML applications, enabling more autonomous and intelligent systems. The burgeoning market for collaborative robots (cobots) presents a significant avenue for growth, as vision systems are crucial for their safe and effective operation, guiding them in complex assembly and pick-and-place tasks. Furthermore, the expansion of IoT (Internet of Things) in manufacturing, often referred to as IIoT (Industrial Internet of Things), provides a fertile ground for vision system software to collect and analyze vast amounts of real-time data, contributing to predictive maintenance and process optimization. The demand for enhanced cybersecurity within industrial environments is also creating opportunities for vision system software vendors to offer integrated security features and solutions. Untapped markets in emerging economies, as they rapidly industrialize and adopt automation, represent substantial growth potential. Innovative applications in areas like augmented reality (AR) for remote assistance and training, powered by vision system data, are also beginning to gain traction.
Growth Accelerators in the Vision System Software Industry
Several growth accelerators are propelling the vision system software industry forward. The relentless pace of technological innovation, particularly in deep learning algorithms, is constantly expanding the capabilities of vision systems, making them indispensable for more complex tasks. Strategic partnerships between software developers, hardware manufacturers, and system integrators are crucial for creating comprehensive and optimized solutions that address specific industry needs. Market expansion strategies, including entering new geographical regions and targeting emerging application areas, are also key drivers. The increasing focus on sustainability and circular economy principles is also indirectly fueling growth, as vision systems play a role in optimizing resource utilization and ensuring product quality for recycling and remanufacturing processes. Furthermore, the growing trend of "lights-out" manufacturing, where factories operate with minimal human intervention, relies heavily on the robustness and intelligence of vision system software.
Key Players Shaping the Vision System Software Market
- Opo Engineering
- Teledyne Dalsa
- Cognex
- iiM AG measurement+engineering
- Volume Graphics
- Infra Tec
- Omron Microscan
- Vision Components
- LMI Technologies
- Kawasaki Robotics
- AMiT
Notable Milestones in Vision System Software Sector
- 2019: Launch of advanced deep learning-based vision systems enabling more sophisticated anomaly detection and classification.
- 2020: Increased adoption of cloud-based vision platforms for remote monitoring, scalability, and data analytics.
- 2021: Significant advancements in 3D vision software for complex inspection and measurement applications.
- 2022: Growing integration of AI-powered vision systems with collaborative robots (cobots) for enhanced automation.
- 2023: Introduction of no-code/low-code vision software development tools, democratizing access for a wider user base.
- 2024: Enhanced cybersecurity features integrated into vision system software to address growing data protection concerns.
- 2025 (Estimated): Expected widespread adoption of edge computing for real-time vision processing directly at the source.
In-Depth Vision System Software Market Outlook
The outlook for the vision system software market remains exceptionally strong, driven by the ongoing digital transformation of industries and the relentless pursuit of automation and intelligence. Growth accelerators such as continuous advancements in AI/ML, strategic ecosystem development, and expansion into untapped geographical markets will continue to fuel this upward trajectory. The market is expected to witness increasing adoption of cloud and edge computing solutions, enabling greater flexibility, scalability, and real-time data processing capabilities. Emerging opportunities in areas like cobot integration, IIoT data analytics, and AR-powered industrial applications will further diversify the market's potential. As industries increasingly prioritize efficiency, quality, and precision, vision system software will solidify its position as a critical enabler of next-generation manufacturing and operational excellence, offering substantial strategic opportunities for stakeholders.
Vision System Software Segmentation
-
1. Application
- 1.1. Automotive
- 1.2. Aerospace
- 1.3. Industrial Production
- 1.4. Others
-
2. Types
- 2.1. Cloud-Based
- 2.2. Web-Based
Vision System Software Segmentation By Geography
-
1. North America
- 1.1. United States
- 1.2. Canada
- 1.3. Mexico
-
2. South America
- 2.1. Brazil
- 2.2. Argentina
- 2.3. Rest of South America
-
3. Europe
- 3.1. United Kingdom
- 3.2. Germany
- 3.3. France
- 3.4. Italy
- 3.5. Spain
- 3.6. Russia
- 3.7. Benelux
- 3.8. Nordics
- 3.9. Rest of Europe
-
4. Middle East & Africa
- 4.1. Turkey
- 4.2. Israel
- 4.3. GCC
- 4.4. North Africa
- 4.5. South Africa
- 4.6. Rest of Middle East & Africa
-
5. Asia Pacific
- 5.1. China
- 5.2. India
- 5.3. Japan
- 5.4. South Korea
- 5.5. ASEAN
- 5.6. Oceania
- 5.7. Rest of Asia Pacific
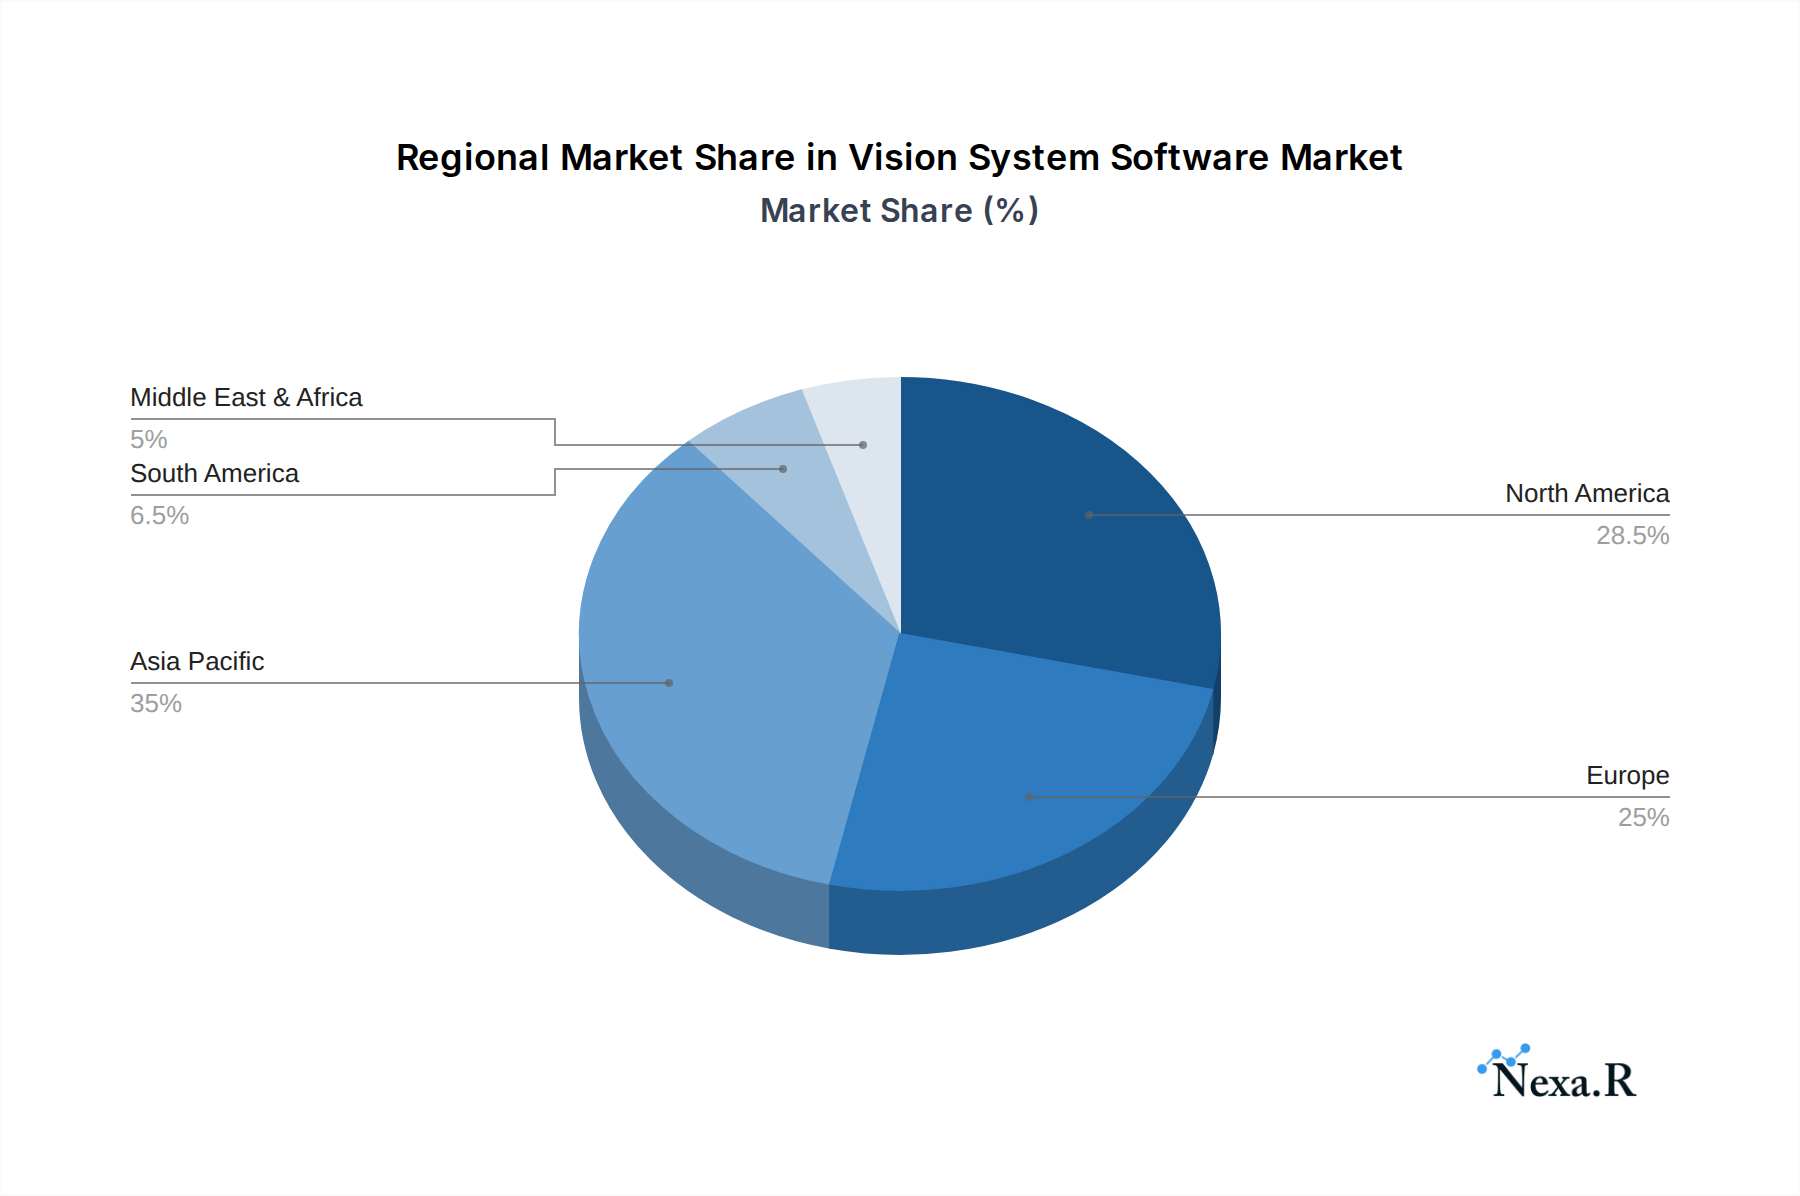
Vision System Software Regional Market Share
Geographic Coverage of Vision System Software
Vision System Software REPORT HIGHLIGHTS
| Aspects | Details |
|---|---|
| Study Period | 2020-2034 |
| Base Year | 2025 |
| Estimated Year | 2026 |
| Forecast Period | 2026-2034 |
| Historical Period | 2020-2025 |
| Growth Rate | CAGR of 8.3% from 2020-2034 |
| Segmentation |
|
Table of Contents
- 1. Introduction
- 1.1. Research Scope
- 1.2. Market Segmentation
- 1.3. Research Methodology
- 1.4. Definitions and Assumptions
- 2. Executive Summary
- 2.1. Introduction
- 3. Market Dynamics
- 3.1. Introduction
- 3.2. Market Drivers
- 3.3. Market Restrains
- 3.4. Market Trends
- 4. Market Factor Analysis
- 4.1. Porters Five Forces
- 4.2. Supply/Value Chain
- 4.3. PESTEL analysis
- 4.4. Market Entropy
- 4.5. Patent/Trademark Analysis
- 5. Global Vision System Software Analysis, Insights and Forecast, 2020-2032
- 5.1. Market Analysis, Insights and Forecast - by Application
- 5.1.1. Automotive
- 5.1.2. Aerospace
- 5.1.3. Industrial Production
- 5.1.4. Others
- 5.2. Market Analysis, Insights and Forecast - by Types
- 5.2.1. Cloud-Based
- 5.2.2. Web-Based
- 5.3. Market Analysis, Insights and Forecast - by Region
- 5.3.1. North America
- 5.3.2. South America
- 5.3.3. Europe
- 5.3.4. Middle East & Africa
- 5.3.5. Asia Pacific
- 5.1. Market Analysis, Insights and Forecast - by Application
- 6. North America Vision System Software Analysis, Insights and Forecast, 2020-2032
- 6.1. Market Analysis, Insights and Forecast - by Application
- 6.1.1. Automotive
- 6.1.2. Aerospace
- 6.1.3. Industrial Production
- 6.1.4. Others
- 6.2. Market Analysis, Insights and Forecast - by Types
- 6.2.1. Cloud-Based
- 6.2.2. Web-Based
- 6.1. Market Analysis, Insights and Forecast - by Application
- 7. South America Vision System Software Analysis, Insights and Forecast, 2020-2032
- 7.1. Market Analysis, Insights and Forecast - by Application
- 7.1.1. Automotive
- 7.1.2. Aerospace
- 7.1.3. Industrial Production
- 7.1.4. Others
- 7.2. Market Analysis, Insights and Forecast - by Types
- 7.2.1. Cloud-Based
- 7.2.2. Web-Based
- 7.1. Market Analysis, Insights and Forecast - by Application
- 8. Europe Vision System Software Analysis, Insights and Forecast, 2020-2032
- 8.1. Market Analysis, Insights and Forecast - by Application
- 8.1.1. Automotive
- 8.1.2. Aerospace
- 8.1.3. Industrial Production
- 8.1.4. Others
- 8.2. Market Analysis, Insights and Forecast - by Types
- 8.2.1. Cloud-Based
- 8.2.2. Web-Based
- 8.1. Market Analysis, Insights and Forecast - by Application
- 9. Middle East & Africa Vision System Software Analysis, Insights and Forecast, 2020-2032
- 9.1. Market Analysis, Insights and Forecast - by Application
- 9.1.1. Automotive
- 9.1.2. Aerospace
- 9.1.3. Industrial Production
- 9.1.4. Others
- 9.2. Market Analysis, Insights and Forecast - by Types
- 9.2.1. Cloud-Based
- 9.2.2. Web-Based
- 9.1. Market Analysis, Insights and Forecast - by Application
- 10. Asia Pacific Vision System Software Analysis, Insights and Forecast, 2020-2032
- 10.1. Market Analysis, Insights and Forecast - by Application
- 10.1.1. Automotive
- 10.1.2. Aerospace
- 10.1.3. Industrial Production
- 10.1.4. Others
- 10.2. Market Analysis, Insights and Forecast - by Types
- 10.2.1. Cloud-Based
- 10.2.2. Web-Based
- 10.1. Market Analysis, Insights and Forecast - by Application
- 11. Competitive Analysis
- 11.1. Global Market Share Analysis 2025
- 11.2. Company Profiles
- 11.2.1 Opo Engineering
- 11.2.1.1. Overview
- 11.2.1.2. Products
- 11.2.1.3. SWOT Analysis
- 11.2.1.4. Recent Developments
- 11.2.1.5. Financials (Based on Availability)
- 11.2.2 Teledyne Dalsa
- 11.2.2.1. Overview
- 11.2.2.2. Products
- 11.2.2.3. SWOT Analysis
- 11.2.2.4. Recent Developments
- 11.2.2.5. Financials (Based on Availability)
- 11.2.3 Cognex
- 11.2.3.1. Overview
- 11.2.3.2. Products
- 11.2.3.3. SWOT Analysis
- 11.2.3.4. Recent Developments
- 11.2.3.5. Financials (Based on Availability)
- 11.2.4 iiM AG measurement+engineering
- 11.2.4.1. Overview
- 11.2.4.2. Products
- 11.2.4.3. SWOT Analysis
- 11.2.4.4. Recent Developments
- 11.2.4.5. Financials (Based on Availability)
- 11.2.5 Volume Graphics
- 11.2.5.1. Overview
- 11.2.5.2. Products
- 11.2.5.3. SWOT Analysis
- 11.2.5.4. Recent Developments
- 11.2.5.5. Financials (Based on Availability)
- 11.2.6 Infra Tec
- 11.2.6.1. Overview
- 11.2.6.2. Products
- 11.2.6.3. SWOT Analysis
- 11.2.6.4. Recent Developments
- 11.2.6.5. Financials (Based on Availability)
- 11.2.7 Omron Microscan
- 11.2.7.1. Overview
- 11.2.7.2. Products
- 11.2.7.3. SWOT Analysis
- 11.2.7.4. Recent Developments
- 11.2.7.5. Financials (Based on Availability)
- 11.2.8 Vision Components
- 11.2.8.1. Overview
- 11.2.8.2. Products
- 11.2.8.3. SWOT Analysis
- 11.2.8.4. Recent Developments
- 11.2.8.5. Financials (Based on Availability)
- 11.2.9 LMI Technologies
- 11.2.9.1. Overview
- 11.2.9.2. Products
- 11.2.9.3. SWOT Analysis
- 11.2.9.4. Recent Developments
- 11.2.9.5. Financials (Based on Availability)
- 11.2.10 Kawasaki Robotics
- 11.2.10.1. Overview
- 11.2.10.2. Products
- 11.2.10.3. SWOT Analysis
- 11.2.10.4. Recent Developments
- 11.2.10.5. Financials (Based on Availability)
- 11.2.11 AMiT
- 11.2.11.1. Overview
- 11.2.11.2. Products
- 11.2.11.3. SWOT Analysis
- 11.2.11.4. Recent Developments
- 11.2.11.5. Financials (Based on Availability)
- 11.2.1 Opo Engineering
List of Figures
- Figure 1: Global Vision System Software Revenue Breakdown (billion, %) by Region 2025 & 2033
- Figure 2: Global Vision System Software Volume Breakdown (K, %) by Region 2025 & 2033
- Figure 3: North America Vision System Software Revenue (billion), by Application 2025 & 2033
- Figure 4: North America Vision System Software Volume (K), by Application 2025 & 2033
- Figure 5: North America Vision System Software Revenue Share (%), by Application 2025 & 2033
- Figure 6: North America Vision System Software Volume Share (%), by Application 2025 & 2033
- Figure 7: North America Vision System Software Revenue (billion), by Types 2025 & 2033
- Figure 8: North America Vision System Software Volume (K), by Types 2025 & 2033
- Figure 9: North America Vision System Software Revenue Share (%), by Types 2025 & 2033
- Figure 10: North America Vision System Software Volume Share (%), by Types 2025 & 2033
- Figure 11: North America Vision System Software Revenue (billion), by Country 2025 & 2033
- Figure 12: North America Vision System Software Volume (K), by Country 2025 & 2033
- Figure 13: North America Vision System Software Revenue Share (%), by Country 2025 & 2033
- Figure 14: North America Vision System Software Volume Share (%), by Country 2025 & 2033
- Figure 15: South America Vision System Software Revenue (billion), by Application 2025 & 2033
- Figure 16: South America Vision System Software Volume (K), by Application 2025 & 2033
- Figure 17: South America Vision System Software Revenue Share (%), by Application 2025 & 2033
- Figure 18: South America Vision System Software Volume Share (%), by Application 2025 & 2033
- Figure 19: South America Vision System Software Revenue (billion), by Types 2025 & 2033
- Figure 20: South America Vision System Software Volume (K), by Types 2025 & 2033
- Figure 21: South America Vision System Software Revenue Share (%), by Types 2025 & 2033
- Figure 22: South America Vision System Software Volume Share (%), by Types 2025 & 2033
- Figure 23: South America Vision System Software Revenue (billion), by Country 2025 & 2033
- Figure 24: South America Vision System Software Volume (K), by Country 2025 & 2033
- Figure 25: South America Vision System Software Revenue Share (%), by Country 2025 & 2033
- Figure 26: South America Vision System Software Volume Share (%), by Country 2025 & 2033
- Figure 27: Europe Vision System Software Revenue (billion), by Application 2025 & 2033
- Figure 28: Europe Vision System Software Volume (K), by Application 2025 & 2033
- Figure 29: Europe Vision System Software Revenue Share (%), by Application 2025 & 2033
- Figure 30: Europe Vision System Software Volume Share (%), by Application 2025 & 2033
- Figure 31: Europe Vision System Software Revenue (billion), by Types 2025 & 2033
- Figure 32: Europe Vision System Software Volume (K), by Types 2025 & 2033
- Figure 33: Europe Vision System Software Revenue Share (%), by Types 2025 & 2033
- Figure 34: Europe Vision System Software Volume Share (%), by Types 2025 & 2033
- Figure 35: Europe Vision System Software Revenue (billion), by Country 2025 & 2033
- Figure 36: Europe Vision System Software Volume (K), by Country 2025 & 2033
- Figure 37: Europe Vision System Software Revenue Share (%), by Country 2025 & 2033
- Figure 38: Europe Vision System Software Volume Share (%), by Country 2025 & 2033
- Figure 39: Middle East & Africa Vision System Software Revenue (billion), by Application 2025 & 2033
- Figure 40: Middle East & Africa Vision System Software Volume (K), by Application 2025 & 2033
- Figure 41: Middle East & Africa Vision System Software Revenue Share (%), by Application 2025 & 2033
- Figure 42: Middle East & Africa Vision System Software Volume Share (%), by Application 2025 & 2033
- Figure 43: Middle East & Africa Vision System Software Revenue (billion), by Types 2025 & 2033
- Figure 44: Middle East & Africa Vision System Software Volume (K), by Types 2025 & 2033
- Figure 45: Middle East & Africa Vision System Software Revenue Share (%), by Types 2025 & 2033
- Figure 46: Middle East & Africa Vision System Software Volume Share (%), by Types 2025 & 2033
- Figure 47: Middle East & Africa Vision System Software Revenue (billion), by Country 2025 & 2033
- Figure 48: Middle East & Africa Vision System Software Volume (K), by Country 2025 & 2033
- Figure 49: Middle East & Africa Vision System Software Revenue Share (%), by Country 2025 & 2033
- Figure 50: Middle East & Africa Vision System Software Volume Share (%), by Country 2025 & 2033
- Figure 51: Asia Pacific Vision System Software Revenue (billion), by Application 2025 & 2033
- Figure 52: Asia Pacific Vision System Software Volume (K), by Application 2025 & 2033
- Figure 53: Asia Pacific Vision System Software Revenue Share (%), by Application 2025 & 2033
- Figure 54: Asia Pacific Vision System Software Volume Share (%), by Application 2025 & 2033
- Figure 55: Asia Pacific Vision System Software Revenue (billion), by Types 2025 & 2033
- Figure 56: Asia Pacific Vision System Software Volume (K), by Types 2025 & 2033
- Figure 57: Asia Pacific Vision System Software Revenue Share (%), by Types 2025 & 2033
- Figure 58: Asia Pacific Vision System Software Volume Share (%), by Types 2025 & 2033
- Figure 59: Asia Pacific Vision System Software Revenue (billion), by Country 2025 & 2033
- Figure 60: Asia Pacific Vision System Software Volume (K), by Country 2025 & 2033
- Figure 61: Asia Pacific Vision System Software Revenue Share (%), by Country 2025 & 2033
- Figure 62: Asia Pacific Vision System Software Volume Share (%), by Country 2025 & 2033
List of Tables
- Table 1: Global Vision System Software Revenue billion Forecast, by Application 2020 & 2033
- Table 2: Global Vision System Software Volume K Forecast, by Application 2020 & 2033
- Table 3: Global Vision System Software Revenue billion Forecast, by Types 2020 & 2033
- Table 4: Global Vision System Software Volume K Forecast, by Types 2020 & 2033
- Table 5: Global Vision System Software Revenue billion Forecast, by Region 2020 & 2033
- Table 6: Global Vision System Software Volume K Forecast, by Region 2020 & 2033
- Table 7: Global Vision System Software Revenue billion Forecast, by Application 2020 & 2033
- Table 8: Global Vision System Software Volume K Forecast, by Application 2020 & 2033
- Table 9: Global Vision System Software Revenue billion Forecast, by Types 2020 & 2033
- Table 10: Global Vision System Software Volume K Forecast, by Types 2020 & 2033
- Table 11: Global Vision System Software Revenue billion Forecast, by Country 2020 & 2033
- Table 12: Global Vision System Software Volume K Forecast, by Country 2020 & 2033
- Table 13: United States Vision System Software Revenue (billion) Forecast, by Application 2020 & 2033
- Table 14: United States Vision System Software Volume (K) Forecast, by Application 2020 & 2033
- Table 15: Canada Vision System Software Revenue (billion) Forecast, by Application 2020 & 2033
- Table 16: Canada Vision System Software Volume (K) Forecast, by Application 2020 & 2033
- Table 17: Mexico Vision System Software Revenue (billion) Forecast, by Application 2020 & 2033
- Table 18: Mexico Vision System Software Volume (K) Forecast, by Application 2020 & 2033
- Table 19: Global Vision System Software Revenue billion Forecast, by Application 2020 & 2033
- Table 20: Global Vision System Software Volume K Forecast, by Application 2020 & 2033
- Table 21: Global Vision System Software Revenue billion Forecast, by Types 2020 & 2033
- Table 22: Global Vision System Software Volume K Forecast, by Types 2020 & 2033
- Table 23: Global Vision System Software Revenue billion Forecast, by Country 2020 & 2033
- Table 24: Global Vision System Software Volume K Forecast, by Country 2020 & 2033
- Table 25: Brazil Vision System Software Revenue (billion) Forecast, by Application 2020 & 2033
- Table 26: Brazil Vision System Software Volume (K) Forecast, by Application 2020 & 2033
- Table 27: Argentina Vision System Software Revenue (billion) Forecast, by Application 2020 & 2033
- Table 28: Argentina Vision System Software Volume (K) Forecast, by Application 2020 & 2033
- Table 29: Rest of South America Vision System Software Revenue (billion) Forecast, by Application 2020 & 2033
- Table 30: Rest of South America Vision System Software Volume (K) Forecast, by Application 2020 & 2033
- Table 31: Global Vision System Software Revenue billion Forecast, by Application 2020 & 2033
- Table 32: Global Vision System Software Volume K Forecast, by Application 2020 & 2033
- Table 33: Global Vision System Software Revenue billion Forecast, by Types 2020 & 2033
- Table 34: Global Vision System Software Volume K Forecast, by Types 2020 & 2033
- Table 35: Global Vision System Software Revenue billion Forecast, by Country 2020 & 2033
- Table 36: Global Vision System Software Volume K Forecast, by Country 2020 & 2033
- Table 37: United Kingdom Vision System Software Revenue (billion) Forecast, by Application 2020 & 2033
- Table 38: United Kingdom Vision System Software Volume (K) Forecast, by Application 2020 & 2033
- Table 39: Germany Vision System Software Revenue (billion) Forecast, by Application 2020 & 2033
- Table 40: Germany Vision System Software Volume (K) Forecast, by Application 2020 & 2033
- Table 41: France Vision System Software Revenue (billion) Forecast, by Application 2020 & 2033
- Table 42: France Vision System Software Volume (K) Forecast, by Application 2020 & 2033
- Table 43: Italy Vision System Software Revenue (billion) Forecast, by Application 2020 & 2033
- Table 44: Italy Vision System Software Volume (K) Forecast, by Application 2020 & 2033
- Table 45: Spain Vision System Software Revenue (billion) Forecast, by Application 2020 & 2033
- Table 46: Spain Vision System Software Volume (K) Forecast, by Application 2020 & 2033
- Table 47: Russia Vision System Software Revenue (billion) Forecast, by Application 2020 & 2033
- Table 48: Russia Vision System Software Volume (K) Forecast, by Application 2020 & 2033
- Table 49: Benelux Vision System Software Revenue (billion) Forecast, by Application 2020 & 2033
- Table 50: Benelux Vision System Software Volume (K) Forecast, by Application 2020 & 2033
- Table 51: Nordics Vision System Software Revenue (billion) Forecast, by Application 2020 & 2033
- Table 52: Nordics Vision System Software Volume (K) Forecast, by Application 2020 & 2033
- Table 53: Rest of Europe Vision System Software Revenue (billion) Forecast, by Application 2020 & 2033
- Table 54: Rest of Europe Vision System Software Volume (K) Forecast, by Application 2020 & 2033
- Table 55: Global Vision System Software Revenue billion Forecast, by Application 2020 & 2033
- Table 56: Global Vision System Software Volume K Forecast, by Application 2020 & 2033
- Table 57: Global Vision System Software Revenue billion Forecast, by Types 2020 & 2033
- Table 58: Global Vision System Software Volume K Forecast, by Types 2020 & 2033
- Table 59: Global Vision System Software Revenue billion Forecast, by Country 2020 & 2033
- Table 60: Global Vision System Software Volume K Forecast, by Country 2020 & 2033
- Table 61: Turkey Vision System Software Revenue (billion) Forecast, by Application 2020 & 2033
- Table 62: Turkey Vision System Software Volume (K) Forecast, by Application 2020 & 2033
- Table 63: Israel Vision System Software Revenue (billion) Forecast, by Application 2020 & 2033
- Table 64: Israel Vision System Software Volume (K) Forecast, by Application 2020 & 2033
- Table 65: GCC Vision System Software Revenue (billion) Forecast, by Application 2020 & 2033
- Table 66: GCC Vision System Software Volume (K) Forecast, by Application 2020 & 2033
- Table 67: North Africa Vision System Software Revenue (billion) Forecast, by Application 2020 & 2033
- Table 68: North Africa Vision System Software Volume (K) Forecast, by Application 2020 & 2033
- Table 69: South Africa Vision System Software Revenue (billion) Forecast, by Application 2020 & 2033
- Table 70: South Africa Vision System Software Volume (K) Forecast, by Application 2020 & 2033
- Table 71: Rest of Middle East & Africa Vision System Software Revenue (billion) Forecast, by Application 2020 & 2033
- Table 72: Rest of Middle East & Africa Vision System Software Volume (K) Forecast, by Application 2020 & 2033
- Table 73: Global Vision System Software Revenue billion Forecast, by Application 2020 & 2033
- Table 74: Global Vision System Software Volume K Forecast, by Application 2020 & 2033
- Table 75: Global Vision System Software Revenue billion Forecast, by Types 2020 & 2033
- Table 76: Global Vision System Software Volume K Forecast, by Types 2020 & 2033
- Table 77: Global Vision System Software Revenue billion Forecast, by Country 2020 & 2033
- Table 78: Global Vision System Software Volume K Forecast, by Country 2020 & 2033
- Table 79: China Vision System Software Revenue (billion) Forecast, by Application 2020 & 2033
- Table 80: China Vision System Software Volume (K) Forecast, by Application 2020 & 2033
- Table 81: India Vision System Software Revenue (billion) Forecast, by Application 2020 & 2033
- Table 82: India Vision System Software Volume (K) Forecast, by Application 2020 & 2033
- Table 83: Japan Vision System Software Revenue (billion) Forecast, by Application 2020 & 2033
- Table 84: Japan Vision System Software Volume (K) Forecast, by Application 2020 & 2033
- Table 85: South Korea Vision System Software Revenue (billion) Forecast, by Application 2020 & 2033
- Table 86: South Korea Vision System Software Volume (K) Forecast, by Application 2020 & 2033
- Table 87: ASEAN Vision System Software Revenue (billion) Forecast, by Application 2020 & 2033
- Table 88: ASEAN Vision System Software Volume (K) Forecast, by Application 2020 & 2033
- Table 89: Oceania Vision System Software Revenue (billion) Forecast, by Application 2020 & 2033
- Table 90: Oceania Vision System Software Volume (K) Forecast, by Application 2020 & 2033
- Table 91: Rest of Asia Pacific Vision System Software Revenue (billion) Forecast, by Application 2020 & 2033
- Table 92: Rest of Asia Pacific Vision System Software Volume (K) Forecast, by Application 2020 & 2033
Frequently Asked Questions
1. What is the projected Compound Annual Growth Rate (CAGR) of the Vision System Software?
The projected CAGR is approximately 8.3%.
2. Which companies are prominent players in the Vision System Software?
Key companies in the market include Opo Engineering, Teledyne Dalsa, Cognex, iiM AG measurement+engineering, Volume Graphics, Infra Tec, Omron Microscan, Vision Components, LMI Technologies, Kawasaki Robotics, AMiT.
3. What are the main segments of the Vision System Software?
The market segments include Application, Types.
4. Can you provide details about the market size?
The market size is estimated to be USD 15.83 billion as of 2022.
5. What are some drivers contributing to market growth?
N/A
6. What are the notable trends driving market growth?
N/A
7. Are there any restraints impacting market growth?
N/A
8. Can you provide examples of recent developments in the market?
N/A
9. What pricing options are available for accessing the report?
Pricing options include single-user, multi-user, and enterprise licenses priced at USD 2900.00, USD 4350.00, and USD 5800.00 respectively.
10. Is the market size provided in terms of value or volume?
The market size is provided in terms of value, measured in billion and volume, measured in K.
11. Are there any specific market keywords associated with the report?
Yes, the market keyword associated with the report is "Vision System Software," which aids in identifying and referencing the specific market segment covered.
12. How do I determine which pricing option suits my needs best?
The pricing options vary based on user requirements and access needs. Individual users may opt for single-user licenses, while businesses requiring broader access may choose multi-user or enterprise licenses for cost-effective access to the report.
13. Are there any additional resources or data provided in the Vision System Software report?
While the report offers comprehensive insights, it's advisable to review the specific contents or supplementary materials provided to ascertain if additional resources or data are available.
14. How can I stay updated on further developments or reports in the Vision System Software?
To stay informed about further developments, trends, and reports in the Vision System Software, consider subscribing to industry newsletters, following relevant companies and organizations, or regularly checking reputable industry news sources and publications.
Methodology
Step 1 - Identification of Relevant Samples Size from Population Database


Step 2 - Approaches for Defining Global Market Size (Value, Volume* & Price*)

Note*: In applicable scenarios
Step 3 - Data Sources
Primary Research
- Web Analytics
- Survey Reports
- Research Institute
- Latest Research Reports
- Opinion Leaders
Secondary Research
- Annual Reports
- White Paper
- Latest Press Release
- Industry Association
- Paid Database
- Investor Presentations

Step 4 - Data Triangulation
Involves using different sources of information in order to increase the validity of a study
These sources are likely to be stakeholders in a program - participants, other researchers, program staff, other community members, and so on.
Then we put all data in single framework & apply various statistical tools to find out the dynamic on the market.
During the analysis stage, feedback from the stakeholder groups would be compared to determine areas of agreement as well as areas of divergence