

Key Insights
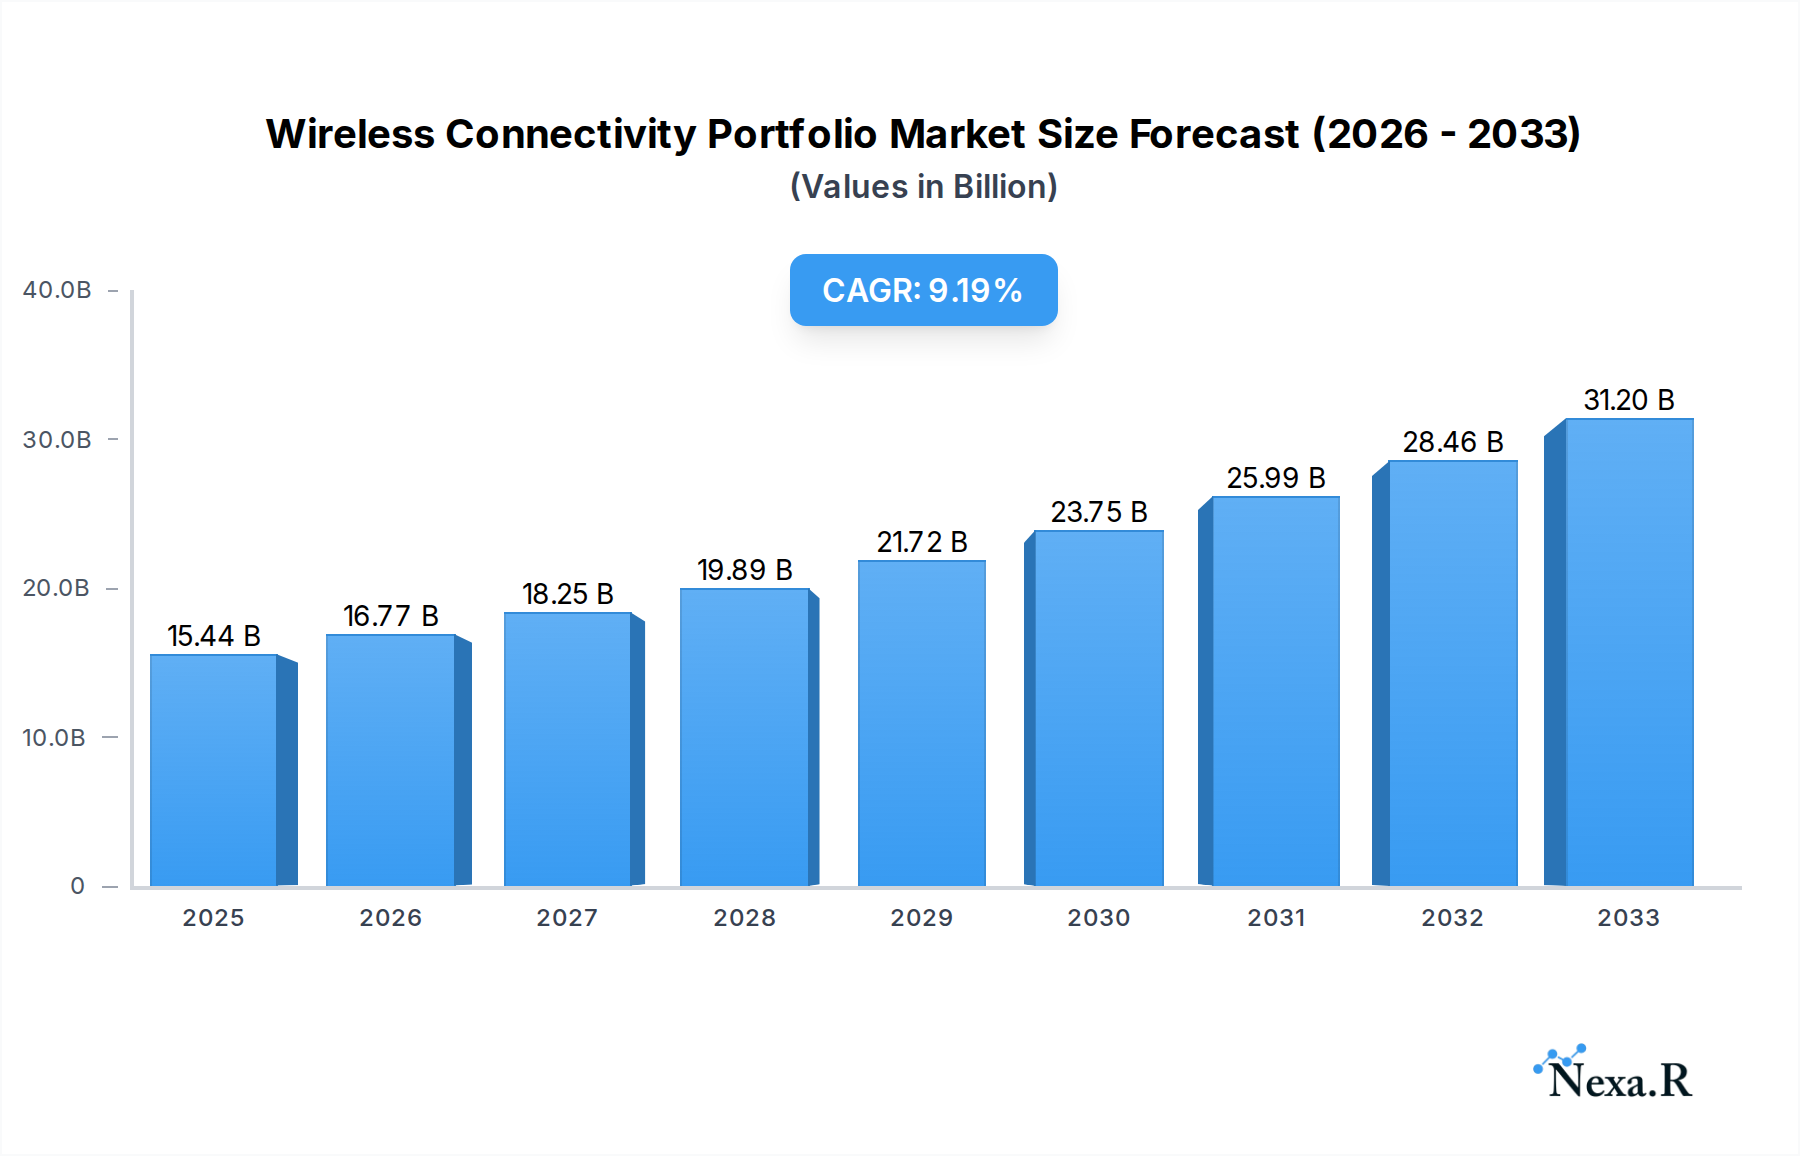
The global Wireless Connectivity Portfolio market is projected for robust expansion, estimated at $15.44 billion in 2025, with a compelling Compound Annual Growth Rate (CAGR) of 8.62% through 2033. This significant growth is fueled by the relentless demand for interconnected devices across a multitude of sectors. The proliferation of the Internet of Things (IoT) is a primary catalyst, driving the adoption of wireless connectivity solutions in consumer electronics, from smart homes to advanced personal devices. Wearable technology, in particular, is experiencing a surge, necessitating seamless and efficient wireless communication for data transfer and user experience. Furthermore, the healthcare industry is increasingly leveraging wireless solutions for remote patient monitoring, telehealth services, and advanced medical equipment, contributing substantially to market expansion. The automotive and transportation sector's transition towards connected vehicles, autonomous driving, and smart infrastructure also represents a critical growth avenue, demanding sophisticated and reliable wireless communication capabilities.

Wireless Connectivity Portfolio Market Size (In Billion)
The market dynamics are further shaped by evolving technological trends such as the increasing integration of Wi-Fi and Bluetooth functionalities within a single chip, offering enhanced flexibility and interoperability for device manufacturers. The rise of Wi-Fi/Bluetooth Smart technologies caters to the growing need for low-power, high-performance connectivity, especially in battery-operated devices. While the market is characterized by strong growth, certain restraints may emerge, including potential complexities in spectrum management and evolving cybersecurity concerns that require robust solutions. Leading companies such as Broadcom, Qualcomm Atheros, and Mediatek are at the forefront, investing heavily in research and development to innovate and meet the escalating demand for advanced wireless connectivity across diverse applications and regions. The Asia Pacific region, driven by China and India, is anticipated to be a major contributor to this growth trajectory, owing to its expanding manufacturing base and increasing consumer adoption of connected devices.
Wireless Connectivity Portfolio Company Market Share
This comprehensive report provides an in-depth analysis of the global Wireless Connectivity Portfolio market, encompassing Wi-Fi, Bluetooth, Wi-Fi/Bluetooth Smart, ZigBee, and other wireless technologies. We delve into critical market dynamics, growth trends, regional dominance, product landscape, key drivers, challenges, and emerging opportunities, offering actionable insights for industry stakeholders. The report covers the historical period from 2019 to 2024, with a base year of 2025 and a detailed forecast extending to 2033.
Wireless Connectivity Portfolio Market Dynamics & Structure
The global Wireless Connectivity Portfolio market is characterized by dynamic competition and rapid technological evolution. Market concentration is moderately fragmented, with key players investing heavily in research and development to maintain a competitive edge. Technological innovation drivers are primarily fueled by the insatiable demand for seamless connectivity across a growing array of devices. Regulatory frameworks, while evolving to ensure interoperability and security, can also present adoption hurdles. Competitive product substitutes are constantly emerging, pushing companies to innovate and differentiate their offerings. End-user demographics are increasingly diverse, with a strong emphasis on convenience, data security, and enhanced user experiences. Mergers and acquisitions (M&A) trends indicate a strategic consolidation to gain market share and acquire specialized technologies.
- Technological Innovation Drivers: 5G integration, IoT expansion, AI-powered device management, miniaturization of chipsets.
- Regulatory Frameworks: Wi-Fi Alliance certifications, Bluetooth SIG standards, spectrum allocation policies.
- Competitive Product Substitutes: Emergence of new short-range communication protocols, advancements in wired connectivity alternatives.
- End-User Demographics: Growing adoption by millennials and Gen Z, increasing demand for smart home automation, evolving needs in enterprise and industrial IoT.
- M&A Trends: Acquisitions focused on AI/ML integration for connectivity optimization, expansion into new application segments like automotive and healthcare.
Wireless Connectivity Portfolio Growth Trends & Insights
The global Wireless Connectivity Portfolio market is projected to witness substantial growth, driven by the pervasive integration of connected devices across diverse applications. The market size is expected to evolve from approximately $40 billion units in 2025 to over $120 billion units by 2033, exhibiting a compound annual growth rate (CAGR) of 14.5% during the forecast period. Adoption rates for advanced wireless technologies like Wi-Fi 6/6E and Bluetooth Low Energy (BLE) are accelerating, fueled by their enhanced speed, lower power consumption, and increased device density capabilities. Technological disruptions, including the convergence of different wireless standards and the development of novel connectivity solutions, are continuously reshaping the market. Consumer behavior shifts towards an always-connected lifestyle, the proliferation of smart homes, and the increasing reliance on wearable devices are further bolstering market penetration. The demand for robust and reliable wireless solutions in industrial settings, healthcare, and automotive applications are also significant growth catalysts.
- Market Size Evolution: From an estimated $40 billion units in 2025 to over $120 billion units in 2033.
- CAGR: 14.5% during the forecast period (2025-2033).
- Adoption Rates: Significant increase in Wi-Fi 6/6E and Bluetooth Low Energy (BLE) adoption.
- Technological Disruptions: Convergence of wireless protocols, development of mesh networking technologies, advancements in ultra-wideband (UWB).
- Consumer Behavior Shifts: Growing demand for smart home automation, seamless multi-device connectivity, and personalized connected experiences.
- Market Penetration: High penetration in consumer electronics, with increasing adoption in industrial IoT, healthcare, and automotive sectors.
Dominant Regions, Countries, or Segments in Wireless Connectivity Portfolio
The Consumer Electronics segment, underpinned by Wi-Fi and Wi-Fi/Bluetooth Smart technologies, is a dominant force in the global Wireless Connectivity Portfolio market. North America and Asia-Pacific are the leading regions, driven by strong economic policies, robust infrastructure development, and a high concentration of technology-savvy consumers and manufacturers. In North America, the United States continues to spearhead innovation and adoption, with significant investments in smart home ecosystems and automotive connectivity. Asia-Pacific, particularly China, Japan, and South Korea, is a massive manufacturing hub and a rapidly growing consumer market, with a strong emphasis on connected devices.
- Dominant Application Segment: Consumer Electronics, accounting for an estimated 60% of the market share in 2025.
- Dominant Type Segments: Wi-Fi and Wi-Fi/Bluetooth Smart, collectively expected to capture over 70% of the market by 2025.
- Leading Regions:
- North America: Driven by high disposable incomes, advanced technological adoption, and significant investments in smart home and automotive sectors.
- Asia-Pacific: Fueled by a vast manufacturing base, a burgeoning middle class, and rapid urbanization leading to increased demand for connected devices.
- Key Countries: United States, China, Japan, South Korea.
- Growth Potential in Emerging Segments: Healthcare and Automotive & Transportation are exhibiting robust growth due to the increasing adoption of remote patient monitoring, connected vehicles, and autonomous driving technologies.
Wireless Connectivity Portfolio Product Landscape
The product landscape of the Wireless Connectivity Portfolio is defined by continuous innovation aimed at enhancing performance, efficiency, and interoperability. Manufacturers are introducing advanced chipsets supporting the latest Wi-Fi standards (Wi-Fi 6/6E/7) and Bluetooth versions (Bluetooth 5.x), offering higher throughput, lower latency, and improved power efficiency. Applications span from smart home devices, wearables, and consumer electronics to critical infrastructure in healthcare, automotive, and industrial IoT. Unique selling propositions include seamless multi-device connectivity, enhanced security features, and integration with AI for intelligent network management. Technological advancements are focused on miniaturization, reduced power consumption for battery-operated devices, and increased range and reliability.
Key Drivers, Barriers & Challenges in Wireless Connectivity Portfolio
Key Drivers: The primary forces propelling the Wireless Connectivity Portfolio market include the exponential growth of the Internet of Things (IoT), the increasing demand for high-speed and reliable wireless communication in consumer electronics, and the rapid adoption of smart technologies in healthcare and automotive sectors. Government initiatives supporting digital infrastructure development and the increasing prevalence of remote work and learning further accelerate adoption.
Key Barriers & Challenges: Significant challenges include the increasing complexity of managing a multitude of connected devices, cybersecurity threats and data privacy concerns, and the ongoing need for spectrum harmonization and regulatory compliance across different regions. Supply chain disruptions, the rising cost of raw materials for chipsets, and the intense competitive pressure can also impact market growth. For instance, semiconductor shortages have led to production delays and increased costs for many wireless components.
Emerging Opportunities in Wireless Connectivity Portfolio
Emerging opportunities lie in the expanding realms of Industrial IoT (IIoT), smart cities, and advanced driver-assistance systems (ADAS) in the automotive sector. The increasing demand for low-power, long-range connectivity solutions for remote sensing and monitoring in agriculture and environmental applications presents a significant untapped market. Furthermore, the integration of AI and machine learning with wireless connectivity is opening doors for predictive maintenance, intelligent automation, and highly personalized user experiences across various industries. The development of specialized connectivity solutions for niche applications, such as augmented reality (AR) and virtual reality (VR) devices, also presents substantial growth potential.
Growth Accelerators in the Wireless Connectivity Portfolio Industry
Catalysts driving long-term growth in the Wireless Connectivity Portfolio industry are multifaceted. Technological breakthroughs, such as the maturation of Wi-Fi 7, the widespread adoption of 5G integration with Wi-Fi offloading, and advancements in low-power wide-area network (LPWAN) technologies, are paving the way for new applications and enhanced user experiences. Strategic partnerships between chipset manufacturers, device makers, and service providers are fostering ecosystem development and driving innovation. Market expansion strategies, including the penetration into emerging economies and the development of tailored solutions for specific industry verticals, are crucial for sustained growth.
Key Players Shaping the Wireless Connectivity Portfolio Market
- Broadcom
- Murata
- Qualcomm Atheros
- Mediatek
- Intel Corporation
- Cypress Semiconductor Corporation
- Texas Instruments
- Atmel Corporation
- STMicroelectronics
- NXP Semiconductors
- Marvell
Notable Milestones in Wireless Connectivity Portfolio Sector
- 2019: Introduction of Wi-Fi 6 (802.11ax) standard, offering significant improvements in speed, capacity, and efficiency.
- 2020: Increased focus on Wi-Fi 6E for enhanced performance in the 6 GHz band, catering to the growing demand for bandwidth-intensive applications.
- 2021: Expansion of Bluetooth 5.2 standard, enabling higher audio quality and more advanced connectivity features for wearables and audio devices.
- 2022: Growing adoption of Thread and Matter protocols for smart home interoperability, driving demand for compatible wireless modules.
- 2023: Advancements in ultra-wideband (UWB) technology for precise location tracking and secure ranging applications.
- 2024: Anticipation of Wi-Fi 7 (802.11be) pre-certification and early product introductions, promising multi-gigabit speeds and enhanced capacity.
In-Depth Wireless Connectivity Portfolio Market Outlook
The future market outlook for the Wireless Connectivity Portfolio is exceptionally robust, driven by synergistic growth across all application segments. Key growth accelerators include the ongoing digital transformation, the relentless expansion of IoT devices requiring seamless connectivity, and the increasing demand for sophisticated wireless solutions in burgeoning sectors like autonomous vehicles and advanced healthcare. Strategic initiatives focused on developing interoperable ecosystems, enhancing cybersecurity, and optimizing power efficiency will be crucial. The market is poised for sustained expansion, offering significant opportunities for innovation and investment as it continues to underpin the connected world.
Wireless Connectivity Portfolio Segmentation
-
1. Application
- 1.1. Consumer Electronics
- 1.2. Wearable Devices/Smart Appliances
- 1.3. Healthcare
- 1.4. Automotive & Transportation
- 1.5. Others
-
2. Type
- 2.1. Wi-Fi
- 2.2. Bluetooth
- 2.3. Wi-Fi/Bluetooth Smart
- 2.4. ZigBee
- 2.5. Others
Wireless Connectivity Portfolio Segmentation By Geography
-
1. North America
- 1.1. United States
- 1.2. Canada
- 1.3. Mexico
-
2. South America
- 2.1. Brazil
- 2.2. Argentina
- 2.3. Rest of South America
-
3. Europe
- 3.1. United Kingdom
- 3.2. Germany
- 3.3. France
- 3.4. Italy
- 3.5. Spain
- 3.6. Russia
- 3.7. Benelux
- 3.8. Nordics
- 3.9. Rest of Europe
-
4. Middle East & Africa
- 4.1. Turkey
- 4.2. Israel
- 4.3. GCC
- 4.4. North Africa
- 4.5. South Africa
- 4.6. Rest of Middle East & Africa
-
5. Asia Pacific
- 5.1. China
- 5.2. India
- 5.3. Japan
- 5.4. South Korea
- 5.5. ASEAN
- 5.6. Oceania
- 5.7. Rest of Asia Pacific
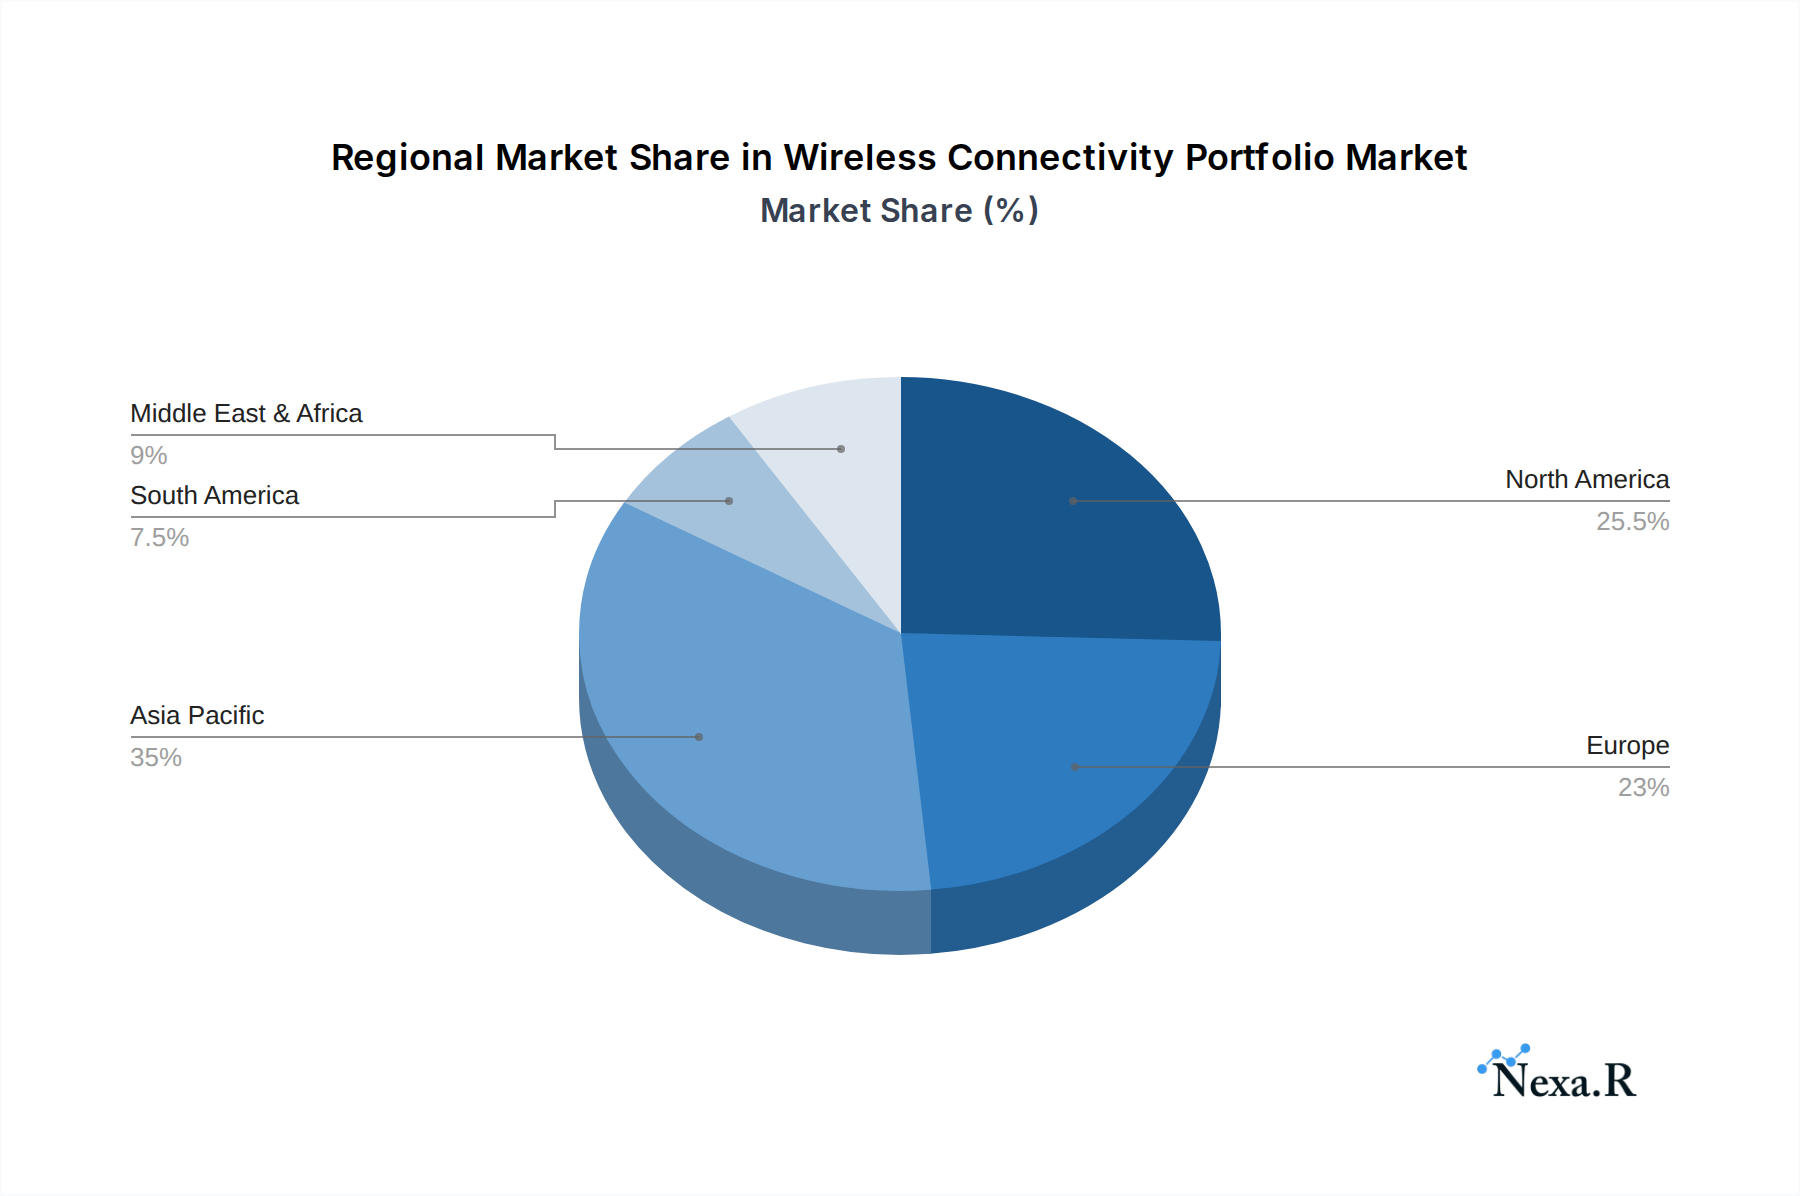
Wireless Connectivity Portfolio Regional Market Share
Geographic Coverage of Wireless Connectivity Portfolio
Wireless Connectivity Portfolio REPORT HIGHLIGHTS
| Aspects | Details |
|---|---|
| Study Period | 2020-2034 |
| Base Year | 2025 |
| Estimated Year | 2026 |
| Forecast Period | 2026-2034 |
| Historical Period | 2020-2025 |
| Growth Rate | CAGR of 11.8% from 2020-2034 |
| Segmentation |
|
Table of Contents
- 1. Introduction
- 1.1. Research Scope
- 1.2. Market Segmentation
- 1.3. Research Objective
- 1.4. Definitions and Assumptions
- 2. Executive Summary
- 2.1. Market Snapshot
- 3. Market Dynamics
- 3.1. Market Drivers
- 3.2. Market Restrains
- 3.3. Market Trends
- 3.4. Market Opportunities
- 4. Market Factor Analysis
- 4.1. Porters Five Forces
- 4.1.1. Bargaining Power of Suppliers
- 4.1.2. Bargaining Power of Buyers
- 4.1.3. Threat of New Entrants
- 4.1.4. Threat of Substitutes
- 4.1.5. Competitive Rivalry
- 4.2. PESTEL analysis
- 4.3. BCG Analysis
- 4.3.1. Stars (High Growth, High Market Share)
- 4.3.2. Cash Cows (Low Growth, High Market Share)
- 4.3.3. Question Mark (High Growth, Low Market Share)
- 4.3.4. Dogs (Low Growth, Low Market Share)
- 4.4. Ansoff Matrix Analysis
- 4.5. Supply Chain Analysis
- 4.6. Regulatory Landscape
- 4.7. Current Market Potential and Opportunity Assessment (TAM–SAM–SOM Framework)
- 4.8. NRP Analyst Note
- 4.1. Porters Five Forces
- 5. Market Analysis, Insights and Forecast 2021-2033
- 5.1. Market Analysis, Insights and Forecast - by Application
- 5.1.1. Consumer Electronics
- 5.1.2. Wearable Devices/Smart Appliances
- 5.1.3. Healthcare
- 5.1.4. Automotive & Transportation
- 5.1.5. Others
- 5.2. Market Analysis, Insights and Forecast - by Type
- 5.2.1. Wi-Fi
- 5.2.2. Bluetooth
- 5.2.3. Wi-Fi/Bluetooth Smart
- 5.2.4. ZigBee
- 5.2.5. Others
- 5.3. Market Analysis, Insights and Forecast - by Region
- 5.3.1. North America
- 5.3.2. South America
- 5.3.3. Europe
- 5.3.4. Middle East & Africa
- 5.3.5. Asia Pacific
- 5.1. Market Analysis, Insights and Forecast - by Application
- 6. Global Wireless Connectivity Portfolio Analysis, Insights and Forecast, 2021-2033
- 6.1. Market Analysis, Insights and Forecast - by Application
- 6.1.1. Consumer Electronics
- 6.1.2. Wearable Devices/Smart Appliances
- 6.1.3. Healthcare
- 6.1.4. Automotive & Transportation
- 6.1.5. Others
- 6.2. Market Analysis, Insights and Forecast - by Type
- 6.2.1. Wi-Fi
- 6.2.2. Bluetooth
- 6.2.3. Wi-Fi/Bluetooth Smart
- 6.2.4. ZigBee
- 6.2.5. Others
- 6.1. Market Analysis, Insights and Forecast - by Application
- 7. North America Wireless Connectivity Portfolio Analysis, Insights and Forecast, 2020-2032
- 7.1. Market Analysis, Insights and Forecast - by Application
- 7.1.1. Consumer Electronics
- 7.1.2. Wearable Devices/Smart Appliances
- 7.1.3. Healthcare
- 7.1.4. Automotive & Transportation
- 7.1.5. Others
- 7.2. Market Analysis, Insights and Forecast - by Type
- 7.2.1. Wi-Fi
- 7.2.2. Bluetooth
- 7.2.3. Wi-Fi/Bluetooth Smart
- 7.2.4. ZigBee
- 7.2.5. Others
- 7.1. Market Analysis, Insights and Forecast - by Application
- 8. South America Wireless Connectivity Portfolio Analysis, Insights and Forecast, 2020-2032
- 8.1. Market Analysis, Insights and Forecast - by Application
- 8.1.1. Consumer Electronics
- 8.1.2. Wearable Devices/Smart Appliances
- 8.1.3. Healthcare
- 8.1.4. Automotive & Transportation
- 8.1.5. Others
- 8.2. Market Analysis, Insights and Forecast - by Type
- 8.2.1. Wi-Fi
- 8.2.2. Bluetooth
- 8.2.3. Wi-Fi/Bluetooth Smart
- 8.2.4. ZigBee
- 8.2.5. Others
- 8.1. Market Analysis, Insights and Forecast - by Application
- 9. Europe Wireless Connectivity Portfolio Analysis, Insights and Forecast, 2020-2032
- 9.1. Market Analysis, Insights and Forecast - by Application
- 9.1.1. Consumer Electronics
- 9.1.2. Wearable Devices/Smart Appliances
- 9.1.3. Healthcare
- 9.1.4. Automotive & Transportation
- 9.1.5. Others
- 9.2. Market Analysis, Insights and Forecast - by Type
- 9.2.1. Wi-Fi
- 9.2.2. Bluetooth
- 9.2.3. Wi-Fi/Bluetooth Smart
- 9.2.4. ZigBee
- 9.2.5. Others
- 9.1. Market Analysis, Insights and Forecast - by Application
- 10. Middle East & Africa Wireless Connectivity Portfolio Analysis, Insights and Forecast, 2020-2032
- 10.1. Market Analysis, Insights and Forecast - by Application
- 10.1.1. Consumer Electronics
- 10.1.2. Wearable Devices/Smart Appliances
- 10.1.3. Healthcare
- 10.1.4. Automotive & Transportation
- 10.1.5. Others
- 10.2. Market Analysis, Insights and Forecast - by Type
- 10.2.1. Wi-Fi
- 10.2.2. Bluetooth
- 10.2.3. Wi-Fi/Bluetooth Smart
- 10.2.4. ZigBee
- 10.2.5. Others
- 10.1. Market Analysis, Insights and Forecast - by Application
- 11. Asia Pacific Wireless Connectivity Portfolio Analysis, Insights and Forecast, 2020-2032
- 11.1. Market Analysis, Insights and Forecast - by Application
- 11.1.1. Consumer Electronics
- 11.1.2. Wearable Devices/Smart Appliances
- 11.1.3. Healthcare
- 11.1.4. Automotive & Transportation
- 11.1.5. Others
- 11.2. Market Analysis, Insights and Forecast - by Type
- 11.2.1. Wi-Fi
- 11.2.2. Bluetooth
- 11.2.3. Wi-Fi/Bluetooth Smart
- 11.2.4. ZigBee
- 11.2.5. Others
- 11.1. Market Analysis, Insights and Forecast - by Application
- 12. Competitive Analysis
- 12.1. Company Profiles
- 12.1.1 Broadcom
- 12.1.1.1. Company Overview
- 12.1.1.2. Products
- 12.1.1.3. Company Financials
- 12.1.1.4. SWOT Analysis
- 12.1.2 Murata
- 12.1.2.1. Company Overview
- 12.1.2.2. Products
- 12.1.2.3. Company Financials
- 12.1.2.4. SWOT Analysis
- 12.1.3 Qualcomm Atheros
- 12.1.3.1. Company Overview
- 12.1.3.2. Products
- 12.1.3.3. Company Financials
- 12.1.3.4. SWOT Analysis
- 12.1.4 Mediatek
- 12.1.4.1. Company Overview
- 12.1.4.2. Products
- 12.1.4.3. Company Financials
- 12.1.4.4. SWOT Analysis
- 12.1.5 Intel Corporation
- 12.1.5.1. Company Overview
- 12.1.5.2. Products
- 12.1.5.3. Company Financials
- 12.1.5.4. SWOT Analysis
- 12.1.6 Cypress Semiconductor Corporation
- 12.1.6.1. Company Overview
- 12.1.6.2. Products
- 12.1.6.3. Company Financials
- 12.1.6.4. SWOT Analysis
- 12.1.7 Texas Instruments
- 12.1.7.1. Company Overview
- 12.1.7.2. Products
- 12.1.7.3. Company Financials
- 12.1.7.4. SWOT Analysis
- 12.1.8 Atmel Corporation
- 12.1.8.1. Company Overview
- 12.1.8.2. Products
- 12.1.8.3. Company Financials
- 12.1.8.4. SWOT Analysis
- 12.1.9 STMicroelectronics
- 12.1.9.1. Company Overview
- 12.1.9.2. Products
- 12.1.9.3. Company Financials
- 12.1.9.4. SWOT Analysis
- 12.1.10 NXP Semiconductors
- 12.1.10.1. Company Overview
- 12.1.10.2. Products
- 12.1.10.3. Company Financials
- 12.1.10.4. SWOT Analysis
- 12.1.11 Marvell
- 12.1.11.1. Company Overview
- 12.1.11.2. Products
- 12.1.11.3. Company Financials
- 12.1.11.4. SWOT Analysis
- 12.1.1 Broadcom
- 12.2. Market Entropy
- 12.2.1 Company's Key Areas Served
- 12.2.2 Recent Developments
- 12.3. Company Market Share Analysis 2025
- 12.3.1 Top 5 Companies Market Share Analysis
- 12.3.2 Top 3 Companies Market Share Analysis
- 12.4. List of Potential Customers
- 13. Research Methodology
List of Figures
- Figure 1: Global Wireless Connectivity Portfolio Revenue Breakdown (undefined, %) by Region 2025 & 2033
- Figure 2: North America Wireless Connectivity Portfolio Revenue (undefined), by Application 2025 & 2033
- Figure 3: North America Wireless Connectivity Portfolio Revenue Share (%), by Application 2025 & 2033
- Figure 4: North America Wireless Connectivity Portfolio Revenue (undefined), by Type 2025 & 2033
- Figure 5: North America Wireless Connectivity Portfolio Revenue Share (%), by Type 2025 & 2033
- Figure 6: North America Wireless Connectivity Portfolio Revenue (undefined), by Country 2025 & 2033
- Figure 7: North America Wireless Connectivity Portfolio Revenue Share (%), by Country 2025 & 2033
- Figure 8: South America Wireless Connectivity Portfolio Revenue (undefined), by Application 2025 & 2033
- Figure 9: South America Wireless Connectivity Portfolio Revenue Share (%), by Application 2025 & 2033
- Figure 10: South America Wireless Connectivity Portfolio Revenue (undefined), by Type 2025 & 2033
- Figure 11: South America Wireless Connectivity Portfolio Revenue Share (%), by Type 2025 & 2033
- Figure 12: South America Wireless Connectivity Portfolio Revenue (undefined), by Country 2025 & 2033
- Figure 13: South America Wireless Connectivity Portfolio Revenue Share (%), by Country 2025 & 2033
- Figure 14: Europe Wireless Connectivity Portfolio Revenue (undefined), by Application 2025 & 2033
- Figure 15: Europe Wireless Connectivity Portfolio Revenue Share (%), by Application 2025 & 2033
- Figure 16: Europe Wireless Connectivity Portfolio Revenue (undefined), by Type 2025 & 2033
- Figure 17: Europe Wireless Connectivity Portfolio Revenue Share (%), by Type 2025 & 2033
- Figure 18: Europe Wireless Connectivity Portfolio Revenue (undefined), by Country 2025 & 2033
- Figure 19: Europe Wireless Connectivity Portfolio Revenue Share (%), by Country 2025 & 2033
- Figure 20: Middle East & Africa Wireless Connectivity Portfolio Revenue (undefined), by Application 2025 & 2033
- Figure 21: Middle East & Africa Wireless Connectivity Portfolio Revenue Share (%), by Application 2025 & 2033
- Figure 22: Middle East & Africa Wireless Connectivity Portfolio Revenue (undefined), by Type 2025 & 2033
- Figure 23: Middle East & Africa Wireless Connectivity Portfolio Revenue Share (%), by Type 2025 & 2033
- Figure 24: Middle East & Africa Wireless Connectivity Portfolio Revenue (undefined), by Country 2025 & 2033
- Figure 25: Middle East & Africa Wireless Connectivity Portfolio Revenue Share (%), by Country 2025 & 2033
- Figure 26: Asia Pacific Wireless Connectivity Portfolio Revenue (undefined), by Application 2025 & 2033
- Figure 27: Asia Pacific Wireless Connectivity Portfolio Revenue Share (%), by Application 2025 & 2033
- Figure 28: Asia Pacific Wireless Connectivity Portfolio Revenue (undefined), by Type 2025 & 2033
- Figure 29: Asia Pacific Wireless Connectivity Portfolio Revenue Share (%), by Type 2025 & 2033
- Figure 30: Asia Pacific Wireless Connectivity Portfolio Revenue (undefined), by Country 2025 & 2033
- Figure 31: Asia Pacific Wireless Connectivity Portfolio Revenue Share (%), by Country 2025 & 2033
List of Tables
- Table 1: Global Wireless Connectivity Portfolio Revenue undefined Forecast, by Application 2020 & 2033
- Table 2: Global Wireless Connectivity Portfolio Revenue undefined Forecast, by Type 2020 & 2033
- Table 3: Global Wireless Connectivity Portfolio Revenue undefined Forecast, by Region 2020 & 2033
- Table 4: Global Wireless Connectivity Portfolio Revenue undefined Forecast, by Application 2020 & 2033
- Table 5: Global Wireless Connectivity Portfolio Revenue undefined Forecast, by Type 2020 & 2033
- Table 6: Global Wireless Connectivity Portfolio Revenue undefined Forecast, by Country 2020 & 2033
- Table 7: United States Wireless Connectivity Portfolio Revenue (undefined) Forecast, by Application 2020 & 2033
- Table 8: Canada Wireless Connectivity Portfolio Revenue (undefined) Forecast, by Application 2020 & 2033
- Table 9: Mexico Wireless Connectivity Portfolio Revenue (undefined) Forecast, by Application 2020 & 2033
- Table 10: Global Wireless Connectivity Portfolio Revenue undefined Forecast, by Application 2020 & 2033
- Table 11: Global Wireless Connectivity Portfolio Revenue undefined Forecast, by Type 2020 & 2033
- Table 12: Global Wireless Connectivity Portfolio Revenue undefined Forecast, by Country 2020 & 2033
- Table 13: Brazil Wireless Connectivity Portfolio Revenue (undefined) Forecast, by Application 2020 & 2033
- Table 14: Argentina Wireless Connectivity Portfolio Revenue (undefined) Forecast, by Application 2020 & 2033
- Table 15: Rest of South America Wireless Connectivity Portfolio Revenue (undefined) Forecast, by Application 2020 & 2033
- Table 16: Global Wireless Connectivity Portfolio Revenue undefined Forecast, by Application 2020 & 2033
- Table 17: Global Wireless Connectivity Portfolio Revenue undefined Forecast, by Type 2020 & 2033
- Table 18: Global Wireless Connectivity Portfolio Revenue undefined Forecast, by Country 2020 & 2033
- Table 19: United Kingdom Wireless Connectivity Portfolio Revenue (undefined) Forecast, by Application 2020 & 2033
- Table 20: Germany Wireless Connectivity Portfolio Revenue (undefined) Forecast, by Application 2020 & 2033
- Table 21: France Wireless Connectivity Portfolio Revenue (undefined) Forecast, by Application 2020 & 2033
- Table 22: Italy Wireless Connectivity Portfolio Revenue (undefined) Forecast, by Application 2020 & 2033
- Table 23: Spain Wireless Connectivity Portfolio Revenue (undefined) Forecast, by Application 2020 & 2033
- Table 24: Russia Wireless Connectivity Portfolio Revenue (undefined) Forecast, by Application 2020 & 2033
- Table 25: Benelux Wireless Connectivity Portfolio Revenue (undefined) Forecast, by Application 2020 & 2033
- Table 26: Nordics Wireless Connectivity Portfolio Revenue (undefined) Forecast, by Application 2020 & 2033
- Table 27: Rest of Europe Wireless Connectivity Portfolio Revenue (undefined) Forecast, by Application 2020 & 2033
- Table 28: Global Wireless Connectivity Portfolio Revenue undefined Forecast, by Application 2020 & 2033
- Table 29: Global Wireless Connectivity Portfolio Revenue undefined Forecast, by Type 2020 & 2033
- Table 30: Global Wireless Connectivity Portfolio Revenue undefined Forecast, by Country 2020 & 2033
- Table 31: Turkey Wireless Connectivity Portfolio Revenue (undefined) Forecast, by Application 2020 & 2033
- Table 32: Israel Wireless Connectivity Portfolio Revenue (undefined) Forecast, by Application 2020 & 2033
- Table 33: GCC Wireless Connectivity Portfolio Revenue (undefined) Forecast, by Application 2020 & 2033
- Table 34: North Africa Wireless Connectivity Portfolio Revenue (undefined) Forecast, by Application 2020 & 2033
- Table 35: South Africa Wireless Connectivity Portfolio Revenue (undefined) Forecast, by Application 2020 & 2033
- Table 36: Rest of Middle East & Africa Wireless Connectivity Portfolio Revenue (undefined) Forecast, by Application 2020 & 2033
- Table 37: Global Wireless Connectivity Portfolio Revenue undefined Forecast, by Application 2020 & 2033
- Table 38: Global Wireless Connectivity Portfolio Revenue undefined Forecast, by Type 2020 & 2033
- Table 39: Global Wireless Connectivity Portfolio Revenue undefined Forecast, by Country 2020 & 2033
- Table 40: China Wireless Connectivity Portfolio Revenue (undefined) Forecast, by Application 2020 & 2033
- Table 41: India Wireless Connectivity Portfolio Revenue (undefined) Forecast, by Application 2020 & 2033
- Table 42: Japan Wireless Connectivity Portfolio Revenue (undefined) Forecast, by Application 2020 & 2033
- Table 43: South Korea Wireless Connectivity Portfolio Revenue (undefined) Forecast, by Application 2020 & 2033
- Table 44: ASEAN Wireless Connectivity Portfolio Revenue (undefined) Forecast, by Application 2020 & 2033
- Table 45: Oceania Wireless Connectivity Portfolio Revenue (undefined) Forecast, by Application 2020 & 2033
- Table 46: Rest of Asia Pacific Wireless Connectivity Portfolio Revenue (undefined) Forecast, by Application 2020 & 2033
Frequently Asked Questions
1. What is the projected Compound Annual Growth Rate (CAGR) of the Wireless Connectivity Portfolio?
The projected CAGR is approximately 11.8%.
2. Which companies are prominent players in the Wireless Connectivity Portfolio?
Key companies in the market include Broadcom, Murata, Qualcomm Atheros, Mediatek, Intel Corporation, Cypress Semiconductor Corporation, Texas Instruments, Atmel Corporation, STMicroelectronics, NXP Semiconductors, Marvell.
3. What are the main segments of the Wireless Connectivity Portfolio?
The market segments include Application, Type.
4. Can you provide details about the market size?
The market size is estimated to be USD XXX N/A as of 2022.
5. What are some drivers contributing to market growth?
N/A
6. What are the notable trends driving market growth?
N/A
7. Are there any restraints impacting market growth?
N/A
8. Can you provide examples of recent developments in the market?
N/A
9. What pricing options are available for accessing the report?
Pricing options include single-user, multi-user, and enterprise licenses priced at USD 2900.00, USD 4350.00, and USD 5800.00 respectively.
10. Is the market size provided in terms of value or volume?
The market size is provided in terms of value, measured in N/A.
11. Are there any specific market keywords associated with the report?
Yes, the market keyword associated with the report is "Wireless Connectivity Portfolio," which aids in identifying and referencing the specific market segment covered.
12. How do I determine which pricing option suits my needs best?
The pricing options vary based on user requirements and access needs. Individual users may opt for single-user licenses, while businesses requiring broader access may choose multi-user or enterprise licenses for cost-effective access to the report.
13. Are there any additional resources or data provided in the Wireless Connectivity Portfolio report?
While the report offers comprehensive insights, it's advisable to review the specific contents or supplementary materials provided to ascertain if additional resources or data are available.
14. How can I stay updated on further developments or reports in the Wireless Connectivity Portfolio?
To stay informed about further developments, trends, and reports in the Wireless Connectivity Portfolio, consider subscribing to industry newsletters, following relevant companies and organizations, or regularly checking reputable industry news sources and publications.
Methodology
Step 1 - Identification of Relevant Samples Size from Population Database


Step 2 - Approaches for Defining Global Market Size (Value, Volume* & Price*)

Note*: In applicable scenarios
Step 3 - Data Sources
Primary Research
- Web Analytics
- Survey Reports
- Research Institute
- Latest Research Reports
- Opinion Leaders
Secondary Research
- Annual Reports
- White Paper
- Latest Press Release
- Industry Association
- Paid Database
- Investor Presentations

Step 4 - Data Triangulation
Involves using different sources of information in order to increase the validity of a study
These sources are likely to be stakeholders in a program - participants, other researchers, program staff, other community members, and so on.
Then we put all data in single framework & apply various statistical tools to find out the dynamic on the market.
During the analysis stage, feedback from the stakeholder groups would be compared to determine areas of agreement as well as areas of divergence