

Key Insights
The global Air Environmental Quality Testing Service market is poised for significant growth, projected to reach $7.43 billion in 2025, driven by an escalating CAGR of 4.6%. This robust expansion is primarily fueled by increasing awareness surrounding the health impacts of air pollution, stringent government regulations mandating air quality monitoring, and a growing demand for cleaner living and working environments. The critical need for comprehensive testing services in diverse sectors such as schools, apartments, and hospitals, where vulnerable populations reside or spend considerable time, acts as a strong catalyst. Furthermore, the rising incidence of respiratory diseases and a greater emphasis on occupational health and safety are compelling organizations to invest in regular air quality assessments, thereby bolstering market demand. The market is segmented into indoor and outdoor detection types, catering to a wide spectrum of environmental monitoring needs.
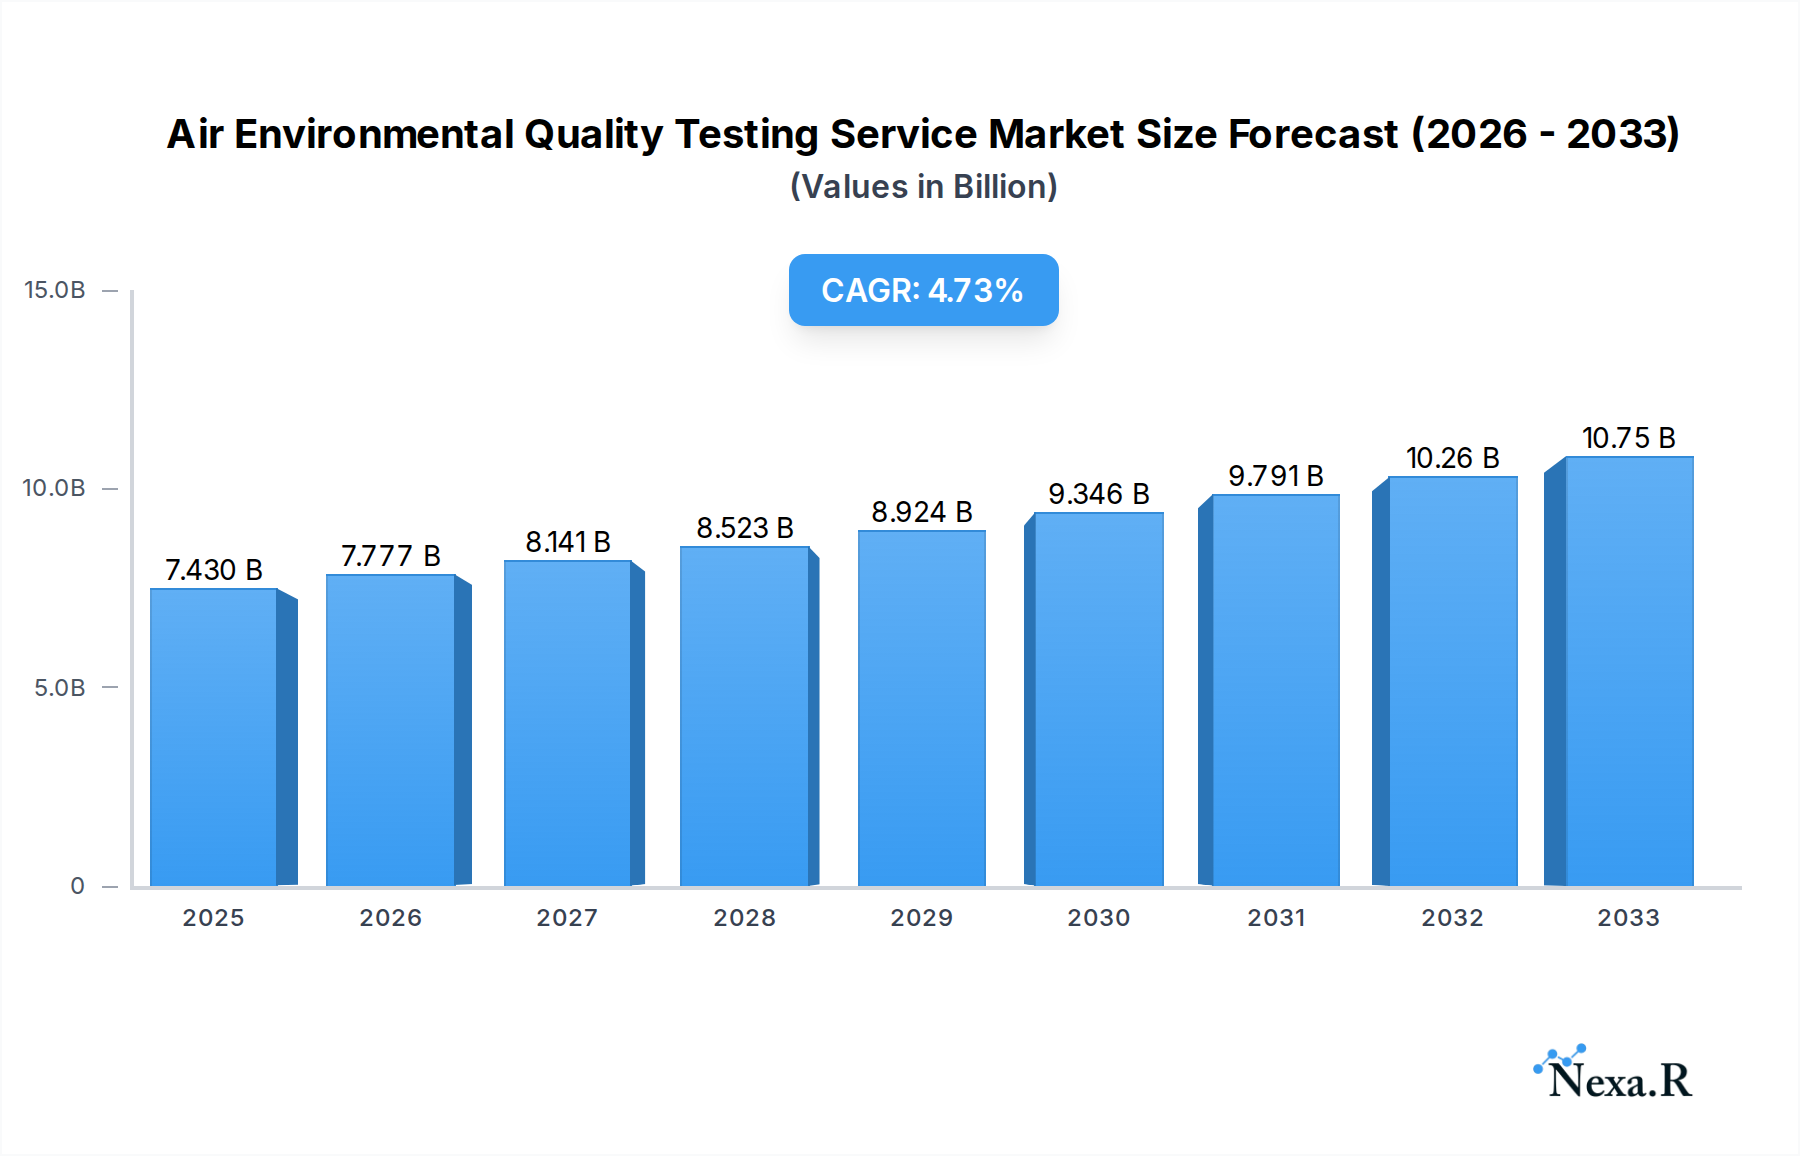
Air Environmental Quality Testing Service Market Size (In Billion)
Emerging trends like the integration of advanced technologies such as IoT sensors and AI-powered analytics for real-time monitoring and predictive analysis are shaping the future of this market. These innovations enable more accurate, efficient, and cost-effective air quality assessments. Geographically, Asia Pacific is expected to emerge as a dominant region due to rapid industrialization, increasing urbanization, and growing environmental concerns. However, the market also faces certain restraints, including the high cost of advanced testing equipment and the need for skilled professionals to interpret complex data. Despite these challenges, the overarching commitment to public health and environmental protection ensures a promising trajectory for the Air Environmental Quality Testing Service market in the forecast period from 2025 to 2033.

Air Environmental Quality Testing Service Company Market Share
Air Environmental Quality Testing Service Market Dynamics & Structure
The global Air Environmental Quality Testing Service market is characterized by a moderately concentrated competitive landscape, with a mix of established global players and specialized regional providers. Key industry drivers include escalating concerns regarding public health impacts of air pollution, stringent government regulations mandating air quality monitoring, and a growing awareness of the correlation between indoor air quality and occupant well-being. Technological innovation is a significant catalyst, with advancements in sensor technology, real-time monitoring solutions, and data analytics platforms enhancing accuracy and efficiency. Regulatory frameworks, such as the Clean Air Act and various regional environmental protection agencies, play a crucial role in shaping market demand by setting permissible exposure limits and mandating compliance testing. Competitive product substitutes are limited, primarily revolving around different testing methodologies and reporting standards, but the core need for accredited testing services remains consistent. End-user demographics are diverse, spanning residential, commercial, and industrial sectors, with increasing demand from healthcare facilities and educational institutions. Mergers and acquisitions (M&A) activity is present, though not aggressive, as companies strategically acquire niche expertise or expand their geographical reach to strengthen their market position. For instance, a recent M&A trend observed is the acquisition of smaller, specialized testing firms by larger corporations seeking to broaden their service portfolios.
- Market Concentration: Moderate, with a few dominant global players and numerous smaller regional entities.
- Technological Innovation Drivers: Miniaturization of sensors, IoT integration for real-time data, AI-powered analytics, and cloud-based reporting platforms.
- Regulatory Frameworks: Stringent environmental protection laws, occupational health and safety standards, and building codes influencing testing requirements.
- Competitive Product Substitutes: Primarily differentiated by testing scope, accreditation, and reporting capabilities rather than entirely new service categories.
- End-User Demographics: Broad spectrum including schools, hospitals, apartments, industrial facilities, and public spaces.
- M&A Trends: Strategic acquisitions for talent, technology, and market access, with deal volumes expected to increase by approximately 5% annually.
Air Environmental Quality Testing Service Growth Trends & Insights
The Air Environmental Quality Testing Service market is poised for robust expansion, driven by a confluence of escalating environmental consciousness and evolving regulatory landscapes. The global market size, projected to be valued at approximately $12.5 billion in 2025, is anticipated to witness a Compound Annual Growth Rate (CAGR) of around 7.8% from 2025 to 2033. This impressive growth trajectory is fueled by increasing adoption rates across various sectors, particularly in urbanized areas where air pollution concerns are more pronounced. Technological disruptions are a significant influencer, with the integration of the Internet of Things (IoT) enabling continuous monitoring and predictive analysis of air quality. This shift from periodic testing to real-time data collection is transforming how environmental quality is managed. Consumer behavior is also adapting; individuals and organizations are becoming more proactive in seeking assurance of healthy living and working environments, leading to a surge in demand for comprehensive air quality assessments. The penetration of advanced testing equipment and sophisticated data interpretation services is further accelerating this trend. For example, the increasing use of portable, sensor-based devices allows for more accessible and frequent testing, thereby enhancing market penetration. The historical period from 2019-2024 saw a steady growth of around 6.5% CAGR, laying a strong foundation for the projected accelerated growth in the forecast period. The shift towards evidence-based decision-making in environmental management, supported by accurate testing data, is a paramount factor in this market's ascent.
Dominant Regions, Countries, or Segments in Air Environmental Quality Testing Service
The Indoor Testing segment is projected to be a dominant force driving growth within the global Air Environmental Quality Testing Service market. This dominance stems from a multifaceted interplay of heightened awareness, evolving health standards, and targeted application needs across key sectors. Within the Application segment, Hospitals and Schools are emerging as significant growth engines. Hospitals, due to the critical need for sterile and healthy environments to prevent hospital-acquired infections and ensure patient recovery, are increasingly investing in sophisticated air quality monitoring systems and regular testing. The presence of vulnerable patient populations necessitates stringent control over airborne pathogens and contaminants. Similarly, schools, recognizing the direct impact of indoor air quality on student concentration, learning outcomes, and overall health, are prioritizing comprehensive indoor air quality assessments. Regulations mandating healthy learning environments and parental advocacy are powerful drivers in this segment. The "Others" application category, encompassing commercial offices, retail spaces, and public transportation, also contributes substantially, driven by a growing trend of "wellness real estate" and a desire to attract and retain talent by providing superior indoor environments.
Key drivers for the dominance of Indoor Testing and these specific application segments include:
- Economic Policies: Government incentives and grants for improving indoor environments in public buildings and workplaces.
- Infrastructure Development: Increased construction and retrofitting of buildings with advanced HVAC systems and air purification technologies that require integrated testing.
- Public Health Initiatives: Global and national campaigns highlighting the detrimental effects of poor indoor air quality on respiratory health, allergies, and cognitive function.
- Technological Advancements: Availability of more accurate, affordable, and user-friendly indoor air quality monitoring devices and testing kits.
- Regulatory Compliance: Stricter building codes and occupational health standards that explicitly include indoor air quality parameters.
The market share for Indoor Testing within the broader Air Environmental Quality Testing Service market is estimated to be around 58% in 2025, with a projected growth rate of 8.2% CAGR through 2033. The Hospital application segment is expected to command approximately 25% of the indoor testing market share, while Schools are estimated to hold around 20%. The "Others" segment is anticipated to capture the remaining 55%.
Air Environmental Quality Testing Service Product Landscape
The Air Environmental Quality Testing Service product landscape is evolving rapidly with innovations focused on enhanced accuracy, real-time data acquisition, and user-friendliness. Companies are developing advanced sensor technologies capable of detecting a wider range of pollutants, including volatile organic compounds (VOCs), particulate matter (PM2.5 and PM10), carbon dioxide (CO2), and specific allergens. Portable, connected devices are becoming mainstream, enabling continuous monitoring and immediate data feedback via mobile applications. These products often feature sophisticated algorithms for data analysis and reporting, offering insights into pollution sources and recommending mitigation strategies. Unique selling propositions include accreditation by recognized bodies, integration with smart building management systems, and the ability to provide customized testing protocols for diverse applications such as schools, apartments, and hospitals. Technological advancements are moving towards miniaturization and cost-effectiveness, making comprehensive air quality testing more accessible.
Key Drivers, Barriers & Challenges in Air Environmental Quality Testing Service
Key Drivers:
- Growing Health Concerns: Increasing awareness of the link between air pollution and respiratory illnesses, allergies, and long-term health effects.
- Stringent Regulations: Government mandates and evolving environmental protection laws requiring regular air quality monitoring and compliance.
- Technological Advancements: Development of sophisticated, real-time monitoring devices and data analytics platforms improving accuracy and accessibility.
- Urbanization and Industrialization: Expansion of urban centers and industrial activities leading to increased pollution levels and demand for testing services.
- Focus on Indoor Air Quality (IAQ): Growing recognition of IAQ's impact on productivity, well-being, and learning environments in homes, schools, and workplaces.
Barriers & Challenges:
- High Cost of Advanced Equipment: Initial investment in sophisticated testing instrumentation can be a deterrent for smaller organizations.
- Regulatory Complexity: Navigating a patchwork of regional and international regulations can be challenging and time-consuming.
- Skilled Workforce Shortage: A limited pool of trained professionals capable of operating advanced equipment and interpreting complex data.
- Public Awareness Gap: In some regions, a lack of widespread understanding of the importance of air quality testing and its long-term benefits.
- Data Interpretation and Actionability: Ensuring that collected data is translated into actionable insights and effective remediation strategies for end-users.
Emerging Opportunities in Air Environmental Quality Testing Service
Emerging opportunities lie in the development of integrated smart city solutions for real-time ambient air quality monitoring, predictive pollution modeling using AI, and specialized testing services for emerging contaminants like microplastics and advanced industrial emissions. The growing demand for indoor air quality testing in residential settings, particularly in urban apartments, presents a significant untapped market. Furthermore, the increasing adoption of telehealth and remote work models is driving a need for assurances of healthy home and office environments. Expansion into developing economies with increasing industrialization and growing environmental awareness also offers substantial growth potential. The development of user-friendly, subscription-based testing kits for consumers and small businesses can further democratize access to air quality information.
Growth Accelerators in the Air Environmental Quality Testing Service Industry
Several key catalysts are accelerating the growth of the Air Environmental Quality Testing Service industry. Technological breakthroughs in sensor technology, such as the development of highly sensitive and selective sensors for trace contaminants, are enhancing the precision and scope of testing. Strategic partnerships between testing service providers and HVAC manufacturers, smart building developers, and environmental consulting firms are creating integrated solutions and expanding market reach. Market expansion strategies, including the establishment of testing facilities in underserved regions and the development of localized testing protocols to meet specific regional needs, are also driving growth. The increasing emphasis on sustainability and corporate social responsibility by businesses is leading to greater investment in environmental monitoring and compliance.
Key Players Shaping the Air Environmental Quality Testing Service Market
- CASHINS And Associates
- Focus Environmental
- C.G. Laboratories
- 1Source Safety And Health
- Mechanical Systems
- SGS
- CMA Testing
- Aeroqual
- Envea
Notable Milestones in Air Environmental Quality Testing Service Sector
- 2019: Significant advancements in miniaturized sensor technology for widespread deployment in IoT devices for continuous monitoring.
- 2020: Increased focus on indoor air quality testing due to the global pandemic, leading to heightened demand for HVAC system checks and filtration analysis.
- 2021: Launch of AI-powered predictive analytics platforms for forecasting air pollution events and optimizing intervention strategies.
- 2022: Expansion of regulatory frameworks in several key regions, mandating stricter emission standards for industrial facilities.
- 2023: Integration of cloud-based data management and reporting solutions for enhanced accessibility and collaboration among stakeholders.
- Q1 2024: Emergence of specialized testing services for emerging contaminants, including PFAS and microplastics, in ambient air.
In-Depth Air Environmental Quality Testing Service Market Outlook
The Air Environmental Quality Testing Service market is projected for sustained and accelerated growth, underpinned by persistent global environmental challenges and advancing technological capabilities. The estimated market value of $12.5 billion in 2025 is expected to see a significant upward revision, driven by the ongoing integration of IoT and AI in monitoring solutions, enhancing predictive and preventative measures. Strategic partnerships and market expansion, particularly into rapidly developing economies, will be crucial growth accelerators. The increasing demand for comprehensive indoor air quality assessments in residential and commercial spaces, coupled with stricter regulatory mandates for industrial emissions, paints a promising future for service providers. Future opportunities will be shaped by innovations in real-time, hyper-localized monitoring and the development of integrated environmental management platforms.
Air Environmental Quality Testing Service Segmentation
-
1. Application
- 1.1. School
- 1.2. Apartment
- 1.3. Hospital
- 1.4. Others
-
2. Types
- 2.1. Indoor Testing
- 2.2. Outdoor Detection
Air Environmental Quality Testing Service Segmentation By Geography
-
1. North America
- 1.1. United States
- 1.2. Canada
- 1.3. Mexico
-
2. South America
- 2.1. Brazil
- 2.2. Argentina
- 2.3. Rest of South America
-
3. Europe
- 3.1. United Kingdom
- 3.2. Germany
- 3.3. France
- 3.4. Italy
- 3.5. Spain
- 3.6. Russia
- 3.7. Benelux
- 3.8. Nordics
- 3.9. Rest of Europe
-
4. Middle East & Africa
- 4.1. Turkey
- 4.2. Israel
- 4.3. GCC
- 4.4. North Africa
- 4.5. South Africa
- 4.6. Rest of Middle East & Africa
-
5. Asia Pacific
- 5.1. China
- 5.2. India
- 5.3. Japan
- 5.4. South Korea
- 5.5. ASEAN
- 5.6. Oceania
- 5.7. Rest of Asia Pacific
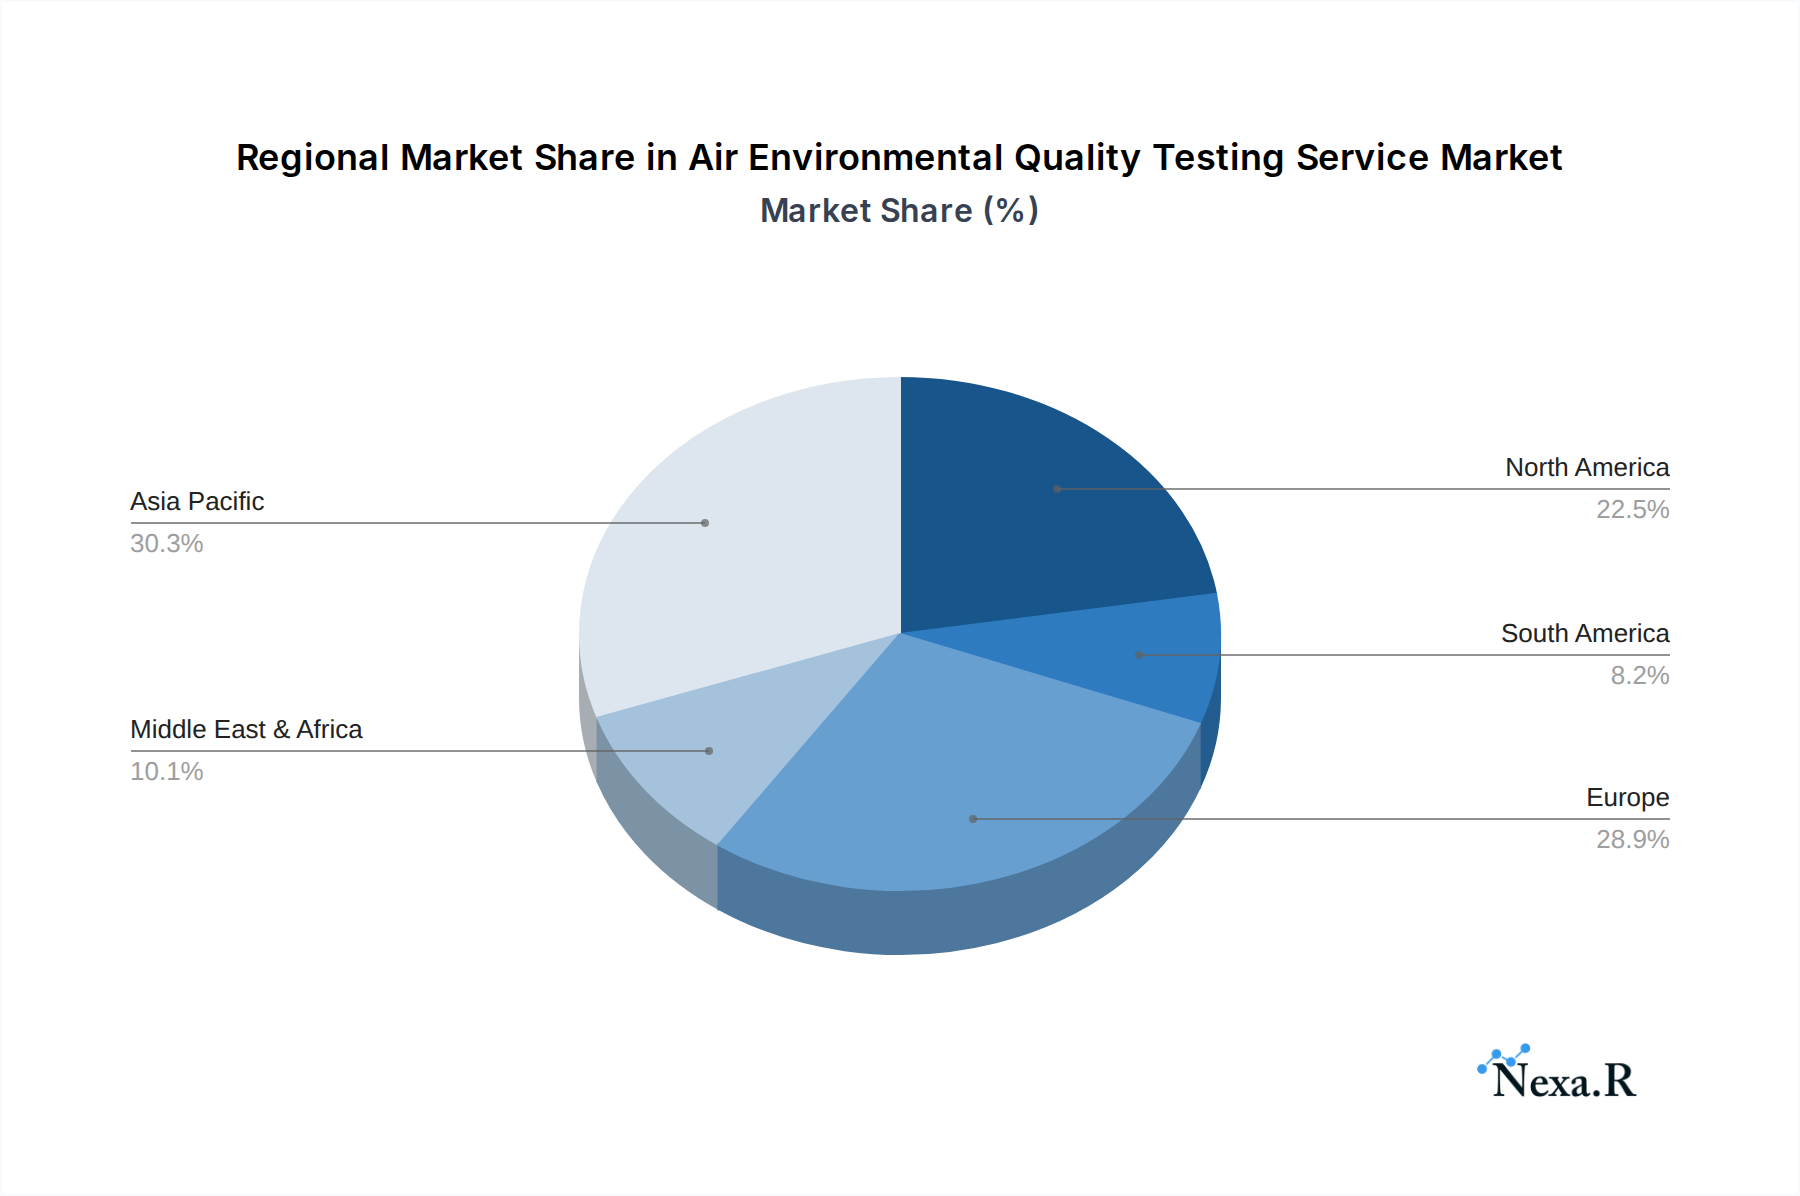
Air Environmental Quality Testing Service Regional Market Share
Geographic Coverage of Air Environmental Quality Testing Service
Air Environmental Quality Testing Service REPORT HIGHLIGHTS
| Aspects | Details |
|---|---|
| Study Period | 2020-2034 |
| Base Year | 2025 |
| Estimated Year | 2026 |
| Forecast Period | 2026-2034 |
| Historical Period | 2020-2025 |
| Growth Rate | CAGR of 4.6% from 2020-2034 |
| Segmentation |
|
Table of Contents
- 1. Introduction
- 1.1. Research Scope
- 1.2. Market Segmentation
- 1.3. Research Methodology
- 1.4. Definitions and Assumptions
- 2. Executive Summary
- 2.1. Introduction
- 3. Market Dynamics
- 3.1. Introduction
- 3.2. Market Drivers
- 3.3. Market Restrains
- 3.4. Market Trends
- 4. Market Factor Analysis
- 4.1. Porters Five Forces
- 4.2. Supply/Value Chain
- 4.3. PESTEL analysis
- 4.4. Market Entropy
- 4.5. Patent/Trademark Analysis
- 5. Global Air Environmental Quality Testing Service Analysis, Insights and Forecast, 2020-2032
- 5.1. Market Analysis, Insights and Forecast - by Application
- 5.1.1. School
- 5.1.2. Apartment
- 5.1.3. Hospital
- 5.1.4. Others
- 5.2. Market Analysis, Insights and Forecast - by Types
- 5.2.1. Indoor Testing
- 5.2.2. Outdoor Detection
- 5.3. Market Analysis, Insights and Forecast - by Region
- 5.3.1. North America
- 5.3.2. South America
- 5.3.3. Europe
- 5.3.4. Middle East & Africa
- 5.3.5. Asia Pacific
- 5.1. Market Analysis, Insights and Forecast - by Application
- 6. North America Air Environmental Quality Testing Service Analysis, Insights and Forecast, 2020-2032
- 6.1. Market Analysis, Insights and Forecast - by Application
- 6.1.1. School
- 6.1.2. Apartment
- 6.1.3. Hospital
- 6.1.4. Others
- 6.2. Market Analysis, Insights and Forecast - by Types
- 6.2.1. Indoor Testing
- 6.2.2. Outdoor Detection
- 6.1. Market Analysis, Insights and Forecast - by Application
- 7. South America Air Environmental Quality Testing Service Analysis, Insights and Forecast, 2020-2032
- 7.1. Market Analysis, Insights and Forecast - by Application
- 7.1.1. School
- 7.1.2. Apartment
- 7.1.3. Hospital
- 7.1.4. Others
- 7.2. Market Analysis, Insights and Forecast - by Types
- 7.2.1. Indoor Testing
- 7.2.2. Outdoor Detection
- 7.1. Market Analysis, Insights and Forecast - by Application
- 8. Europe Air Environmental Quality Testing Service Analysis, Insights and Forecast, 2020-2032
- 8.1. Market Analysis, Insights and Forecast - by Application
- 8.1.1. School
- 8.1.2. Apartment
- 8.1.3. Hospital
- 8.1.4. Others
- 8.2. Market Analysis, Insights and Forecast - by Types
- 8.2.1. Indoor Testing
- 8.2.2. Outdoor Detection
- 8.1. Market Analysis, Insights and Forecast - by Application
- 9. Middle East & Africa Air Environmental Quality Testing Service Analysis, Insights and Forecast, 2020-2032
- 9.1. Market Analysis, Insights and Forecast - by Application
- 9.1.1. School
- 9.1.2. Apartment
- 9.1.3. Hospital
- 9.1.4. Others
- 9.2. Market Analysis, Insights and Forecast - by Types
- 9.2.1. Indoor Testing
- 9.2.2. Outdoor Detection
- 9.1. Market Analysis, Insights and Forecast - by Application
- 10. Asia Pacific Air Environmental Quality Testing Service Analysis, Insights and Forecast, 2020-2032
- 10.1. Market Analysis, Insights and Forecast - by Application
- 10.1.1. School
- 10.1.2. Apartment
- 10.1.3. Hospital
- 10.1.4. Others
- 10.2. Market Analysis, Insights and Forecast - by Types
- 10.2.1. Indoor Testing
- 10.2.2. Outdoor Detection
- 10.1. Market Analysis, Insights and Forecast - by Application
- 11. Competitive Analysis
- 11.1. Global Market Share Analysis 2025
- 11.2. Company Profiles
- 11.2.1 CASHINS And Associates
- 11.2.1.1. Overview
- 11.2.1.2. Products
- 11.2.1.3. SWOT Analysis
- 11.2.1.4. Recent Developments
- 11.2.1.5. Financials (Based on Availability)
- 11.2.2 Focus Environmental
- 11.2.2.1. Overview
- 11.2.2.2. Products
- 11.2.2.3. SWOT Analysis
- 11.2.2.4. Recent Developments
- 11.2.2.5. Financials (Based on Availability)
- 11.2.3 C.G. Laboratories
- 11.2.3.1. Overview
- 11.2.3.2. Products
- 11.2.3.3. SWOT Analysis
- 11.2.3.4. Recent Developments
- 11.2.3.5. Financials (Based on Availability)
- 11.2.4 1Source Safety And Health
- 11.2.4.1. Overview
- 11.2.4.2. Products
- 11.2.4.3. SWOT Analysis
- 11.2.4.4. Recent Developments
- 11.2.4.5. Financials (Based on Availability)
- 11.2.5 Mechanical Systems
- 11.2.5.1. Overview
- 11.2.5.2. Products
- 11.2.5.3. SWOT Analysis
- 11.2.5.4. Recent Developments
- 11.2.5.5. Financials (Based on Availability)
- 11.2.6 SGS
- 11.2.6.1. Overview
- 11.2.6.2. Products
- 11.2.6.3. SWOT Analysis
- 11.2.6.4. Recent Developments
- 11.2.6.5. Financials (Based on Availability)
- 11.2.7 CMA Testing
- 11.2.7.1. Overview
- 11.2.7.2. Products
- 11.2.7.3. SWOT Analysis
- 11.2.7.4. Recent Developments
- 11.2.7.5. Financials (Based on Availability)
- 11.2.8 Aeroqual
- 11.2.8.1. Overview
- 11.2.8.2. Products
- 11.2.8.3. SWOT Analysis
- 11.2.8.4. Recent Developments
- 11.2.8.5. Financials (Based on Availability)
- 11.2.9 Envea
- 11.2.9.1. Overview
- 11.2.9.2. Products
- 11.2.9.3. SWOT Analysis
- 11.2.9.4. Recent Developments
- 11.2.9.5. Financials (Based on Availability)
- 11.2.1 CASHINS And Associates
List of Figures
- Figure 1: Global Air Environmental Quality Testing Service Revenue Breakdown (undefined, %) by Region 2025 & 2033
- Figure 2: North America Air Environmental Quality Testing Service Revenue (undefined), by Application 2025 & 2033
- Figure 3: North America Air Environmental Quality Testing Service Revenue Share (%), by Application 2025 & 2033
- Figure 4: North America Air Environmental Quality Testing Service Revenue (undefined), by Types 2025 & 2033
- Figure 5: North America Air Environmental Quality Testing Service Revenue Share (%), by Types 2025 & 2033
- Figure 6: North America Air Environmental Quality Testing Service Revenue (undefined), by Country 2025 & 2033
- Figure 7: North America Air Environmental Quality Testing Service Revenue Share (%), by Country 2025 & 2033
- Figure 8: South America Air Environmental Quality Testing Service Revenue (undefined), by Application 2025 & 2033
- Figure 9: South America Air Environmental Quality Testing Service Revenue Share (%), by Application 2025 & 2033
- Figure 10: South America Air Environmental Quality Testing Service Revenue (undefined), by Types 2025 & 2033
- Figure 11: South America Air Environmental Quality Testing Service Revenue Share (%), by Types 2025 & 2033
- Figure 12: South America Air Environmental Quality Testing Service Revenue (undefined), by Country 2025 & 2033
- Figure 13: South America Air Environmental Quality Testing Service Revenue Share (%), by Country 2025 & 2033
- Figure 14: Europe Air Environmental Quality Testing Service Revenue (undefined), by Application 2025 & 2033
- Figure 15: Europe Air Environmental Quality Testing Service Revenue Share (%), by Application 2025 & 2033
- Figure 16: Europe Air Environmental Quality Testing Service Revenue (undefined), by Types 2025 & 2033
- Figure 17: Europe Air Environmental Quality Testing Service Revenue Share (%), by Types 2025 & 2033
- Figure 18: Europe Air Environmental Quality Testing Service Revenue (undefined), by Country 2025 & 2033
- Figure 19: Europe Air Environmental Quality Testing Service Revenue Share (%), by Country 2025 & 2033
- Figure 20: Middle East & Africa Air Environmental Quality Testing Service Revenue (undefined), by Application 2025 & 2033
- Figure 21: Middle East & Africa Air Environmental Quality Testing Service Revenue Share (%), by Application 2025 & 2033
- Figure 22: Middle East & Africa Air Environmental Quality Testing Service Revenue (undefined), by Types 2025 & 2033
- Figure 23: Middle East & Africa Air Environmental Quality Testing Service Revenue Share (%), by Types 2025 & 2033
- Figure 24: Middle East & Africa Air Environmental Quality Testing Service Revenue (undefined), by Country 2025 & 2033
- Figure 25: Middle East & Africa Air Environmental Quality Testing Service Revenue Share (%), by Country 2025 & 2033
- Figure 26: Asia Pacific Air Environmental Quality Testing Service Revenue (undefined), by Application 2025 & 2033
- Figure 27: Asia Pacific Air Environmental Quality Testing Service Revenue Share (%), by Application 2025 & 2033
- Figure 28: Asia Pacific Air Environmental Quality Testing Service Revenue (undefined), by Types 2025 & 2033
- Figure 29: Asia Pacific Air Environmental Quality Testing Service Revenue Share (%), by Types 2025 & 2033
- Figure 30: Asia Pacific Air Environmental Quality Testing Service Revenue (undefined), by Country 2025 & 2033
- Figure 31: Asia Pacific Air Environmental Quality Testing Service Revenue Share (%), by Country 2025 & 2033
List of Tables
- Table 1: Global Air Environmental Quality Testing Service Revenue undefined Forecast, by Application 2020 & 2033
- Table 2: Global Air Environmental Quality Testing Service Revenue undefined Forecast, by Types 2020 & 2033
- Table 3: Global Air Environmental Quality Testing Service Revenue undefined Forecast, by Region 2020 & 2033
- Table 4: Global Air Environmental Quality Testing Service Revenue undefined Forecast, by Application 2020 & 2033
- Table 5: Global Air Environmental Quality Testing Service Revenue undefined Forecast, by Types 2020 & 2033
- Table 6: Global Air Environmental Quality Testing Service Revenue undefined Forecast, by Country 2020 & 2033
- Table 7: United States Air Environmental Quality Testing Service Revenue (undefined) Forecast, by Application 2020 & 2033
- Table 8: Canada Air Environmental Quality Testing Service Revenue (undefined) Forecast, by Application 2020 & 2033
- Table 9: Mexico Air Environmental Quality Testing Service Revenue (undefined) Forecast, by Application 2020 & 2033
- Table 10: Global Air Environmental Quality Testing Service Revenue undefined Forecast, by Application 2020 & 2033
- Table 11: Global Air Environmental Quality Testing Service Revenue undefined Forecast, by Types 2020 & 2033
- Table 12: Global Air Environmental Quality Testing Service Revenue undefined Forecast, by Country 2020 & 2033
- Table 13: Brazil Air Environmental Quality Testing Service Revenue (undefined) Forecast, by Application 2020 & 2033
- Table 14: Argentina Air Environmental Quality Testing Service Revenue (undefined) Forecast, by Application 2020 & 2033
- Table 15: Rest of South America Air Environmental Quality Testing Service Revenue (undefined) Forecast, by Application 2020 & 2033
- Table 16: Global Air Environmental Quality Testing Service Revenue undefined Forecast, by Application 2020 & 2033
- Table 17: Global Air Environmental Quality Testing Service Revenue undefined Forecast, by Types 2020 & 2033
- Table 18: Global Air Environmental Quality Testing Service Revenue undefined Forecast, by Country 2020 & 2033
- Table 19: United Kingdom Air Environmental Quality Testing Service Revenue (undefined) Forecast, by Application 2020 & 2033
- Table 20: Germany Air Environmental Quality Testing Service Revenue (undefined) Forecast, by Application 2020 & 2033
- Table 21: France Air Environmental Quality Testing Service Revenue (undefined) Forecast, by Application 2020 & 2033
- Table 22: Italy Air Environmental Quality Testing Service Revenue (undefined) Forecast, by Application 2020 & 2033
- Table 23: Spain Air Environmental Quality Testing Service Revenue (undefined) Forecast, by Application 2020 & 2033
- Table 24: Russia Air Environmental Quality Testing Service Revenue (undefined) Forecast, by Application 2020 & 2033
- Table 25: Benelux Air Environmental Quality Testing Service Revenue (undefined) Forecast, by Application 2020 & 2033
- Table 26: Nordics Air Environmental Quality Testing Service Revenue (undefined) Forecast, by Application 2020 & 2033
- Table 27: Rest of Europe Air Environmental Quality Testing Service Revenue (undefined) Forecast, by Application 2020 & 2033
- Table 28: Global Air Environmental Quality Testing Service Revenue undefined Forecast, by Application 2020 & 2033
- Table 29: Global Air Environmental Quality Testing Service Revenue undefined Forecast, by Types 2020 & 2033
- Table 30: Global Air Environmental Quality Testing Service Revenue undefined Forecast, by Country 2020 & 2033
- Table 31: Turkey Air Environmental Quality Testing Service Revenue (undefined) Forecast, by Application 2020 & 2033
- Table 32: Israel Air Environmental Quality Testing Service Revenue (undefined) Forecast, by Application 2020 & 2033
- Table 33: GCC Air Environmental Quality Testing Service Revenue (undefined) Forecast, by Application 2020 & 2033
- Table 34: North Africa Air Environmental Quality Testing Service Revenue (undefined) Forecast, by Application 2020 & 2033
- Table 35: South Africa Air Environmental Quality Testing Service Revenue (undefined) Forecast, by Application 2020 & 2033
- Table 36: Rest of Middle East & Africa Air Environmental Quality Testing Service Revenue (undefined) Forecast, by Application 2020 & 2033
- Table 37: Global Air Environmental Quality Testing Service Revenue undefined Forecast, by Application 2020 & 2033
- Table 38: Global Air Environmental Quality Testing Service Revenue undefined Forecast, by Types 2020 & 2033
- Table 39: Global Air Environmental Quality Testing Service Revenue undefined Forecast, by Country 2020 & 2033
- Table 40: China Air Environmental Quality Testing Service Revenue (undefined) Forecast, by Application 2020 & 2033
- Table 41: India Air Environmental Quality Testing Service Revenue (undefined) Forecast, by Application 2020 & 2033
- Table 42: Japan Air Environmental Quality Testing Service Revenue (undefined) Forecast, by Application 2020 & 2033
- Table 43: South Korea Air Environmental Quality Testing Service Revenue (undefined) Forecast, by Application 2020 & 2033
- Table 44: ASEAN Air Environmental Quality Testing Service Revenue (undefined) Forecast, by Application 2020 & 2033
- Table 45: Oceania Air Environmental Quality Testing Service Revenue (undefined) Forecast, by Application 2020 & 2033
- Table 46: Rest of Asia Pacific Air Environmental Quality Testing Service Revenue (undefined) Forecast, by Application 2020 & 2033
Frequently Asked Questions
1. What is the projected Compound Annual Growth Rate (CAGR) of the Air Environmental Quality Testing Service?
The projected CAGR is approximately 4.6%.
2. Which companies are prominent players in the Air Environmental Quality Testing Service?
Key companies in the market include CASHINS And Associates, Focus Environmental, C.G. Laboratories, 1Source Safety And Health, Mechanical Systems, SGS, CMA Testing, Aeroqual, Envea.
3. What are the main segments of the Air Environmental Quality Testing Service?
The market segments include Application, Types.
4. Can you provide details about the market size?
The market size is estimated to be USD XXX N/A as of 2022.
5. What are some drivers contributing to market growth?
N/A
6. What are the notable trends driving market growth?
N/A
7. Are there any restraints impacting market growth?
N/A
8. Can you provide examples of recent developments in the market?
N/A
9. What pricing options are available for accessing the report?
Pricing options include single-user, multi-user, and enterprise licenses priced at USD 3350.00, USD 5025.00, and USD 6700.00 respectively.
10. Is the market size provided in terms of value or volume?
The market size is provided in terms of value, measured in N/A.
11. Are there any specific market keywords associated with the report?
Yes, the market keyword associated with the report is "Air Environmental Quality Testing Service," which aids in identifying and referencing the specific market segment covered.
12. How do I determine which pricing option suits my needs best?
The pricing options vary based on user requirements and access needs. Individual users may opt for single-user licenses, while businesses requiring broader access may choose multi-user or enterprise licenses for cost-effective access to the report.
13. Are there any additional resources or data provided in the Air Environmental Quality Testing Service report?
While the report offers comprehensive insights, it's advisable to review the specific contents or supplementary materials provided to ascertain if additional resources or data are available.
14. How can I stay updated on further developments or reports in the Air Environmental Quality Testing Service?
To stay informed about further developments, trends, and reports in the Air Environmental Quality Testing Service, consider subscribing to industry newsletters, following relevant companies and organizations, or regularly checking reputable industry news sources and publications.
Methodology
Step 1 - Identification of Relevant Samples Size from Population Database


Step 2 - Approaches for Defining Global Market Size (Value, Volume* & Price*)

Note*: In applicable scenarios
Step 3 - Data Sources
Primary Research
- Web Analytics
- Survey Reports
- Research Institute
- Latest Research Reports
- Opinion Leaders
Secondary Research
- Annual Reports
- White Paper
- Latest Press Release
- Industry Association
- Paid Database
- Investor Presentations

Step 4 - Data Triangulation
Involves using different sources of information in order to increase the validity of a study
These sources are likely to be stakeholders in a program - participants, other researchers, program staff, other community members, and so on.
Then we put all data in single framework & apply various statistical tools to find out the dynamic on the market.
During the analysis stage, feedback from the stakeholder groups would be compared to determine areas of agreement as well as areas of divergence