

Key Insights
The global anticancer injection market is experiencing substantial growth, propelled by increasing cancer diagnoses, an expanding elderly demographic, and significant advancements in targeted therapeutic agents. The market is projected to reach $9.27 billion by 2025, with a compound annual growth rate (CAGR) of 13.34%. This expansion is further amplified by escalating R&D investments, leading to the introduction of innovative and highly effective anticancer injections featuring enhanced safety profiles. Key market segments encompass various anticancer injection types, classified by their mechanism of action, such as monoclonal antibodies and cytotoxic agents, and by the specific cancer types they treat, including lung, breast, and colorectal cancers. The competitive landscape is marked by intense rivalry, with major pharmaceutical entities including Roche (Genentech), Novartis, Pfizer, and Amgen commanding significant market shares. Concurrently, emerging biopharmaceutical companies from regions like China, such as Innovent Biologics and Hengrui Medicine, are actively contributing to market dynamics and driving innovation.
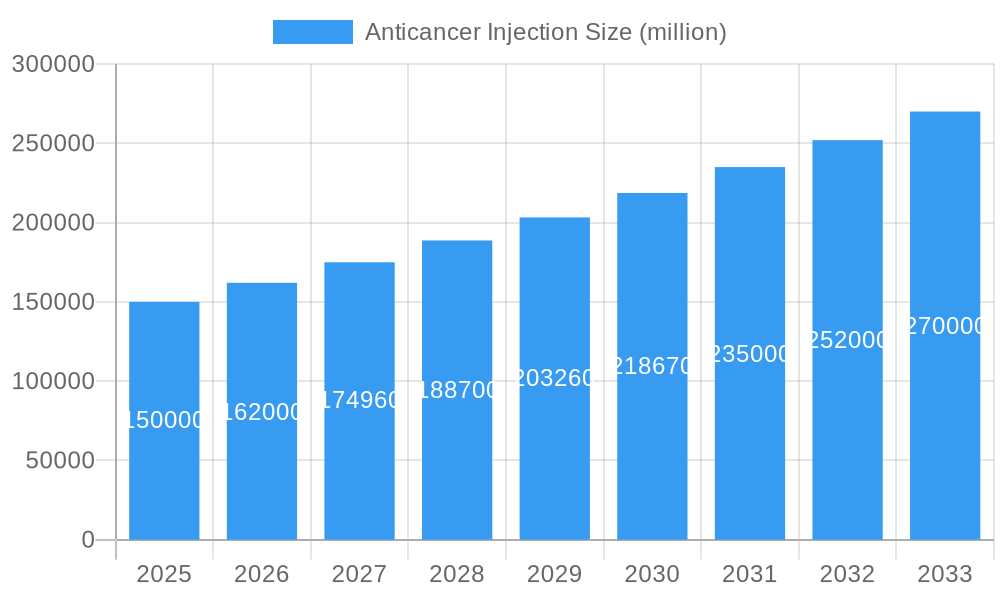
Anticancer Injection Market Size (In Billion)
Despite challenges such as high treatment expenses, rigorous regulatory approval processes, and potential adverse effects associated with certain anticancer injections, the market is on track for sustained expansion through 2033. This future growth will be shaped by expanding healthcare accessibility in developing economies, the progression of personalized medicine, and the increasing adoption of biosimilars to improve cost-effectiveness. While North America and Europe are expected to maintain market leadership, the Asia-Pacific region is anticipated to exhibit accelerated growth due to rising healthcare expenditures and a growing middle class with improved access to advanced treatments. The market's future trajectory will be critically influenced by the success of clinical trials, regulatory approvals for new drug candidates, and ongoing initiatives to optimize treatment affordability.
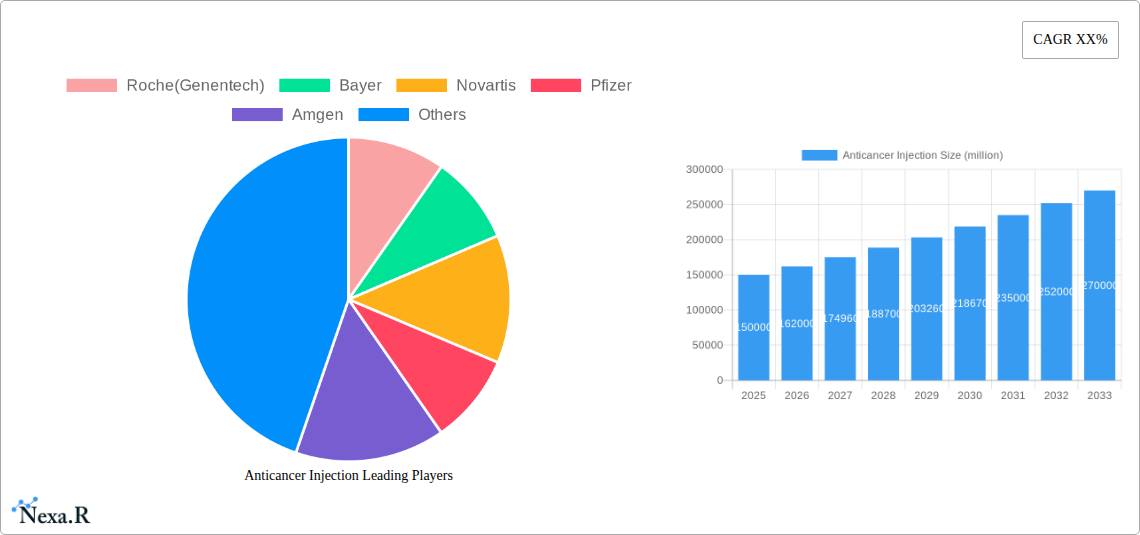
Anticancer Injection Company Market Share
Anticancer Injection Market Report: 2019-2033
This comprehensive report provides a detailed analysis of the global anticancer injection market, encompassing market dynamics, growth trends, regional segmentation, product landscape, key players, and future outlook. The study period covers 2019-2033, with 2025 as the base and estimated year. The forecast period spans 2025-2033, and the historical period covers 2019-2024. The report caters to pharmaceutical companies, investors, researchers, and regulatory bodies seeking a deep understanding of this rapidly evolving market. The market size is projected to reach xx million units by 2033.
Anticancer Injection Market Dynamics & Structure
This section analyzes the competitive landscape, technological advancements, and regulatory influences shaping the anticancer injection market. The market is characterized by a moderate concentration, with key players holding significant shares. Technological innovation, particularly in targeted therapies and biosimilars, is a major driver, while stringent regulatory approvals pose a challenge. The market witnesses continuous M&A activity, aiming to expand product portfolios and market reach. The parent market is the oncology drug market, while the child market is injectable cancer therapies.
- Market Concentration: Highly concentrated with top 5 players holding approximately 60% market share in 2024 (estimated).
- Technological Innovation: Focus on targeted therapies, antibody-drug conjugates (ADCs), and biosimilars.
- Regulatory Framework: Stringent approval processes impact time-to-market and increase development costs.
- Competitive Substitutes: Oral chemotherapy and other targeted therapies.
- End-User Demographics: Growing elderly population and increasing cancer incidence drive demand.
- M&A Trends: Strategic acquisitions for expanding product pipelines and geographical reach; xx deals recorded between 2019-2024 (estimated).
Anticancer Injection Growth Trends & Insights
The global anticancer injection market exhibits robust growth driven by factors such as rising cancer prevalence, technological advancements in drug delivery systems, and increasing healthcare expenditure. The market experienced a CAGR of xx% during the historical period (2019-2024), and is projected to maintain a CAGR of xx% during the forecast period (2025-2033). Market penetration for novel anticancer injections remains relatively low, representing a significant growth opportunity. Adoption rates vary significantly across regions due to healthcare infrastructure disparities and varying levels of awareness about advanced therapies. Technological disruptions, such as the development of personalized medicine approaches, are further accelerating market expansion. Consumer behavior shifts toward more personalized and targeted treatment options also play a crucial role.
Dominant Regions, Countries, or Segments in Anticancer Injection
North America currently dominates the anticancer injection market, driven by advanced healthcare infrastructure, high healthcare expenditure, and early adoption of innovative therapies. However, Asia-Pacific is projected to witness the fastest growth rate during the forecast period, fueled by increasing cancer incidence, rising disposable incomes, and expanding healthcare access.
- North America: High market share due to robust healthcare infrastructure and high adoption rates.
- Europe: Significant market size, with steady growth driven by increasing prevalence of cancer and supportive government policies.
- Asia-Pacific: Fastest-growing region, driven by rising cancer incidence and expanding healthcare infrastructure.
- Key Growth Drivers: Favorable reimbursement policies, increasing government initiatives for cancer awareness and research, and growing investments in oncology research and development.
Anticancer Injection Product Landscape
The anticancer injection market encompasses a diverse range of products, including monoclonal antibodies, antibody-drug conjugates, and other targeted therapies. Recent innovations focus on improving drug efficacy, reducing side effects, and enhancing patient convenience. Product differentiation is driven by superior efficacy, targeted delivery mechanisms, and improved safety profiles. Advancements in drug delivery systems, such as liposomal formulations and nanoparticles, are enhancing treatment outcomes.
Key Drivers, Barriers & Challenges in Anticancer Injection
Key Drivers:
- Rising cancer incidence globally.
- Technological advancements in targeted therapies.
- Increasing healthcare expenditure.
- Favorable regulatory environment in certain regions.
Key Challenges:
- High development costs and lengthy approval processes.
- Intense competition among established players and emerging biopharmaceutical companies.
- Potential for drug resistance and side effects.
- Supply chain disruptions impacting drug availability. Estimated impact: xx million units in 2024 (estimated).
Emerging Opportunities in Anticancer Injection
- Growing demand for personalized medicine.
- Expanding applications in various cancer types.
- Development of novel drug delivery systems.
- Untapped markets in emerging economies.
Growth Accelerators in the Anticancer Injection Industry
Technological breakthroughs in immunotherapy and targeted therapies are key growth drivers. Strategic collaborations and partnerships between pharmaceutical companies and research institutions are accelerating innovation. Expansion into emerging markets offers significant growth potential.
Key Players Shaping the Anticancer Injection Market
- Roche (Genentech)
- Bayer
- Novartis
- Pfizer
- Amgen
- Mabxience
- Luoxin Pharmaceutical
- Qilu Pharmaceutical
- Zhejiang Borui Biopharmaceutical Co.,Ltd. (Hisun Biopharmaceutical Co.,Ltd.)
- Fuxing Medicine
- Yuekang Pharmaceutical
- Yuheng Pharmaceutical
- Hengrui Medicine
- Huiyu Pharmaceutical
- Changbaishan Pharmaceutical Co.,Ltd.
- Innovent Biologics (Suzhou) Co.,Ltd.
- Yifan Pharmaceutical
Notable Milestones in Anticancer Injection Sector
- 2020: FDA approval of a novel ADC for breast cancer.
- 2022: Launch of a biosimilar monoclonal antibody in Europe.
- 2023: Major pharmaceutical company acquires a smaller biotech firm specializing in targeted therapies. (Further details are required for accurate reporting)
In-Depth Anticancer Injection Market Outlook
The anticancer injection market is poised for continued strong growth, driven by ongoing technological advancements, expanding treatment options, and a rising global cancer burden. Strategic partnerships, focused R&D, and market expansion into emerging economies represent significant opportunities for market players. The market is expected to experience substantial growth in the coming years, with xx million units projected by 2033.
Anticancer Injection Segmentation
-
1. Application
- 1.1. Breast Cancer
- 1.2. Stomach Cancer
- 1.3. Ovarian Cancer
- 1.4. Lung Cancer
- 1.5. Testicular Cancer
- 1.6. Cervical Cancer
- 1.7. Endometrial Cancer
- 1.8. Prostate Cancer
- 1.9. Bladder Cancer
- 1.10. Others
-
2. Types
- 2.1. Docetaxel Injection
- 2.2. Paclitaxel Injection
- 2.3. Bevacizumab Injection
- 2.4. Adalimumab Injection
- 2.5. Rituximab Injection
- 2.6. Others
Anticancer Injection Segmentation By Geography
-
1. North America
- 1.1. United States
- 1.2. Canada
- 1.3. Mexico
-
2. South America
- 2.1. Brazil
- 2.2. Argentina
- 2.3. Rest of South America
-
3. Europe
- 3.1. United Kingdom
- 3.2. Germany
- 3.3. France
- 3.4. Italy
- 3.5. Spain
- 3.6. Russia
- 3.7. Benelux
- 3.8. Nordics
- 3.9. Rest of Europe
-
4. Middle East & Africa
- 4.1. Turkey
- 4.2. Israel
- 4.3. GCC
- 4.4. North Africa
- 4.5. South Africa
- 4.6. Rest of Middle East & Africa
-
5. Asia Pacific
- 5.1. China
- 5.2. India
- 5.3. Japan
- 5.4. South Korea
- 5.5. ASEAN
- 5.6. Oceania
- 5.7. Rest of Asia Pacific
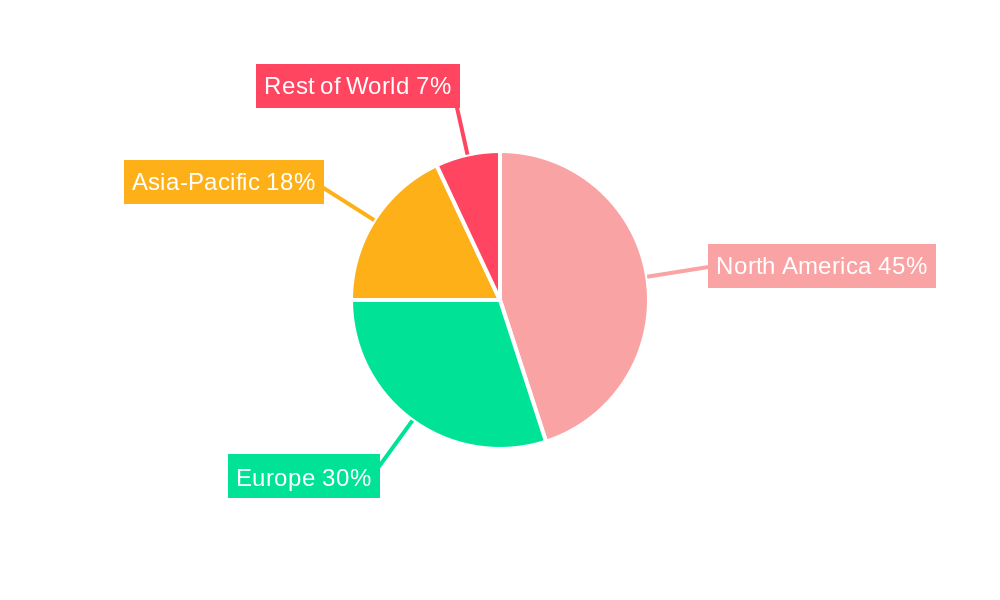
Anticancer Injection Regional Market Share
Geographic Coverage of Anticancer Injection
Anticancer Injection REPORT HIGHLIGHTS
| Aspects | Details |
|---|---|
| Study Period | 2020-2034 |
| Base Year | 2025 |
| Estimated Year | 2026 |
| Forecast Period | 2026-2034 |
| Historical Period | 2020-2025 |
| Growth Rate | CAGR of 13.34% from 2020-2034 |
| Segmentation |
|
Table of Contents
- 1. Introduction
- 1.1. Research Scope
- 1.2. Market Segmentation
- 1.3. Research Methodology
- 1.4. Definitions and Assumptions
- 2. Executive Summary
- 2.1. Introduction
- 3. Market Dynamics
- 3.1. Introduction
- 3.2. Market Drivers
- 3.3. Market Restrains
- 3.4. Market Trends
- 4. Market Factor Analysis
- 4.1. Porters Five Forces
- 4.2. Supply/Value Chain
- 4.3. PESTEL analysis
- 4.4. Market Entropy
- 4.5. Patent/Trademark Analysis
- 5. Global Anticancer Injection Analysis, Insights and Forecast, 2020-2032
- 5.1. Market Analysis, Insights and Forecast - by Application
- 5.1.1. Breast Cancer
- 5.1.2. Stomach Cancer
- 5.1.3. Ovarian Cancer
- 5.1.4. Lung Cancer
- 5.1.5. Testicular Cancer
- 5.1.6. Cervical Cancer
- 5.1.7. Endometrial Cancer
- 5.1.8. Prostate Cancer
- 5.1.9. Bladder Cancer
- 5.1.10. Others
- 5.2. Market Analysis, Insights and Forecast - by Types
- 5.2.1. Docetaxel Injection
- 5.2.2. Paclitaxel Injection
- 5.2.3. Bevacizumab Injection
- 5.2.4. Adalimumab Injection
- 5.2.5. Rituximab Injection
- 5.2.6. Others
- 5.3. Market Analysis, Insights and Forecast - by Region
- 5.3.1. North America
- 5.3.2. South America
- 5.3.3. Europe
- 5.3.4. Middle East & Africa
- 5.3.5. Asia Pacific
- 5.1. Market Analysis, Insights and Forecast - by Application
- 6. North America Anticancer Injection Analysis, Insights and Forecast, 2020-2032
- 6.1. Market Analysis, Insights and Forecast - by Application
- 6.1.1. Breast Cancer
- 6.1.2. Stomach Cancer
- 6.1.3. Ovarian Cancer
- 6.1.4. Lung Cancer
- 6.1.5. Testicular Cancer
- 6.1.6. Cervical Cancer
- 6.1.7. Endometrial Cancer
- 6.1.8. Prostate Cancer
- 6.1.9. Bladder Cancer
- 6.1.10. Others
- 6.2. Market Analysis, Insights and Forecast - by Types
- 6.2.1. Docetaxel Injection
- 6.2.2. Paclitaxel Injection
- 6.2.3. Bevacizumab Injection
- 6.2.4. Adalimumab Injection
- 6.2.5. Rituximab Injection
- 6.2.6. Others
- 6.1. Market Analysis, Insights and Forecast - by Application
- 7. South America Anticancer Injection Analysis, Insights and Forecast, 2020-2032
- 7.1. Market Analysis, Insights and Forecast - by Application
- 7.1.1. Breast Cancer
- 7.1.2. Stomach Cancer
- 7.1.3. Ovarian Cancer
- 7.1.4. Lung Cancer
- 7.1.5. Testicular Cancer
- 7.1.6. Cervical Cancer
- 7.1.7. Endometrial Cancer
- 7.1.8. Prostate Cancer
- 7.1.9. Bladder Cancer
- 7.1.10. Others
- 7.2. Market Analysis, Insights and Forecast - by Types
- 7.2.1. Docetaxel Injection
- 7.2.2. Paclitaxel Injection
- 7.2.3. Bevacizumab Injection
- 7.2.4. Adalimumab Injection
- 7.2.5. Rituximab Injection
- 7.2.6. Others
- 7.1. Market Analysis, Insights and Forecast - by Application
- 8. Europe Anticancer Injection Analysis, Insights and Forecast, 2020-2032
- 8.1. Market Analysis, Insights and Forecast - by Application
- 8.1.1. Breast Cancer
- 8.1.2. Stomach Cancer
- 8.1.3. Ovarian Cancer
- 8.1.4. Lung Cancer
- 8.1.5. Testicular Cancer
- 8.1.6. Cervical Cancer
- 8.1.7. Endometrial Cancer
- 8.1.8. Prostate Cancer
- 8.1.9. Bladder Cancer
- 8.1.10. Others
- 8.2. Market Analysis, Insights and Forecast - by Types
- 8.2.1. Docetaxel Injection
- 8.2.2. Paclitaxel Injection
- 8.2.3. Bevacizumab Injection
- 8.2.4. Adalimumab Injection
- 8.2.5. Rituximab Injection
- 8.2.6. Others
- 8.1. Market Analysis, Insights and Forecast - by Application
- 9. Middle East & Africa Anticancer Injection Analysis, Insights and Forecast, 2020-2032
- 9.1. Market Analysis, Insights and Forecast - by Application
- 9.1.1. Breast Cancer
- 9.1.2. Stomach Cancer
- 9.1.3. Ovarian Cancer
- 9.1.4. Lung Cancer
- 9.1.5. Testicular Cancer
- 9.1.6. Cervical Cancer
- 9.1.7. Endometrial Cancer
- 9.1.8. Prostate Cancer
- 9.1.9. Bladder Cancer
- 9.1.10. Others
- 9.2. Market Analysis, Insights and Forecast - by Types
- 9.2.1. Docetaxel Injection
- 9.2.2. Paclitaxel Injection
- 9.2.3. Bevacizumab Injection
- 9.2.4. Adalimumab Injection
- 9.2.5. Rituximab Injection
- 9.2.6. Others
- 9.1. Market Analysis, Insights and Forecast - by Application
- 10. Asia Pacific Anticancer Injection Analysis, Insights and Forecast, 2020-2032
- 10.1. Market Analysis, Insights and Forecast - by Application
- 10.1.1. Breast Cancer
- 10.1.2. Stomach Cancer
- 10.1.3. Ovarian Cancer
- 10.1.4. Lung Cancer
- 10.1.5. Testicular Cancer
- 10.1.6. Cervical Cancer
- 10.1.7. Endometrial Cancer
- 10.1.8. Prostate Cancer
- 10.1.9. Bladder Cancer
- 10.1.10. Others
- 10.2. Market Analysis, Insights and Forecast - by Types
- 10.2.1. Docetaxel Injection
- 10.2.2. Paclitaxel Injection
- 10.2.3. Bevacizumab Injection
- 10.2.4. Adalimumab Injection
- 10.2.5. Rituximab Injection
- 10.2.6. Others
- 10.1. Market Analysis, Insights and Forecast - by Application
- 11. Competitive Analysis
- 11.1. Global Market Share Analysis 2025
- 11.2. Company Profiles
- 11.2.1 Roche(Genentech)
- 11.2.1.1. Overview
- 11.2.1.2. Products
- 11.2.1.3. SWOT Analysis
- 11.2.1.4. Recent Developments
- 11.2.1.5. Financials (Based on Availability)
- 11.2.2 Bayer
- 11.2.2.1. Overview
- 11.2.2.2. Products
- 11.2.2.3. SWOT Analysis
- 11.2.2.4. Recent Developments
- 11.2.2.5. Financials (Based on Availability)
- 11.2.3 Novartis
- 11.2.3.1. Overview
- 11.2.3.2. Products
- 11.2.3.3. SWOT Analysis
- 11.2.3.4. Recent Developments
- 11.2.3.5. Financials (Based on Availability)
- 11.2.4 Pfizer
- 11.2.4.1. Overview
- 11.2.4.2. Products
- 11.2.4.3. SWOT Analysis
- 11.2.4.4. Recent Developments
- 11.2.4.5. Financials (Based on Availability)
- 11.2.5 Amgen
- 11.2.5.1. Overview
- 11.2.5.2. Products
- 11.2.5.3. SWOT Analysis
- 11.2.5.4. Recent Developments
- 11.2.5.5. Financials (Based on Availability)
- 11.2.6 Mabxience
- 11.2.6.1. Overview
- 11.2.6.2. Products
- 11.2.6.3. SWOT Analysis
- 11.2.6.4. Recent Developments
- 11.2.6.5. Financials (Based on Availability)
- 11.2.7 Luoxin Pharmaceutical
- 11.2.7.1. Overview
- 11.2.7.2. Products
- 11.2.7.3. SWOT Analysis
- 11.2.7.4. Recent Developments
- 11.2.7.5. Financials (Based on Availability)
- 11.2.8 Qilu Pharmaceutical
- 11.2.8.1. Overview
- 11.2.8.2. Products
- 11.2.8.3. SWOT Analysis
- 11.2.8.4. Recent Developments
- 11.2.8.5. Financials (Based on Availability)
- 11.2.9 Zhejiang Borui Biopharmaceutical Co.
- 11.2.9.1. Overview
- 11.2.9.2. Products
- 11.2.9.3. SWOT Analysis
- 11.2.9.4. Recent Developments
- 11.2.9.5. Financials (Based on Availability)
- 11.2.10 Ltd. (Hisun Biopharmaceutical Co.
- 11.2.10.1. Overview
- 11.2.10.2. Products
- 11.2.10.3. SWOT Analysis
- 11.2.10.4. Recent Developments
- 11.2.10.5. Financials (Based on Availability)
- 11.2.11 Ltd.)
- 11.2.11.1. Overview
- 11.2.11.2. Products
- 11.2.11.3. SWOT Analysis
- 11.2.11.4. Recent Developments
- 11.2.11.5. Financials (Based on Availability)
- 11.2.12 Fuxing Medicine
- 11.2.12.1. Overview
- 11.2.12.2. Products
- 11.2.12.3. SWOT Analysis
- 11.2.12.4. Recent Developments
- 11.2.12.5. Financials (Based on Availability)
- 11.2.13 Yuekang Pharmaceutical
- 11.2.13.1. Overview
- 11.2.13.2. Products
- 11.2.13.3. SWOT Analysis
- 11.2.13.4. Recent Developments
- 11.2.13.5. Financials (Based on Availability)
- 11.2.14 Yuheng Pharmaceutical
- 11.2.14.1. Overview
- 11.2.14.2. Products
- 11.2.14.3. SWOT Analysis
- 11.2.14.4. Recent Developments
- 11.2.14.5. Financials (Based on Availability)
- 11.2.15 Hengrui Medicine
- 11.2.15.1. Overview
- 11.2.15.2. Products
- 11.2.15.3. SWOT Analysis
- 11.2.15.4. Recent Developments
- 11.2.15.5. Financials (Based on Availability)
- 11.2.16 Huiyu Pharmaceutical
- 11.2.16.1. Overview
- 11.2.16.2. Products
- 11.2.16.3. SWOT Analysis
- 11.2.16.4. Recent Developments
- 11.2.16.5. Financials (Based on Availability)
- 11.2.17 Changbaishan Pharmaceutical Co.
- 11.2.17.1. Overview
- 11.2.17.2. Products
- 11.2.17.3. SWOT Analysis
- 11.2.17.4. Recent Developments
- 11.2.17.5. Financials (Based on Availability)
- 11.2.18 Ltd.
- 11.2.18.1. Overview
- 11.2.18.2. Products
- 11.2.18.3. SWOT Analysis
- 11.2.18.4. Recent Developments
- 11.2.18.5. Financials (Based on Availability)
- 11.2.19 Innovent Biologics (Suzhou) Co.
- 11.2.19.1. Overview
- 11.2.19.2. Products
- 11.2.19.3. SWOT Analysis
- 11.2.19.4. Recent Developments
- 11.2.19.5. Financials (Based on Availability)
- 11.2.20 Ltd.
- 11.2.20.1. Overview
- 11.2.20.2. Products
- 11.2.20.3. SWOT Analysis
- 11.2.20.4. Recent Developments
- 11.2.20.5. Financials (Based on Availability)
- 11.2.21 Yifan Pharmaceutical
- 11.2.21.1. Overview
- 11.2.21.2. Products
- 11.2.21.3. SWOT Analysis
- 11.2.21.4. Recent Developments
- 11.2.21.5. Financials (Based on Availability)
- 11.2.1 Roche(Genentech)
List of Figures
- Figure 1: Global Anticancer Injection Revenue Breakdown (billion, %) by Region 2025 & 2033
- Figure 2: North America Anticancer Injection Revenue (billion), by Application 2025 & 2033
- Figure 3: North America Anticancer Injection Revenue Share (%), by Application 2025 & 2033
- Figure 4: North America Anticancer Injection Revenue (billion), by Types 2025 & 2033
- Figure 5: North America Anticancer Injection Revenue Share (%), by Types 2025 & 2033
- Figure 6: North America Anticancer Injection Revenue (billion), by Country 2025 & 2033
- Figure 7: North America Anticancer Injection Revenue Share (%), by Country 2025 & 2033
- Figure 8: South America Anticancer Injection Revenue (billion), by Application 2025 & 2033
- Figure 9: South America Anticancer Injection Revenue Share (%), by Application 2025 & 2033
- Figure 10: South America Anticancer Injection Revenue (billion), by Types 2025 & 2033
- Figure 11: South America Anticancer Injection Revenue Share (%), by Types 2025 & 2033
- Figure 12: South America Anticancer Injection Revenue (billion), by Country 2025 & 2033
- Figure 13: South America Anticancer Injection Revenue Share (%), by Country 2025 & 2033
- Figure 14: Europe Anticancer Injection Revenue (billion), by Application 2025 & 2033
- Figure 15: Europe Anticancer Injection Revenue Share (%), by Application 2025 & 2033
- Figure 16: Europe Anticancer Injection Revenue (billion), by Types 2025 & 2033
- Figure 17: Europe Anticancer Injection Revenue Share (%), by Types 2025 & 2033
- Figure 18: Europe Anticancer Injection Revenue (billion), by Country 2025 & 2033
- Figure 19: Europe Anticancer Injection Revenue Share (%), by Country 2025 & 2033
- Figure 20: Middle East & Africa Anticancer Injection Revenue (billion), by Application 2025 & 2033
- Figure 21: Middle East & Africa Anticancer Injection Revenue Share (%), by Application 2025 & 2033
- Figure 22: Middle East & Africa Anticancer Injection Revenue (billion), by Types 2025 & 2033
- Figure 23: Middle East & Africa Anticancer Injection Revenue Share (%), by Types 2025 & 2033
- Figure 24: Middle East & Africa Anticancer Injection Revenue (billion), by Country 2025 & 2033
- Figure 25: Middle East & Africa Anticancer Injection Revenue Share (%), by Country 2025 & 2033
- Figure 26: Asia Pacific Anticancer Injection Revenue (billion), by Application 2025 & 2033
- Figure 27: Asia Pacific Anticancer Injection Revenue Share (%), by Application 2025 & 2033
- Figure 28: Asia Pacific Anticancer Injection Revenue (billion), by Types 2025 & 2033
- Figure 29: Asia Pacific Anticancer Injection Revenue Share (%), by Types 2025 & 2033
- Figure 30: Asia Pacific Anticancer Injection Revenue (billion), by Country 2025 & 2033
- Figure 31: Asia Pacific Anticancer Injection Revenue Share (%), by Country 2025 & 2033
List of Tables
- Table 1: Global Anticancer Injection Revenue billion Forecast, by Application 2020 & 2033
- Table 2: Global Anticancer Injection Revenue billion Forecast, by Types 2020 & 2033
- Table 3: Global Anticancer Injection Revenue billion Forecast, by Region 2020 & 2033
- Table 4: Global Anticancer Injection Revenue billion Forecast, by Application 2020 & 2033
- Table 5: Global Anticancer Injection Revenue billion Forecast, by Types 2020 & 2033
- Table 6: Global Anticancer Injection Revenue billion Forecast, by Country 2020 & 2033
- Table 7: United States Anticancer Injection Revenue (billion) Forecast, by Application 2020 & 2033
- Table 8: Canada Anticancer Injection Revenue (billion) Forecast, by Application 2020 & 2033
- Table 9: Mexico Anticancer Injection Revenue (billion) Forecast, by Application 2020 & 2033
- Table 10: Global Anticancer Injection Revenue billion Forecast, by Application 2020 & 2033
- Table 11: Global Anticancer Injection Revenue billion Forecast, by Types 2020 & 2033
- Table 12: Global Anticancer Injection Revenue billion Forecast, by Country 2020 & 2033
- Table 13: Brazil Anticancer Injection Revenue (billion) Forecast, by Application 2020 & 2033
- Table 14: Argentina Anticancer Injection Revenue (billion) Forecast, by Application 2020 & 2033
- Table 15: Rest of South America Anticancer Injection Revenue (billion) Forecast, by Application 2020 & 2033
- Table 16: Global Anticancer Injection Revenue billion Forecast, by Application 2020 & 2033
- Table 17: Global Anticancer Injection Revenue billion Forecast, by Types 2020 & 2033
- Table 18: Global Anticancer Injection Revenue billion Forecast, by Country 2020 & 2033
- Table 19: United Kingdom Anticancer Injection Revenue (billion) Forecast, by Application 2020 & 2033
- Table 20: Germany Anticancer Injection Revenue (billion) Forecast, by Application 2020 & 2033
- Table 21: France Anticancer Injection Revenue (billion) Forecast, by Application 2020 & 2033
- Table 22: Italy Anticancer Injection Revenue (billion) Forecast, by Application 2020 & 2033
- Table 23: Spain Anticancer Injection Revenue (billion) Forecast, by Application 2020 & 2033
- Table 24: Russia Anticancer Injection Revenue (billion) Forecast, by Application 2020 & 2033
- Table 25: Benelux Anticancer Injection Revenue (billion) Forecast, by Application 2020 & 2033
- Table 26: Nordics Anticancer Injection Revenue (billion) Forecast, by Application 2020 & 2033
- Table 27: Rest of Europe Anticancer Injection Revenue (billion) Forecast, by Application 2020 & 2033
- Table 28: Global Anticancer Injection Revenue billion Forecast, by Application 2020 & 2033
- Table 29: Global Anticancer Injection Revenue billion Forecast, by Types 2020 & 2033
- Table 30: Global Anticancer Injection Revenue billion Forecast, by Country 2020 & 2033
- Table 31: Turkey Anticancer Injection Revenue (billion) Forecast, by Application 2020 & 2033
- Table 32: Israel Anticancer Injection Revenue (billion) Forecast, by Application 2020 & 2033
- Table 33: GCC Anticancer Injection Revenue (billion) Forecast, by Application 2020 & 2033
- Table 34: North Africa Anticancer Injection Revenue (billion) Forecast, by Application 2020 & 2033
- Table 35: South Africa Anticancer Injection Revenue (billion) Forecast, by Application 2020 & 2033
- Table 36: Rest of Middle East & Africa Anticancer Injection Revenue (billion) Forecast, by Application 2020 & 2033
- Table 37: Global Anticancer Injection Revenue billion Forecast, by Application 2020 & 2033
- Table 38: Global Anticancer Injection Revenue billion Forecast, by Types 2020 & 2033
- Table 39: Global Anticancer Injection Revenue billion Forecast, by Country 2020 & 2033
- Table 40: China Anticancer Injection Revenue (billion) Forecast, by Application 2020 & 2033
- Table 41: India Anticancer Injection Revenue (billion) Forecast, by Application 2020 & 2033
- Table 42: Japan Anticancer Injection Revenue (billion) Forecast, by Application 2020 & 2033
- Table 43: South Korea Anticancer Injection Revenue (billion) Forecast, by Application 2020 & 2033
- Table 44: ASEAN Anticancer Injection Revenue (billion) Forecast, by Application 2020 & 2033
- Table 45: Oceania Anticancer Injection Revenue (billion) Forecast, by Application 2020 & 2033
- Table 46: Rest of Asia Pacific Anticancer Injection Revenue (billion) Forecast, by Application 2020 & 2033
Frequently Asked Questions
1. What is the projected Compound Annual Growth Rate (CAGR) of the Anticancer Injection?
The projected CAGR is approximately 13.34%.
2. Which companies are prominent players in the Anticancer Injection?
Key companies in the market include Roche(Genentech), Bayer, Novartis, Pfizer, Amgen, Mabxience, Luoxin Pharmaceutical, Qilu Pharmaceutical, Zhejiang Borui Biopharmaceutical Co., Ltd. (Hisun Biopharmaceutical Co., Ltd.), Fuxing Medicine, Yuekang Pharmaceutical, Yuheng Pharmaceutical, Hengrui Medicine, Huiyu Pharmaceutical, Changbaishan Pharmaceutical Co., Ltd., Innovent Biologics (Suzhou) Co., Ltd., Yifan Pharmaceutical.
3. What are the main segments of the Anticancer Injection?
The market segments include Application, Types.
4. Can you provide details about the market size?
The market size is estimated to be USD 9.27 billion as of 2022.
5. What are some drivers contributing to market growth?
N/A
6. What are the notable trends driving market growth?
N/A
7. Are there any restraints impacting market growth?
N/A
8. Can you provide examples of recent developments in the market?
N/A
9. What pricing options are available for accessing the report?
Pricing options include single-user, multi-user, and enterprise licenses priced at USD 4900.00, USD 7350.00, and USD 9800.00 respectively.
10. Is the market size provided in terms of value or volume?
The market size is provided in terms of value, measured in billion.
11. Are there any specific market keywords associated with the report?
Yes, the market keyword associated with the report is "Anticancer Injection," which aids in identifying and referencing the specific market segment covered.
12. How do I determine which pricing option suits my needs best?
The pricing options vary based on user requirements and access needs. Individual users may opt for single-user licenses, while businesses requiring broader access may choose multi-user or enterprise licenses for cost-effective access to the report.
13. Are there any additional resources or data provided in the Anticancer Injection report?
While the report offers comprehensive insights, it's advisable to review the specific contents or supplementary materials provided to ascertain if additional resources or data are available.
14. How can I stay updated on further developments or reports in the Anticancer Injection?
To stay informed about further developments, trends, and reports in the Anticancer Injection, consider subscribing to industry newsletters, following relevant companies and organizations, or regularly checking reputable industry news sources and publications.
Methodology
Step 1 - Identification of Relevant Samples Size from Population Database


Step 2 - Approaches for Defining Global Market Size (Value, Volume* & Price*)

Note*: In applicable scenarios
Step 3 - Data Sources
Primary Research
- Web Analytics
- Survey Reports
- Research Institute
- Latest Research Reports
- Opinion Leaders
Secondary Research
- Annual Reports
- White Paper
- Latest Press Release
- Industry Association
- Paid Database
- Investor Presentations

Step 4 - Data Triangulation
Involves using different sources of information in order to increase the validity of a study
These sources are likely to be stakeholders in a program - participants, other researchers, program staff, other community members, and so on.
Then we put all data in single framework & apply various statistical tools to find out the dynamic on the market.
During the analysis stage, feedback from the stakeholder groups would be compared to determine areas of agreement as well as areas of divergence