

Key Insights
The global Blood Preservatives market is projected for substantial growth, expected to reach $1.26 billion by 2024, driven by a CAGR of 8.91%. This expansion is fueled by increasing demand for blood transfusions, an aging demographic, rising chronic disease prevalence (cancer, anemia), and a surge in surgical procedures. Advances in blood collection and storage, coupled with heightened awareness of blood safety, are further propelling market growth. Hospitals are anticipated to lead the market due to their integral role in blood management, with blood banks also representing a significant segment.
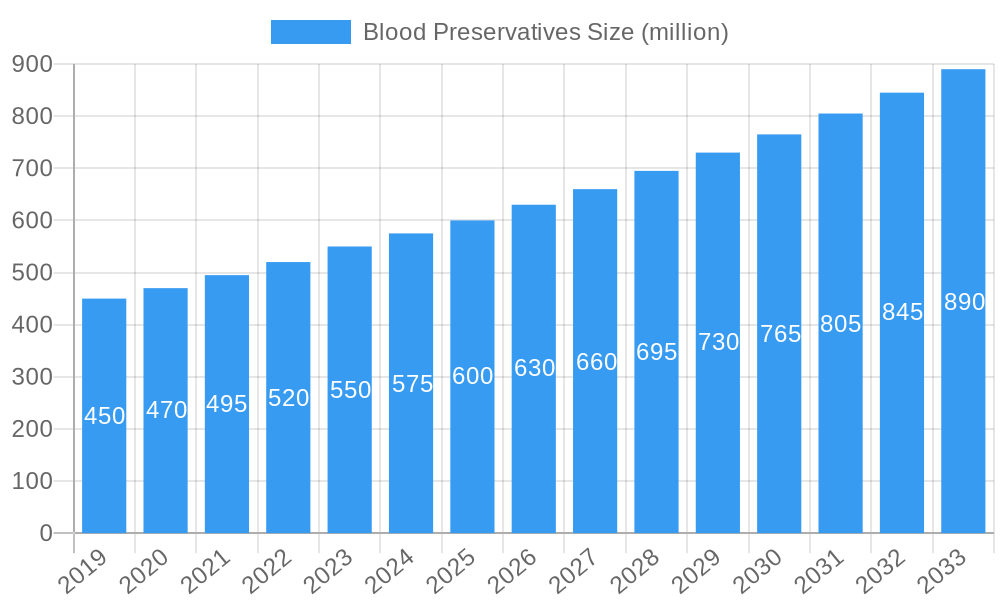
Blood Preservatives Market Size (In Billion)
Key trends include the development of advanced, extended-shelf-life preservative solutions, enhancing blood availability and reducing waste. Innovations in anticoagulant and additive solutions, particularly for red blood cell preservation, are gaining momentum. However, stringent regulatory requirements and high R&D and manufacturing costs for specialized solutions may pose challenges. Geographically, Asia Pacific is poised for the fastest growth, supported by improving healthcare infrastructure and rising disposable incomes. North America and Europe will maintain substantial market shares due to established healthcare systems and high transfusion dependency.
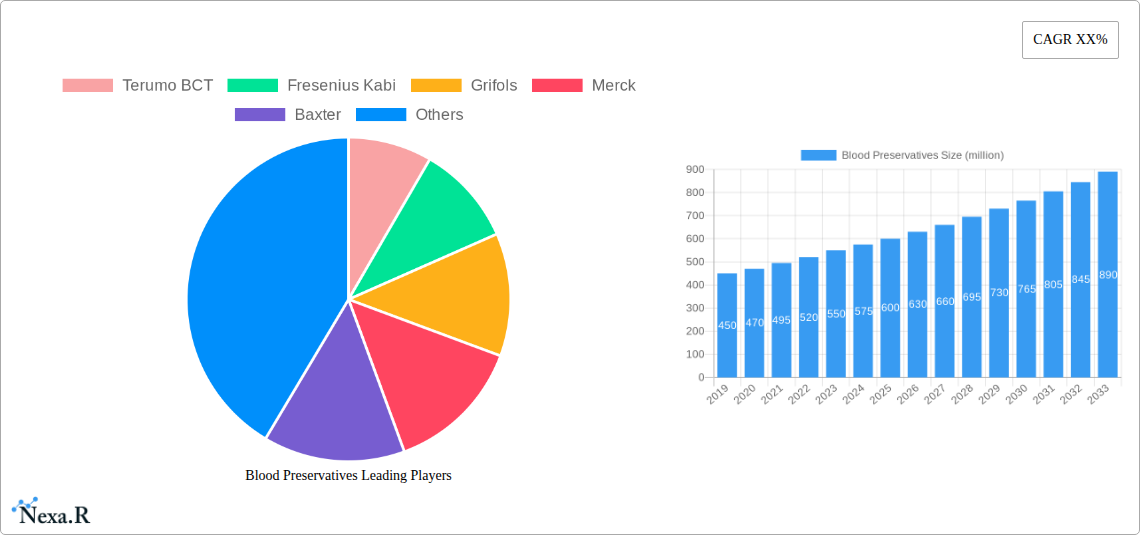
Blood Preservatives Company Market Share
This comprehensive report offers an SEO-optimized analysis of the Blood Preservatives market, detailing market size, growth, and forecasts for industry professionals.
Blood Preservatives Market Dynamics & Structure
The global blood preservatives market is characterized by a moderately concentrated landscape, with key players like Terumo BCT, Fresenius Kabi, Grifols, Merck, Baxter, and Weigao Group actively shaping its trajectory. Technological innovation, particularly in extending the shelf-life and improving the efficacy of blood products, remains a primary driver. Stringent regulatory frameworks governing blood collection, processing, and storage, overseen by bodies such as the FDA and EMA, are crucial in maintaining product quality and safety. Competitive product substitutes are limited due to the specialized nature of blood preservation, but advancements in alternative blood storage methods or synthetic blood alternatives could pose future challenges. End-user demographics are primarily driven by the increasing demand for blood transfusions in hospitals and the operational needs of blood banks. Mergers and acquisitions (M&A) activity, while not hyperactive, plays a role in market consolidation and strategic expansion.
- Market Concentration: Moderately concentrated, with a few dominant players holding significant market share.
- Technological Innovation: Focus on extending blood product viability, enhancing storage safety, and developing novel anticoagulant solutions.
- Regulatory Frameworks: Strict adherence to global and regional regulations for blood safety and efficacy.
- Competitive Landscape: Limited direct substitutes, but indirect threats from alternative medical interventions are monitored.
- End-User Demographics: Driven by healthcare demand for blood transfusions and blood product availability.
- M&A Trends: Strategic acquisitions and partnerships to enhance product portfolios and market reach.
Blood Preservatives Growth Trends & Insights
The blood preservatives market is poised for robust expansion, driven by a confluence of escalating global healthcare demands and continuous advancements in transfusion medicine. The market size is projected to witness substantial growth, evolving from an estimated $750 million in 2024 to a projected $1.1 billion by 2033, indicating a Compound Annual Growth Rate (CAGR) of approximately 4.5% during the forecast period of 2025–2033. This growth is underpinned by increasing blood donation rates globally, coupled with a rising incidence of chronic diseases and trauma cases that necessitate regular blood transfusions. Technological disruptions are playing a pivotal role, with ongoing research into more effective and longer-lasting preservative solutions that minimize adverse reactions and maximize the viability of red blood cells, platelets, and plasma. Adoption rates of advanced preservative formulations, such as those offering extended storage capabilities, are on an upward trend as healthcare institutions prioritize efficiency and resource optimization.
Consumer behavior shifts are also influencing market dynamics. There is a growing emphasis on blood safety and traceability, prompting manufacturers to invest in preservatives that offer enhanced quality assurance and compatibility. The increasing prevalence of decentralized healthcare models and mobile blood donation drives further necessitates robust and reliable preservation systems. Furthermore, the growing acceptance of apheresis techniques for blood component collection contributes to the demand for specialized preservatives. The market penetration of innovative blood preservatives is expected to deepen as healthcare providers recognize their value in reducing wastage and improving patient outcomes. The historical data from 2019–2024 shows a steady increase in market value, driven by similar underlying factors, and this momentum is anticipated to accelerate in the coming years. The strategic implementation of novel anticoagulant and additive solutions is becoming a key differentiator for market leaders.
Dominant Regions, Countries, or Segments in Blood Preservatives
North America currently stands as the dominant region in the global blood preservatives market, driven by its well-established healthcare infrastructure, high healthcare expenditure, and a strong emphasis on blood safety and advanced transfusion practices. The United States, in particular, represents a significant market share due to its extensive network of blood banks, advanced hospital systems, and robust regulatory oversight that mandates the use of high-quality blood preservation solutions. The Blood Bank application segment consistently leads the market, reflecting the critical need for effective preservatives to maintain the integrity of donated blood for transfusions and further processing.
The CPDA (Citrate, Phosphate, Dextrose, Adenine) type of preservative remains a cornerstone in this region due to its proven efficacy and widespread adoption for red blood cell preservation, offering extended storage life. However, there is a discernible shift towards more advanced additive solutions that further enhance post-transfusion recovery and reduce storage-related complications. Economic policies that support healthcare research and development, alongside infrastructure investments in blood collection and processing facilities, further bolster North America's market leadership.
Emerging economies in Asia-Pacific are exhibiting the highest growth potential, fueled by improving healthcare access, increasing awareness about blood donation, and a growing number of specialized medical procedures. Countries like China and India are witnessing substantial investments in their healthcare sectors, leading to an increased demand for sophisticated blood management technologies, including advanced blood preservatives. The Hospital application segment is expanding rapidly in these regions as healthcare facilities upgrade their capabilities to handle a wider range of transfusion needs. While traditional preservatives like ACD (Acid Citrate Dextrose) and CPD (Citrate Phosphate Dextrose) are still widely used, there is a growing interest in and adoption of CPDA and other proprietary formulations to meet evolving clinical requirements. Government initiatives promoting blood donation campaigns and the establishment of national blood transfusion services are also key drivers in these burgeoning markets.
- Dominant Region: North America, with the United States as a key contributor.
- Key Drivers: Advanced healthcare infrastructure, high expenditure, stringent blood safety regulations, extensive blood bank networks.
- Dominant Application Segment: Blood Bank, due to primary donation and processing needs.
- Dominant Preservative Type: CPDA, favored for its extended storage capabilities.
- Fastest Growing Region: Asia-Pacific, with China and India leading the expansion.
- Key Drivers: Improving healthcare access, rising awareness, investments in medical infrastructure, government initiatives.
- Growing Application Segment: Hospital, as medical facilities enhance their transfusion capabilities.
- Emerging Preservative Trends: Increasing adoption of CPDA and proprietary additive solutions.
Blood Preservatives Product Landscape
The blood preservatives product landscape is defined by innovation focused on maximizing the viability and therapeutic efficacy of blood components. Manufacturers are continuously developing advanced anticoagulant solutions and nutrient additives designed to extend the shelf-life of red blood cells, platelets, and plasma. These products not only prevent clotting but also provide essential nutrients to maintain cellular integrity and function during storage. Key innovations include preservatives with enhanced buffering capacities to stabilize pH, improved adenine concentrations for extended red blood cell survival, and specialized solutions for platelet storage that minimize aggregation and activation. Performance metrics are rigorously evaluated through in-vitro testing and clinical trials, demonstrating reductions in post-transfusion hemolysis and improved platelet recovery rates. Unique selling propositions often lie in proprietary formulations that offer superior long-term storage or specific benefits for rare blood types or complex transfusion protocols.
Key Drivers, Barriers & Challenges in Blood Preservatives
Key Drivers: The blood preservatives market is propelled by several critical factors. A primary driver is the escalating global demand for blood transfusions, fueled by an aging population, increased incidence of chronic diseases, and a rise in trauma cases. Technological advancements in anticoagulant and additive solutions that enhance blood product shelf-life and efficacy are crucial. Furthermore, stringent regulatory mandates for blood safety and quality assurance necessitate the use of certified and effective preservatives. Government initiatives promoting blood donation and establishing robust blood transfusion infrastructures also contribute significantly to market growth.
Barriers & Challenges: Despite its growth, the market faces notable barriers and challenges. The highly regulated nature of the blood products industry imposes strict compliance requirements and lengthy approval processes for new preservative formulations, acting as a significant barrier to entry. Supply chain disruptions, particularly for raw materials, can impact production and availability. Competitive pressures from established players and the constant need for substantial investment in research and development to keep pace with evolving medical needs present ongoing challenges. Moreover, the cost-effectiveness of advanced preservative solutions compared to existing ones can influence adoption rates, especially in resource-limited settings.
Emerging Opportunities in Blood Preservatives
Emerging opportunities in the blood preservatives sector are largely centered around the development of novel, next-generation solutions and the expansion into underserved markets. There is a significant opportunity to develop preservatives that further extend the storage life of red blood cells and platelets beyond current limits, thereby reducing wastage and improving global blood availability. Innovations in additive solutions that minimize transfusion reactions and enhance the functional recovery of blood components are also highly sought after. Untapped markets in developing economies, with their growing healthcare infrastructure and increasing demand for blood products, present substantial growth potential. Furthermore, the development of customized preservative solutions for specific blood components or patient populations, such as pediatric or geriatric patients, represents an evolving consumer preference that manufacturers can capitalize on.
Growth Accelerators in the Blood Preservatives Industry
Long-term growth in the blood preservatives industry is being significantly accelerated by continuous technological breakthroughs and strategic market expansion initiatives. The development of advanced additive solutions that not only preserve but also enhance the quality and longevity of blood products is a key accelerator. These innovations contribute to reducing blood wastage and improving patient outcomes, thereby increasing their adoption. Strategic partnerships between preservative manufacturers and blood collection agencies, hospitals, and research institutions are fostering innovation and facilitating market penetration. Furthermore, market expansion strategies, including the penetration of emerging economies with increasing healthcare needs and investments, are vital growth accelerators. The growing emphasis on patient safety and the demand for higher quality blood products are driving the market towards more sophisticated and effective preservative systems.
Key Players Shaping the Blood Preservatives Market
- Terumo BCT
- Fresenius Kabi
- Grifols
- Merck
- Baxter
- Weigao Group
Notable Milestones in Blood Preservatives Sector
- 2019: Introduction of advanced additive solutions offering enhanced platelet recovery and extended shelf-life for platelets.
- 2020: Increased focus on supply chain resilience and local manufacturing of essential blood preservatives due to global health crises.
- 2021: Regulatory approvals for novel formulations aimed at further extending red blood cell viability, impacting blood bank inventory management.
- 2022: Significant investments in R&D for preservatives that minimize the risk of transfusion-transmitted infections.
- 2023: Mergers and acquisitions activity focused on consolidating market share and expanding product portfolios in specialized blood preservation.
- 2024: Growing interest in developing preservatives compatible with emerging blood processing technologies like continuous processing.
In-Depth Blood Preservatives Market Outlook
The future outlook for the blood preservatives market is exceptionally promising, driven by sustained demand and a clear trajectory of innovation. Growth accelerators, including the continuous quest for extended blood product shelf-life and improved post-transfusion efficacy, will continue to propel market expansion. Strategic opportunities lie in the development of preservative solutions that cater to the specific needs of niche applications and patient populations, alongside the penetration of rapidly developing healthcare markets in Asia-Pacific and Latin America. The integration of advanced technologies into preservative formulations, coupled with strong collaborative efforts across the healthcare ecosystem, will solidify the market's growth trajectory, ensuring a consistent supply of safe and effective blood products for global healthcare needs.
Blood Preservatives Segmentation
-
1. Application
- 1.1. Blood Bank
- 1.2. Hospital
- 1.3. Others
-
2. Types
- 2.1. ACD
- 2.2. CPD
- 2.3. CPDA
- 2.4. Others
Blood Preservatives Segmentation By Geography
-
1. North America
- 1.1. United States
- 1.2. Canada
- 1.3. Mexico
-
2. South America
- 2.1. Brazil
- 2.2. Argentina
- 2.3. Rest of South America
-
3. Europe
- 3.1. United Kingdom
- 3.2. Germany
- 3.3. France
- 3.4. Italy
- 3.5. Spain
- 3.6. Russia
- 3.7. Benelux
- 3.8. Nordics
- 3.9. Rest of Europe
-
4. Middle East & Africa
- 4.1. Turkey
- 4.2. Israel
- 4.3. GCC
- 4.4. North Africa
- 4.5. South Africa
- 4.6. Rest of Middle East & Africa
-
5. Asia Pacific
- 5.1. China
- 5.2. India
- 5.3. Japan
- 5.4. South Korea
- 5.5. ASEAN
- 5.6. Oceania
- 5.7. Rest of Asia Pacific
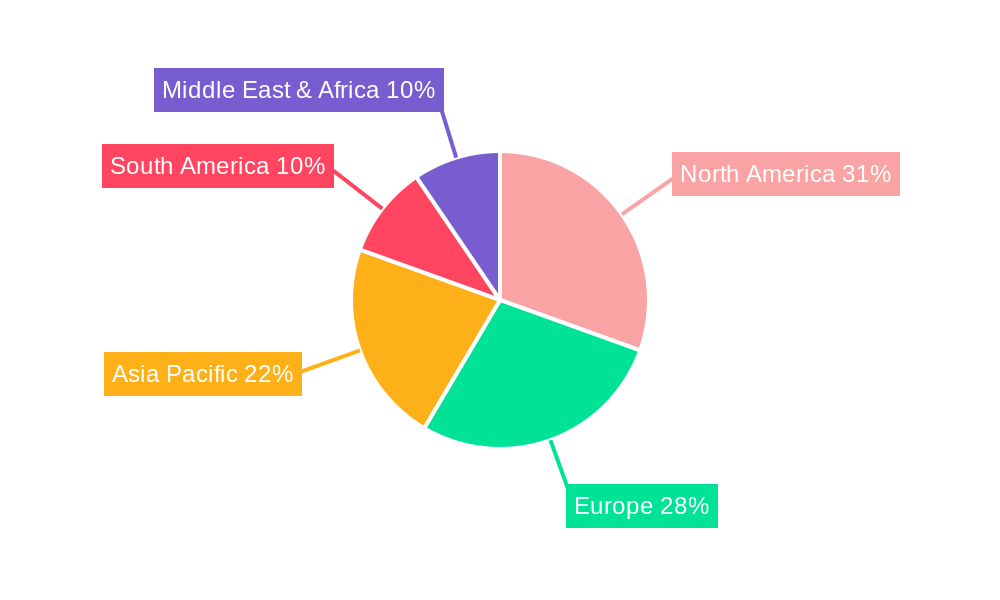
Blood Preservatives Regional Market Share
Geographic Coverage of Blood Preservatives
Blood Preservatives REPORT HIGHLIGHTS
| Aspects | Details |
|---|---|
| Study Period | 2020-2034 |
| Base Year | 2025 |
| Estimated Year | 2026 |
| Forecast Period | 2026-2034 |
| Historical Period | 2020-2025 |
| Growth Rate | CAGR of 8.91% from 2020-2034 |
| Segmentation |
|
Table of Contents
- 1. Introduction
- 1.1. Research Scope
- 1.2. Market Segmentation
- 1.3. Research Methodology
- 1.4. Definitions and Assumptions
- 2. Executive Summary
- 2.1. Introduction
- 3. Market Dynamics
- 3.1. Introduction
- 3.2. Market Drivers
- 3.3. Market Restrains
- 3.4. Market Trends
- 4. Market Factor Analysis
- 4.1. Porters Five Forces
- 4.2. Supply/Value Chain
- 4.3. PESTEL analysis
- 4.4. Market Entropy
- 4.5. Patent/Trademark Analysis
- 5. Global Blood Preservatives Analysis, Insights and Forecast, 2020-2032
- 5.1. Market Analysis, Insights and Forecast - by Application
- 5.1.1. Blood Bank
- 5.1.2. Hospital
- 5.1.3. Others
- 5.2. Market Analysis, Insights and Forecast - by Types
- 5.2.1. ACD
- 5.2.2. CPD
- 5.2.3. CPDA
- 5.2.4. Others
- 5.3. Market Analysis, Insights and Forecast - by Region
- 5.3.1. North America
- 5.3.2. South America
- 5.3.3. Europe
- 5.3.4. Middle East & Africa
- 5.3.5. Asia Pacific
- 5.1. Market Analysis, Insights and Forecast - by Application
- 6. North America Blood Preservatives Analysis, Insights and Forecast, 2020-2032
- 6.1. Market Analysis, Insights and Forecast - by Application
- 6.1.1. Blood Bank
- 6.1.2. Hospital
- 6.1.3. Others
- 6.2. Market Analysis, Insights and Forecast - by Types
- 6.2.1. ACD
- 6.2.2. CPD
- 6.2.3. CPDA
- 6.2.4. Others
- 6.1. Market Analysis, Insights and Forecast - by Application
- 7. South America Blood Preservatives Analysis, Insights and Forecast, 2020-2032
- 7.1. Market Analysis, Insights and Forecast - by Application
- 7.1.1. Blood Bank
- 7.1.2. Hospital
- 7.1.3. Others
- 7.2. Market Analysis, Insights and Forecast - by Types
- 7.2.1. ACD
- 7.2.2. CPD
- 7.2.3. CPDA
- 7.2.4. Others
- 7.1. Market Analysis, Insights and Forecast - by Application
- 8. Europe Blood Preservatives Analysis, Insights and Forecast, 2020-2032
- 8.1. Market Analysis, Insights and Forecast - by Application
- 8.1.1. Blood Bank
- 8.1.2. Hospital
- 8.1.3. Others
- 8.2. Market Analysis, Insights and Forecast - by Types
- 8.2.1. ACD
- 8.2.2. CPD
- 8.2.3. CPDA
- 8.2.4. Others
- 8.1. Market Analysis, Insights and Forecast - by Application
- 9. Middle East & Africa Blood Preservatives Analysis, Insights and Forecast, 2020-2032
- 9.1. Market Analysis, Insights and Forecast - by Application
- 9.1.1. Blood Bank
- 9.1.2. Hospital
- 9.1.3. Others
- 9.2. Market Analysis, Insights and Forecast - by Types
- 9.2.1. ACD
- 9.2.2. CPD
- 9.2.3. CPDA
- 9.2.4. Others
- 9.1. Market Analysis, Insights and Forecast - by Application
- 10. Asia Pacific Blood Preservatives Analysis, Insights and Forecast, 2020-2032
- 10.1. Market Analysis, Insights and Forecast - by Application
- 10.1.1. Blood Bank
- 10.1.2. Hospital
- 10.1.3. Others
- 10.2. Market Analysis, Insights and Forecast - by Types
- 10.2.1. ACD
- 10.2.2. CPD
- 10.2.3. CPDA
- 10.2.4. Others
- 10.1. Market Analysis, Insights and Forecast - by Application
- 11. Competitive Analysis
- 11.1. Global Market Share Analysis 2025
- 11.2. Company Profiles
- 11.2.1 Terumo BCT
- 11.2.1.1. Overview
- 11.2.1.2. Products
- 11.2.1.3. SWOT Analysis
- 11.2.1.4. Recent Developments
- 11.2.1.5. Financials (Based on Availability)
- 11.2.2 Fresenius Kabi
- 11.2.2.1. Overview
- 11.2.2.2. Products
- 11.2.2.3. SWOT Analysis
- 11.2.2.4. Recent Developments
- 11.2.2.5. Financials (Based on Availability)
- 11.2.3 Grifols
- 11.2.3.1. Overview
- 11.2.3.2. Products
- 11.2.3.3. SWOT Analysis
- 11.2.3.4. Recent Developments
- 11.2.3.5. Financials (Based on Availability)
- 11.2.4 Merck
- 11.2.4.1. Overview
- 11.2.4.2. Products
- 11.2.4.3. SWOT Analysis
- 11.2.4.4. Recent Developments
- 11.2.4.5. Financials (Based on Availability)
- 11.2.5 Baxter
- 11.2.5.1. Overview
- 11.2.5.2. Products
- 11.2.5.3. SWOT Analysis
- 11.2.5.4. Recent Developments
- 11.2.5.5. Financials (Based on Availability)
- 11.2.6 Weigao Group
- 11.2.6.1. Overview
- 11.2.6.2. Products
- 11.2.6.3. SWOT Analysis
- 11.2.6.4. Recent Developments
- 11.2.6.5. Financials (Based on Availability)
- 11.2.1 Terumo BCT
List of Figures
- Figure 1: Global Blood Preservatives Revenue Breakdown (billion, %) by Region 2025 & 2033
- Figure 2: Global Blood Preservatives Volume Breakdown (K, %) by Region 2025 & 2033
- Figure 3: North America Blood Preservatives Revenue (billion), by Application 2025 & 2033
- Figure 4: North America Blood Preservatives Volume (K), by Application 2025 & 2033
- Figure 5: North America Blood Preservatives Revenue Share (%), by Application 2025 & 2033
- Figure 6: North America Blood Preservatives Volume Share (%), by Application 2025 & 2033
- Figure 7: North America Blood Preservatives Revenue (billion), by Types 2025 & 2033
- Figure 8: North America Blood Preservatives Volume (K), by Types 2025 & 2033
- Figure 9: North America Blood Preservatives Revenue Share (%), by Types 2025 & 2033
- Figure 10: North America Blood Preservatives Volume Share (%), by Types 2025 & 2033
- Figure 11: North America Blood Preservatives Revenue (billion), by Country 2025 & 2033
- Figure 12: North America Blood Preservatives Volume (K), by Country 2025 & 2033
- Figure 13: North America Blood Preservatives Revenue Share (%), by Country 2025 & 2033
- Figure 14: North America Blood Preservatives Volume Share (%), by Country 2025 & 2033
- Figure 15: South America Blood Preservatives Revenue (billion), by Application 2025 & 2033
- Figure 16: South America Blood Preservatives Volume (K), by Application 2025 & 2033
- Figure 17: South America Blood Preservatives Revenue Share (%), by Application 2025 & 2033
- Figure 18: South America Blood Preservatives Volume Share (%), by Application 2025 & 2033
- Figure 19: South America Blood Preservatives Revenue (billion), by Types 2025 & 2033
- Figure 20: South America Blood Preservatives Volume (K), by Types 2025 & 2033
- Figure 21: South America Blood Preservatives Revenue Share (%), by Types 2025 & 2033
- Figure 22: South America Blood Preservatives Volume Share (%), by Types 2025 & 2033
- Figure 23: South America Blood Preservatives Revenue (billion), by Country 2025 & 2033
- Figure 24: South America Blood Preservatives Volume (K), by Country 2025 & 2033
- Figure 25: South America Blood Preservatives Revenue Share (%), by Country 2025 & 2033
- Figure 26: South America Blood Preservatives Volume Share (%), by Country 2025 & 2033
- Figure 27: Europe Blood Preservatives Revenue (billion), by Application 2025 & 2033
- Figure 28: Europe Blood Preservatives Volume (K), by Application 2025 & 2033
- Figure 29: Europe Blood Preservatives Revenue Share (%), by Application 2025 & 2033
- Figure 30: Europe Blood Preservatives Volume Share (%), by Application 2025 & 2033
- Figure 31: Europe Blood Preservatives Revenue (billion), by Types 2025 & 2033
- Figure 32: Europe Blood Preservatives Volume (K), by Types 2025 & 2033
- Figure 33: Europe Blood Preservatives Revenue Share (%), by Types 2025 & 2033
- Figure 34: Europe Blood Preservatives Volume Share (%), by Types 2025 & 2033
- Figure 35: Europe Blood Preservatives Revenue (billion), by Country 2025 & 2033
- Figure 36: Europe Blood Preservatives Volume (K), by Country 2025 & 2033
- Figure 37: Europe Blood Preservatives Revenue Share (%), by Country 2025 & 2033
- Figure 38: Europe Blood Preservatives Volume Share (%), by Country 2025 & 2033
- Figure 39: Middle East & Africa Blood Preservatives Revenue (billion), by Application 2025 & 2033
- Figure 40: Middle East & Africa Blood Preservatives Volume (K), by Application 2025 & 2033
- Figure 41: Middle East & Africa Blood Preservatives Revenue Share (%), by Application 2025 & 2033
- Figure 42: Middle East & Africa Blood Preservatives Volume Share (%), by Application 2025 & 2033
- Figure 43: Middle East & Africa Blood Preservatives Revenue (billion), by Types 2025 & 2033
- Figure 44: Middle East & Africa Blood Preservatives Volume (K), by Types 2025 & 2033
- Figure 45: Middle East & Africa Blood Preservatives Revenue Share (%), by Types 2025 & 2033
- Figure 46: Middle East & Africa Blood Preservatives Volume Share (%), by Types 2025 & 2033
- Figure 47: Middle East & Africa Blood Preservatives Revenue (billion), by Country 2025 & 2033
- Figure 48: Middle East & Africa Blood Preservatives Volume (K), by Country 2025 & 2033
- Figure 49: Middle East & Africa Blood Preservatives Revenue Share (%), by Country 2025 & 2033
- Figure 50: Middle East & Africa Blood Preservatives Volume Share (%), by Country 2025 & 2033
- Figure 51: Asia Pacific Blood Preservatives Revenue (billion), by Application 2025 & 2033
- Figure 52: Asia Pacific Blood Preservatives Volume (K), by Application 2025 & 2033
- Figure 53: Asia Pacific Blood Preservatives Revenue Share (%), by Application 2025 & 2033
- Figure 54: Asia Pacific Blood Preservatives Volume Share (%), by Application 2025 & 2033
- Figure 55: Asia Pacific Blood Preservatives Revenue (billion), by Types 2025 & 2033
- Figure 56: Asia Pacific Blood Preservatives Volume (K), by Types 2025 & 2033
- Figure 57: Asia Pacific Blood Preservatives Revenue Share (%), by Types 2025 & 2033
- Figure 58: Asia Pacific Blood Preservatives Volume Share (%), by Types 2025 & 2033
- Figure 59: Asia Pacific Blood Preservatives Revenue (billion), by Country 2025 & 2033
- Figure 60: Asia Pacific Blood Preservatives Volume (K), by Country 2025 & 2033
- Figure 61: Asia Pacific Blood Preservatives Revenue Share (%), by Country 2025 & 2033
- Figure 62: Asia Pacific Blood Preservatives Volume Share (%), by Country 2025 & 2033
List of Tables
- Table 1: Global Blood Preservatives Revenue billion Forecast, by Application 2020 & 2033
- Table 2: Global Blood Preservatives Volume K Forecast, by Application 2020 & 2033
- Table 3: Global Blood Preservatives Revenue billion Forecast, by Types 2020 & 2033
- Table 4: Global Blood Preservatives Volume K Forecast, by Types 2020 & 2033
- Table 5: Global Blood Preservatives Revenue billion Forecast, by Region 2020 & 2033
- Table 6: Global Blood Preservatives Volume K Forecast, by Region 2020 & 2033
- Table 7: Global Blood Preservatives Revenue billion Forecast, by Application 2020 & 2033
- Table 8: Global Blood Preservatives Volume K Forecast, by Application 2020 & 2033
- Table 9: Global Blood Preservatives Revenue billion Forecast, by Types 2020 & 2033
- Table 10: Global Blood Preservatives Volume K Forecast, by Types 2020 & 2033
- Table 11: Global Blood Preservatives Revenue billion Forecast, by Country 2020 & 2033
- Table 12: Global Blood Preservatives Volume K Forecast, by Country 2020 & 2033
- Table 13: United States Blood Preservatives Revenue (billion) Forecast, by Application 2020 & 2033
- Table 14: United States Blood Preservatives Volume (K) Forecast, by Application 2020 & 2033
- Table 15: Canada Blood Preservatives Revenue (billion) Forecast, by Application 2020 & 2033
- Table 16: Canada Blood Preservatives Volume (K) Forecast, by Application 2020 & 2033
- Table 17: Mexico Blood Preservatives Revenue (billion) Forecast, by Application 2020 & 2033
- Table 18: Mexico Blood Preservatives Volume (K) Forecast, by Application 2020 & 2033
- Table 19: Global Blood Preservatives Revenue billion Forecast, by Application 2020 & 2033
- Table 20: Global Blood Preservatives Volume K Forecast, by Application 2020 & 2033
- Table 21: Global Blood Preservatives Revenue billion Forecast, by Types 2020 & 2033
- Table 22: Global Blood Preservatives Volume K Forecast, by Types 2020 & 2033
- Table 23: Global Blood Preservatives Revenue billion Forecast, by Country 2020 & 2033
- Table 24: Global Blood Preservatives Volume K Forecast, by Country 2020 & 2033
- Table 25: Brazil Blood Preservatives Revenue (billion) Forecast, by Application 2020 & 2033
- Table 26: Brazil Blood Preservatives Volume (K) Forecast, by Application 2020 & 2033
- Table 27: Argentina Blood Preservatives Revenue (billion) Forecast, by Application 2020 & 2033
- Table 28: Argentina Blood Preservatives Volume (K) Forecast, by Application 2020 & 2033
- Table 29: Rest of South America Blood Preservatives Revenue (billion) Forecast, by Application 2020 & 2033
- Table 30: Rest of South America Blood Preservatives Volume (K) Forecast, by Application 2020 & 2033
- Table 31: Global Blood Preservatives Revenue billion Forecast, by Application 2020 & 2033
- Table 32: Global Blood Preservatives Volume K Forecast, by Application 2020 & 2033
- Table 33: Global Blood Preservatives Revenue billion Forecast, by Types 2020 & 2033
- Table 34: Global Blood Preservatives Volume K Forecast, by Types 2020 & 2033
- Table 35: Global Blood Preservatives Revenue billion Forecast, by Country 2020 & 2033
- Table 36: Global Blood Preservatives Volume K Forecast, by Country 2020 & 2033
- Table 37: United Kingdom Blood Preservatives Revenue (billion) Forecast, by Application 2020 & 2033
- Table 38: United Kingdom Blood Preservatives Volume (K) Forecast, by Application 2020 & 2033
- Table 39: Germany Blood Preservatives Revenue (billion) Forecast, by Application 2020 & 2033
- Table 40: Germany Blood Preservatives Volume (K) Forecast, by Application 2020 & 2033
- Table 41: France Blood Preservatives Revenue (billion) Forecast, by Application 2020 & 2033
- Table 42: France Blood Preservatives Volume (K) Forecast, by Application 2020 & 2033
- Table 43: Italy Blood Preservatives Revenue (billion) Forecast, by Application 2020 & 2033
- Table 44: Italy Blood Preservatives Volume (K) Forecast, by Application 2020 & 2033
- Table 45: Spain Blood Preservatives Revenue (billion) Forecast, by Application 2020 & 2033
- Table 46: Spain Blood Preservatives Volume (K) Forecast, by Application 2020 & 2033
- Table 47: Russia Blood Preservatives Revenue (billion) Forecast, by Application 2020 & 2033
- Table 48: Russia Blood Preservatives Volume (K) Forecast, by Application 2020 & 2033
- Table 49: Benelux Blood Preservatives Revenue (billion) Forecast, by Application 2020 & 2033
- Table 50: Benelux Blood Preservatives Volume (K) Forecast, by Application 2020 & 2033
- Table 51: Nordics Blood Preservatives Revenue (billion) Forecast, by Application 2020 & 2033
- Table 52: Nordics Blood Preservatives Volume (K) Forecast, by Application 2020 & 2033
- Table 53: Rest of Europe Blood Preservatives Revenue (billion) Forecast, by Application 2020 & 2033
- Table 54: Rest of Europe Blood Preservatives Volume (K) Forecast, by Application 2020 & 2033
- Table 55: Global Blood Preservatives Revenue billion Forecast, by Application 2020 & 2033
- Table 56: Global Blood Preservatives Volume K Forecast, by Application 2020 & 2033
- Table 57: Global Blood Preservatives Revenue billion Forecast, by Types 2020 & 2033
- Table 58: Global Blood Preservatives Volume K Forecast, by Types 2020 & 2033
- Table 59: Global Blood Preservatives Revenue billion Forecast, by Country 2020 & 2033
- Table 60: Global Blood Preservatives Volume K Forecast, by Country 2020 & 2033
- Table 61: Turkey Blood Preservatives Revenue (billion) Forecast, by Application 2020 & 2033
- Table 62: Turkey Blood Preservatives Volume (K) Forecast, by Application 2020 & 2033
- Table 63: Israel Blood Preservatives Revenue (billion) Forecast, by Application 2020 & 2033
- Table 64: Israel Blood Preservatives Volume (K) Forecast, by Application 2020 & 2033
- Table 65: GCC Blood Preservatives Revenue (billion) Forecast, by Application 2020 & 2033
- Table 66: GCC Blood Preservatives Volume (K) Forecast, by Application 2020 & 2033
- Table 67: North Africa Blood Preservatives Revenue (billion) Forecast, by Application 2020 & 2033
- Table 68: North Africa Blood Preservatives Volume (K) Forecast, by Application 2020 & 2033
- Table 69: South Africa Blood Preservatives Revenue (billion) Forecast, by Application 2020 & 2033
- Table 70: South Africa Blood Preservatives Volume (K) Forecast, by Application 2020 & 2033
- Table 71: Rest of Middle East & Africa Blood Preservatives Revenue (billion) Forecast, by Application 2020 & 2033
- Table 72: Rest of Middle East & Africa Blood Preservatives Volume (K) Forecast, by Application 2020 & 2033
- Table 73: Global Blood Preservatives Revenue billion Forecast, by Application 2020 & 2033
- Table 74: Global Blood Preservatives Volume K Forecast, by Application 2020 & 2033
- Table 75: Global Blood Preservatives Revenue billion Forecast, by Types 2020 & 2033
- Table 76: Global Blood Preservatives Volume K Forecast, by Types 2020 & 2033
- Table 77: Global Blood Preservatives Revenue billion Forecast, by Country 2020 & 2033
- Table 78: Global Blood Preservatives Volume K Forecast, by Country 2020 & 2033
- Table 79: China Blood Preservatives Revenue (billion) Forecast, by Application 2020 & 2033
- Table 80: China Blood Preservatives Volume (K) Forecast, by Application 2020 & 2033
- Table 81: India Blood Preservatives Revenue (billion) Forecast, by Application 2020 & 2033
- Table 82: India Blood Preservatives Volume (K) Forecast, by Application 2020 & 2033
- Table 83: Japan Blood Preservatives Revenue (billion) Forecast, by Application 2020 & 2033
- Table 84: Japan Blood Preservatives Volume (K) Forecast, by Application 2020 & 2033
- Table 85: South Korea Blood Preservatives Revenue (billion) Forecast, by Application 2020 & 2033
- Table 86: South Korea Blood Preservatives Volume (K) Forecast, by Application 2020 & 2033
- Table 87: ASEAN Blood Preservatives Revenue (billion) Forecast, by Application 2020 & 2033
- Table 88: ASEAN Blood Preservatives Volume (K) Forecast, by Application 2020 & 2033
- Table 89: Oceania Blood Preservatives Revenue (billion) Forecast, by Application 2020 & 2033
- Table 90: Oceania Blood Preservatives Volume (K) Forecast, by Application 2020 & 2033
- Table 91: Rest of Asia Pacific Blood Preservatives Revenue (billion) Forecast, by Application 2020 & 2033
- Table 92: Rest of Asia Pacific Blood Preservatives Volume (K) Forecast, by Application 2020 & 2033
Frequently Asked Questions
1. What is the projected Compound Annual Growth Rate (CAGR) of the Blood Preservatives?
The projected CAGR is approximately 8.91%.
2. Which companies are prominent players in the Blood Preservatives?
Key companies in the market include Terumo BCT, Fresenius Kabi, Grifols, Merck, Baxter, Weigao Group.
3. What are the main segments of the Blood Preservatives?
The market segments include Application, Types.
4. Can you provide details about the market size?
The market size is estimated to be USD 1.26 billion as of 2022.
5. What are some drivers contributing to market growth?
N/A
6. What are the notable trends driving market growth?
N/A
7. Are there any restraints impacting market growth?
N/A
8. Can you provide examples of recent developments in the market?
N/A
9. What pricing options are available for accessing the report?
Pricing options include single-user, multi-user, and enterprise licenses priced at USD 4350.00, USD 6525.00, and USD 8700.00 respectively.
10. Is the market size provided in terms of value or volume?
The market size is provided in terms of value, measured in billion and volume, measured in K.
11. Are there any specific market keywords associated with the report?
Yes, the market keyword associated with the report is "Blood Preservatives," which aids in identifying and referencing the specific market segment covered.
12. How do I determine which pricing option suits my needs best?
The pricing options vary based on user requirements and access needs. Individual users may opt for single-user licenses, while businesses requiring broader access may choose multi-user or enterprise licenses for cost-effective access to the report.
13. Are there any additional resources or data provided in the Blood Preservatives report?
While the report offers comprehensive insights, it's advisable to review the specific contents or supplementary materials provided to ascertain if additional resources or data are available.
14. How can I stay updated on further developments or reports in the Blood Preservatives?
To stay informed about further developments, trends, and reports in the Blood Preservatives, consider subscribing to industry newsletters, following relevant companies and organizations, or regularly checking reputable industry news sources and publications.
Methodology
Step 1 - Identification of Relevant Samples Size from Population Database


Step 2 - Approaches for Defining Global Market Size (Value, Volume* & Price*)

Note*: In applicable scenarios
Step 3 - Data Sources
Primary Research
- Web Analytics
- Survey Reports
- Research Institute
- Latest Research Reports
- Opinion Leaders
Secondary Research
- Annual Reports
- White Paper
- Latest Press Release
- Industry Association
- Paid Database
- Investor Presentations

Step 4 - Data Triangulation
Involves using different sources of information in order to increase the validity of a study
These sources are likely to be stakeholders in a program - participants, other researchers, program staff, other community members, and so on.
Then we put all data in single framework & apply various statistical tools to find out the dynamic on the market.
During the analysis stage, feedback from the stakeholder groups would be compared to determine areas of agreement as well as areas of divergence