

Key Insights
The global cancer screening technology market is poised for significant expansion, driven by escalating cancer incidence, technological innovations, and increased healthcare investment. The market, valued at $70.99 billion in the base year 2025, is projected to grow at a Compound Annual Growth Rate (CAGR) of 9.6%, reaching an estimated value of $150 billion by 2033. This growth is underpinned by several pivotal factors. The increasing adoption of highly sensitive and specific screening modalities, including liquid biopsies and advanced imaging techniques like multiparametric MRI for prostate cancer, is dramatically enhancing early detection capabilities. Concurrently, heightened public awareness regarding cancer risks and the imperative of preventive screenings is fueling demand for these technologies. Moreover, continuous technological advancements are leading to less invasive and more patient-friendly screening procedures, thereby improving acceptance and compliance. Supportive governmental policies and reimbursement frameworks across various regions further stimulate the widespread implementation of cancer screening programs.
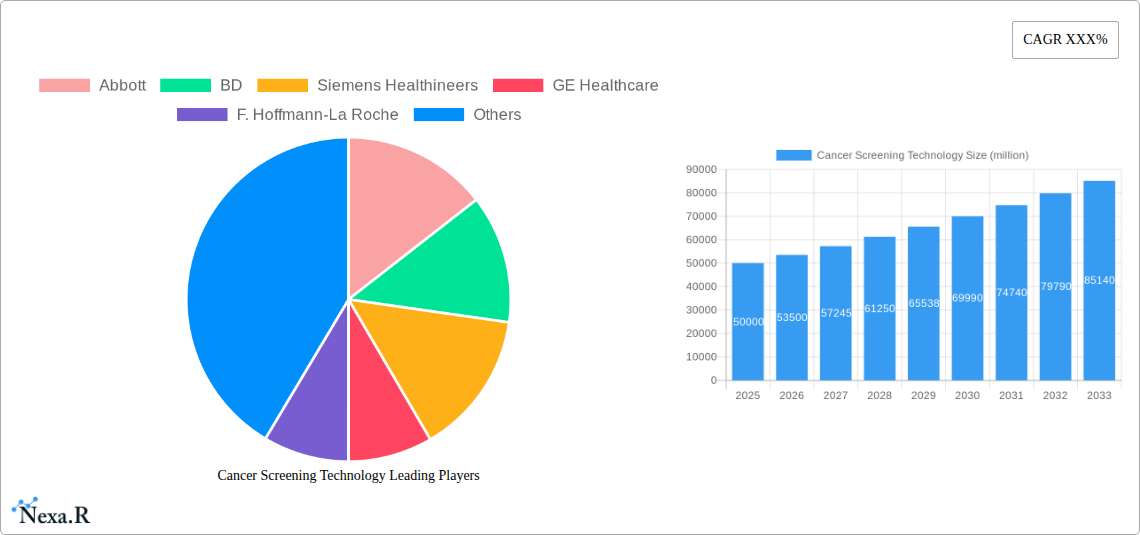
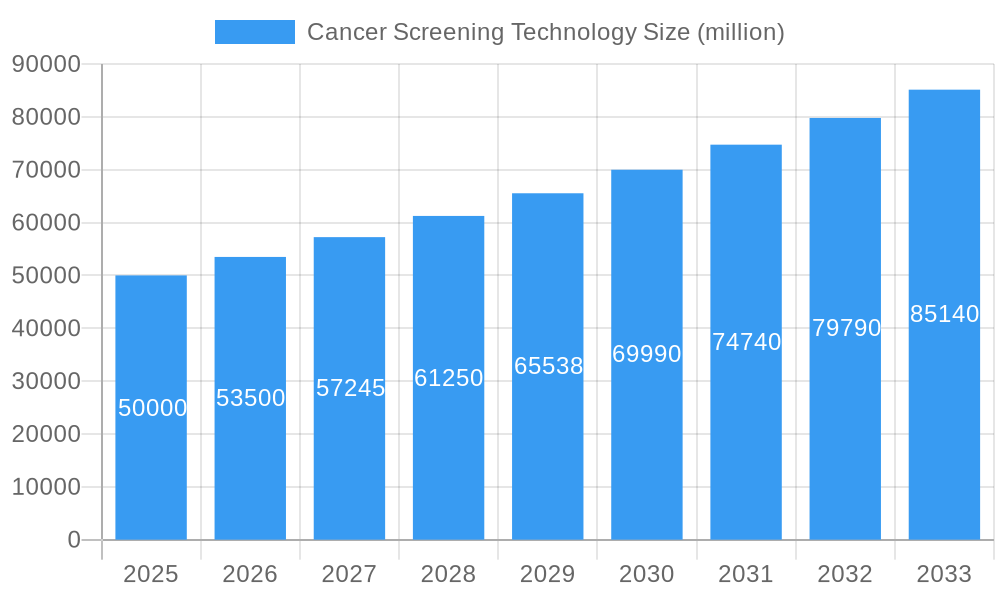
Cancer Screening Technology Market Size (In Billion)
Despite the positive trajectory, the market confronts certain obstacles. The substantial cost of advanced technologies, particularly those in molecular diagnostics and sophisticated imaging, can limit accessibility, especially in resource-constrained economies. Furthermore, inconsistencies in screening guidelines and varying healthcare infrastructure across different geographical areas contribute to disparities in screening rates. Nevertheless, the market is anticipated to remain highly attractive, presenting considerable growth opportunities in emerging economies and fostering the development of novel screening technologies tailored for specific cancer types. Leading companies such as Abbott, BD, Siemens Healthineers, and Roche are spearheading innovation and expanding their market footprint through strategic collaborations, new product introductions, and acquisitions. Segments exhibiting the most robust growth are expected to be molecular diagnostics and AI-driven image analysis, aimed at optimizing accuracy and operational efficiency.
Cancer Screening Technology Company Market Share
Cancer Screening Technology Market Report: 2019-2033
This comprehensive report provides an in-depth analysis of the global Cancer Screening Technology market, offering invaluable insights for industry professionals, investors, and strategic decision-makers. With a focus on market dynamics, growth trends, key players, and future opportunities, this report covers the period from 2019 to 2033, with a base year of 2025. The report's detailed segmentation and analysis of parent and child markets provides a granular understanding of this rapidly evolving landscape. The total market size in 2025 is estimated at $XX billion.
Study Period: 2019–2033 | Base Year: 2025 | Estimated Year: 2025 | Forecast Period: 2025–2033 | Historical Period: 2019–2024
Cancer Screening Technology Market Dynamics & Structure
The Cancer Screening Technology market is characterized by a moderately concentrated landscape, with key players like Abbott, BD, Siemens Healthineers, and Roche holding significant market share. Technological innovation, particularly in areas like liquid biopsies and AI-driven diagnostics, is a major driver of growth. Stringent regulatory frameworks, including FDA approvals and CE markings, influence product development and market access. The market also faces competitive pressure from substitute technologies and emerging diagnostic approaches. End-user demographics, primarily skewed towards an aging population and rising cancer incidence rates, fuel demand. The past five years have witnessed a moderate level of M&A activity, with approximately XX deals valued at $XX billion.
- Market Concentration: Moderately concentrated, with top 5 players holding approximately XX% market share in 2025.
- Technological Innovation: Rapid advancements in molecular diagnostics, imaging, and AI-powered analytics are transforming the landscape.
- Regulatory Frameworks: Stringent regulatory pathways influence market entry and product adoption.
- Competitive Substitutes: Alternative diagnostic methods and evolving treatment strategies pose competitive challenges.
- End-User Demographics: Aging populations and rising cancer incidence rates drive market expansion.
- M&A Trends: Moderate M&A activity observed (XX deals valued at $XX billion from 2019-2024). Further consolidation is expected.
Cancer Screening Technology Growth Trends & Insights
The global Cancer Screening Technology market is experiencing robust growth, driven by factors such as increased cancer prevalence, technological advancements, and rising healthcare expenditure. The market size expanded from $XX billion in 2019 to an estimated $XX billion in 2025, exhibiting a CAGR of XX% during the historical period. This growth is projected to continue throughout the forecast period, with a projected CAGR of XX% from 2025 to 2033, reaching an estimated $XX billion by 2033. This expansion is fueled by factors such as increasing adoption rates of advanced screening technologies, particularly in developed countries, and growing awareness regarding early cancer detection. The market penetration of advanced screening technologies remains relatively low in emerging economies, representing a significant untapped potential. Shifting consumer preferences toward personalized medicine and minimally invasive procedures further contribute to this growth. Technological disruptions, like the introduction of liquid biopsies, are also impacting market dynamics.
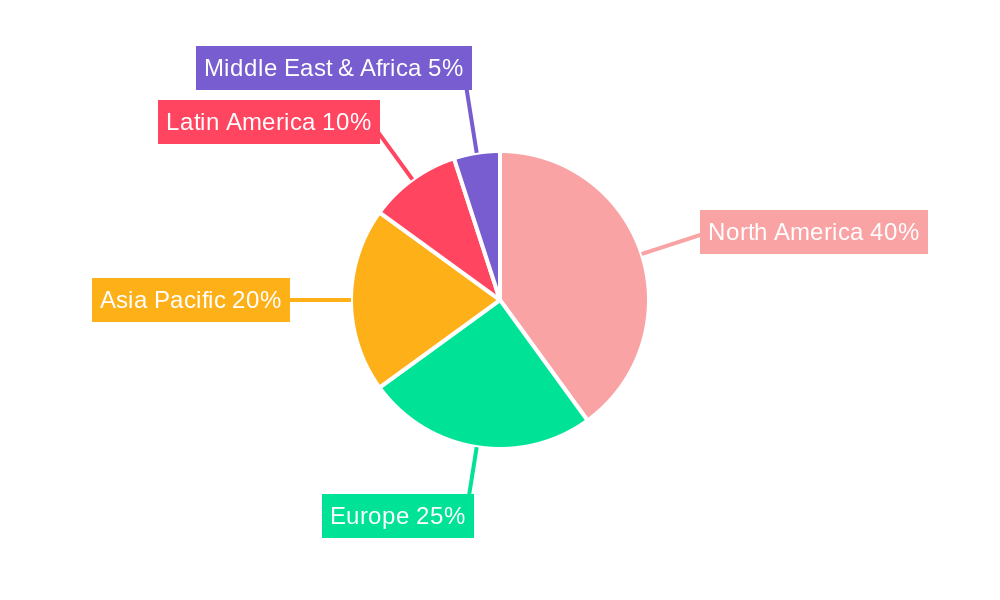
Dominant Regions, Countries, or Segments in Cancer Screening Technology
North America currently dominates the Cancer Screening Technology market, holding approximately XX% market share in 2025, followed by Europe and Asia-Pacific. This dominance is primarily attributable to factors such as higher healthcare expenditure, robust healthcare infrastructure, and early adoption of advanced technologies. The United States, in particular, stands out as a major market driver, owing to its advanced healthcare system and high cancer prevalence rates. However, Asia-Pacific is projected to witness the highest growth rate during the forecast period, fueled by rapid economic development, increasing healthcare awareness, and growing government initiatives to improve healthcare infrastructure.
- North America: High healthcare expenditure, advanced infrastructure, and early adoption of new technologies drive market leadership.
- Europe: Well-established healthcare systems and a significant elderly population contribute to substantial market growth.
- Asia-Pacific: Rapid economic growth, increasing healthcare awareness, and government support propel significant growth potential.
- Key Drivers: Strong government initiatives, increasing healthcare expenditure, rising awareness of early detection.
Cancer Screening Technology Product Landscape
The cancer screening technology market encompasses a wide range of products, including molecular diagnostics (e.g., PCR, next-generation sequencing), imaging technologies (e.g., MRI, CT, PET), and cytology/histopathology methods. Recent innovations have focused on improving sensitivity, specificity, and reducing invasiveness. Liquid biopsies, offering minimally invasive sample collection, are gaining significant traction, along with AI-powered image analysis tools that enhance diagnostic accuracy. These advancements offer improved diagnostic capabilities, reduced turnaround times, and enhanced patient experience, creating significant competitive advantages for manufacturers.
Key Drivers, Barriers & Challenges in Cancer Screening Technology
Key Drivers: Increasing cancer incidence rates, technological advancements (e.g., liquid biopsies, AI-powered diagnostics), rising healthcare expenditure, and growing awareness of early detection.
Key Challenges: High costs associated with advanced technologies, stringent regulatory approvals, reimbursement challenges, and the need for skilled professionals to operate and interpret results. Supply chain disruptions can also cause delays and shortages of crucial components and reagents, potentially impacting the availability and affordability of cancer screening tests. Competition among established players and the emergence of new technologies create additional challenges. The exact quantitative impact of these challenges is difficult to estimate, but delays in regulatory approvals can easily cause setbacks of XX months and increased costs of up to XX%.
Emerging Opportunities in Cancer Screening Technology
Emerging opportunities lie in personalized cancer screening, the development of point-of-care diagnostic tests, expansion into underserved markets, and integration of AI and machine learning into diagnostic workflows. The focus is shifting towards early detection of cancer, with new technologies aiming to increase the sensitivity and specificity of cancer screening, particularly for hard-to-detect cancers. Furthermore, the increasing adoption of telemedicine and remote monitoring presents new avenues for expanding access to cancer screening services, particularly in remote areas.
Growth Accelerators in the Cancer Screening Technology Industry
Technological breakthroughs, particularly in liquid biopsies and AI-driven diagnostics, are significantly accelerating market growth. Strategic partnerships between diagnostic companies, pharmaceutical firms, and healthcare providers are facilitating market expansion and technology adoption. Government initiatives to improve cancer screening coverage and increase awareness are also fostering growth.
Key Players Shaping the Cancer Screening Technology Market
- Abbott
- BD
- Siemens Healthineers
- GE Healthcare
- F. Hoffmann-La Roche
- Olympus Corporation
- FUJIFILM Corporation
- Agilent Technologies
- Eiken Chemical
- Hitachi Chemical (Kyowa Medex)
- Clinical Genomics Pty Ltd (Quest Diagnostics)
- Sysmex
- QIAGEN
- R-Biopharm
- Immunostics
Notable Milestones in Cancer Screening Technology Sector
- 2020: FDA approval of a new liquid biopsy test for early cancer detection.
- 2021: Launch of an AI-powered image analysis system for improved diagnostic accuracy.
- 2022: Strategic partnership between a diagnostic company and a pharmaceutical firm to accelerate development of new cancer screening technologies.
- 2023: Acquisition of a smaller diagnostic company by a major player, expanding its product portfolio. (Further specific examples would be added here based on actual events)
In-Depth Cancer Screening Technology Market Outlook
The future of the Cancer Screening Technology market is bright, driven by continuous technological advancements, increased healthcare spending, and a growing awareness of the importance of early cancer detection. The market is poised for significant growth, with opportunities for innovation and expansion into new markets. Strategic partnerships, focused research and development, and the integration of cutting-edge technologies will play a critical role in shaping the future landscape of cancer screening. The market is expected to witness a continued rise in the adoption of advanced technologies, leading to improved diagnostic accuracy, reduced costs, and enhanced patient care. The focus on personalized medicine will further drive innovation and increase the demand for tailored cancer screening solutions.
Cancer Screening Technology Segmentation
-
1. Application
- 1.1. Lung Cancer Screening
- 1.2. Breast Cancer Screening
- 1.3. Prostate Cancer Screening
- 1.4. Colorectal Cancer Screening
- 1.5. Blood Cancer Screening
- 1.6. Liver Cancer Screening
- 1.7. Pancreatic Cancer Screening
- 1.8. Skin Cancer Screening
- 1.9. Cervical Cancer Screening
- 1.10. Other
-
2. Type
- 2.1. Instrument-based Inspection
- 2.2. Platform-based Inspection
Cancer Screening Technology Segmentation By Geography
-
1. North America
- 1.1. United States
- 1.2. Canada
- 1.3. Mexico
-
2. South America
- 2.1. Brazil
- 2.2. Argentina
- 2.3. Rest of South America
-
3. Europe
- 3.1. United Kingdom
- 3.2. Germany
- 3.3. France
- 3.4. Italy
- 3.5. Spain
- 3.6. Russia
- 3.7. Benelux
- 3.8. Nordics
- 3.9. Rest of Europe
-
4. Middle East & Africa
- 4.1. Turkey
- 4.2. Israel
- 4.3. GCC
- 4.4. North Africa
- 4.5. South Africa
- 4.6. Rest of Middle East & Africa
-
5. Asia Pacific
- 5.1. China
- 5.2. India
- 5.3. Japan
- 5.4. South Korea
- 5.5. ASEAN
- 5.6. Oceania
- 5.7. Rest of Asia Pacific
Cancer Screening Technology Regional Market Share
Geographic Coverage of Cancer Screening Technology
Cancer Screening Technology REPORT HIGHLIGHTS
| Aspects | Details |
|---|---|
| Study Period | 2020-2034 |
| Base Year | 2025 |
| Estimated Year | 2026 |
| Forecast Period | 2026-2034 |
| Historical Period | 2020-2025 |
| Growth Rate | CAGR of 9.6% from 2020-2034 |
| Segmentation |
|
Table of Contents
- 1. Introduction
- 1.1. Research Scope
- 1.2. Market Segmentation
- 1.3. Research Methodology
- 1.4. Definitions and Assumptions
- 2. Executive Summary
- 2.1. Introduction
- 3. Market Dynamics
- 3.1. Introduction
- 3.2. Market Drivers
- 3.3. Market Restrains
- 3.4. Market Trends
- 4. Market Factor Analysis
- 4.1. Porters Five Forces
- 4.2. Supply/Value Chain
- 4.3. PESTEL analysis
- 4.4. Market Entropy
- 4.5. Patent/Trademark Analysis
- 5. Global Cancer Screening Technology Analysis, Insights and Forecast, 2020-2032
- 5.1. Market Analysis, Insights and Forecast - by Application
- 5.1.1. Lung Cancer Screening
- 5.1.2. Breast Cancer Screening
- 5.1.3. Prostate Cancer Screening
- 5.1.4. Colorectal Cancer Screening
- 5.1.5. Blood Cancer Screening
- 5.1.6. Liver Cancer Screening
- 5.1.7. Pancreatic Cancer Screening
- 5.1.8. Skin Cancer Screening
- 5.1.9. Cervical Cancer Screening
- 5.1.10. Other
- 5.2. Market Analysis, Insights and Forecast - by Type
- 5.2.1. Instrument-based Inspection
- 5.2.2. Platform-based Inspection
- 5.3. Market Analysis, Insights and Forecast - by Region
- 5.3.1. North America
- 5.3.2. South America
- 5.3.3. Europe
- 5.3.4. Middle East & Africa
- 5.3.5. Asia Pacific
- 5.1. Market Analysis, Insights and Forecast - by Application
- 6. North America Cancer Screening Technology Analysis, Insights and Forecast, 2020-2032
- 6.1. Market Analysis, Insights and Forecast - by Application
- 6.1.1. Lung Cancer Screening
- 6.1.2. Breast Cancer Screening
- 6.1.3. Prostate Cancer Screening
- 6.1.4. Colorectal Cancer Screening
- 6.1.5. Blood Cancer Screening
- 6.1.6. Liver Cancer Screening
- 6.1.7. Pancreatic Cancer Screening
- 6.1.8. Skin Cancer Screening
- 6.1.9. Cervical Cancer Screening
- 6.1.10. Other
- 6.2. Market Analysis, Insights and Forecast - by Type
- 6.2.1. Instrument-based Inspection
- 6.2.2. Platform-based Inspection
- 6.1. Market Analysis, Insights and Forecast - by Application
- 7. South America Cancer Screening Technology Analysis, Insights and Forecast, 2020-2032
- 7.1. Market Analysis, Insights and Forecast - by Application
- 7.1.1. Lung Cancer Screening
- 7.1.2. Breast Cancer Screening
- 7.1.3. Prostate Cancer Screening
- 7.1.4. Colorectal Cancer Screening
- 7.1.5. Blood Cancer Screening
- 7.1.6. Liver Cancer Screening
- 7.1.7. Pancreatic Cancer Screening
- 7.1.8. Skin Cancer Screening
- 7.1.9. Cervical Cancer Screening
- 7.1.10. Other
- 7.2. Market Analysis, Insights and Forecast - by Type
- 7.2.1. Instrument-based Inspection
- 7.2.2. Platform-based Inspection
- 7.1. Market Analysis, Insights and Forecast - by Application
- 8. Europe Cancer Screening Technology Analysis, Insights and Forecast, 2020-2032
- 8.1. Market Analysis, Insights and Forecast - by Application
- 8.1.1. Lung Cancer Screening
- 8.1.2. Breast Cancer Screening
- 8.1.3. Prostate Cancer Screening
- 8.1.4. Colorectal Cancer Screening
- 8.1.5. Blood Cancer Screening
- 8.1.6. Liver Cancer Screening
- 8.1.7. Pancreatic Cancer Screening
- 8.1.8. Skin Cancer Screening
- 8.1.9. Cervical Cancer Screening
- 8.1.10. Other
- 8.2. Market Analysis, Insights and Forecast - by Type
- 8.2.1. Instrument-based Inspection
- 8.2.2. Platform-based Inspection
- 8.1. Market Analysis, Insights and Forecast - by Application
- 9. Middle East & Africa Cancer Screening Technology Analysis, Insights and Forecast, 2020-2032
- 9.1. Market Analysis, Insights and Forecast - by Application
- 9.1.1. Lung Cancer Screening
- 9.1.2. Breast Cancer Screening
- 9.1.3. Prostate Cancer Screening
- 9.1.4. Colorectal Cancer Screening
- 9.1.5. Blood Cancer Screening
- 9.1.6. Liver Cancer Screening
- 9.1.7. Pancreatic Cancer Screening
- 9.1.8. Skin Cancer Screening
- 9.1.9. Cervical Cancer Screening
- 9.1.10. Other
- 9.2. Market Analysis, Insights and Forecast - by Type
- 9.2.1. Instrument-based Inspection
- 9.2.2. Platform-based Inspection
- 9.1. Market Analysis, Insights and Forecast - by Application
- 10. Asia Pacific Cancer Screening Technology Analysis, Insights and Forecast, 2020-2032
- 10.1. Market Analysis, Insights and Forecast - by Application
- 10.1.1. Lung Cancer Screening
- 10.1.2. Breast Cancer Screening
- 10.1.3. Prostate Cancer Screening
- 10.1.4. Colorectal Cancer Screening
- 10.1.5. Blood Cancer Screening
- 10.1.6. Liver Cancer Screening
- 10.1.7. Pancreatic Cancer Screening
- 10.1.8. Skin Cancer Screening
- 10.1.9. Cervical Cancer Screening
- 10.1.10. Other
- 10.2. Market Analysis, Insights and Forecast - by Type
- 10.2.1. Instrument-based Inspection
- 10.2.2. Platform-based Inspection
- 10.1. Market Analysis, Insights and Forecast - by Application
- 11. Competitive Analysis
- 11.1. Global Market Share Analysis 2025
- 11.2. Company Profiles
- 11.2.1 Abbott
- 11.2.1.1. Overview
- 11.2.1.2. Products
- 11.2.1.3. SWOT Analysis
- 11.2.1.4. Recent Developments
- 11.2.1.5. Financials (Based on Availability)
- 11.2.2 BD
- 11.2.2.1. Overview
- 11.2.2.2. Products
- 11.2.2.3. SWOT Analysis
- 11.2.2.4. Recent Developments
- 11.2.2.5. Financials (Based on Availability)
- 11.2.3 Siemens Healthineers
- 11.2.3.1. Overview
- 11.2.3.2. Products
- 11.2.3.3. SWOT Analysis
- 11.2.3.4. Recent Developments
- 11.2.3.5. Financials (Based on Availability)
- 11.2.4 GE Healthcare
- 11.2.4.1. Overview
- 11.2.4.2. Products
- 11.2.4.3. SWOT Analysis
- 11.2.4.4. Recent Developments
- 11.2.4.5. Financials (Based on Availability)
- 11.2.5 F. Hoffmann-La Roche
- 11.2.5.1. Overview
- 11.2.5.2. Products
- 11.2.5.3. SWOT Analysis
- 11.2.5.4. Recent Developments
- 11.2.5.5. Financials (Based on Availability)
- 11.2.6 Olympus Corporation
- 11.2.6.1. Overview
- 11.2.6.2. Products
- 11.2.6.3. SWOT Analysis
- 11.2.6.4. Recent Developments
- 11.2.6.5. Financials (Based on Availability)
- 11.2.7 FUJIFILM Corporation
- 11.2.7.1. Overview
- 11.2.7.2. Products
- 11.2.7.3. SWOT Analysis
- 11.2.7.4. Recent Developments
- 11.2.7.5. Financials (Based on Availability)
- 11.2.8 Agilent Technologies
- 11.2.8.1. Overview
- 11.2.8.2. Products
- 11.2.8.3. SWOT Analysis
- 11.2.8.4. Recent Developments
- 11.2.8.5. Financials (Based on Availability)
- 11.2.9 Eiken Chemical
- 11.2.9.1. Overview
- 11.2.9.2. Products
- 11.2.9.3. SWOT Analysis
- 11.2.9.4. Recent Developments
- 11.2.9.5. Financials (Based on Availability)
- 11.2.10 Hitachi Chemical (Kyowa Medex)
- 11.2.10.1. Overview
- 11.2.10.2. Products
- 11.2.10.3. SWOT Analysis
- 11.2.10.4. Recent Developments
- 11.2.10.5. Financials (Based on Availability)
- 11.2.11 Clinical Genomics Pty Ltd (Quest Diagnostics)
- 11.2.11.1. Overview
- 11.2.11.2. Products
- 11.2.11.3. SWOT Analysis
- 11.2.11.4. Recent Developments
- 11.2.11.5. Financials (Based on Availability)
- 11.2.12 Sysmex
- 11.2.12.1. Overview
- 11.2.12.2. Products
- 11.2.12.3. SWOT Analysis
- 11.2.12.4. Recent Developments
- 11.2.12.5. Financials (Based on Availability)
- 11.2.13 QIAGEN
- 11.2.13.1. Overview
- 11.2.13.2. Products
- 11.2.13.3. SWOT Analysis
- 11.2.13.4. Recent Developments
- 11.2.13.5. Financials (Based on Availability)
- 11.2.14 R-Biopharm
- 11.2.14.1. Overview
- 11.2.14.2. Products
- 11.2.14.3. SWOT Analysis
- 11.2.14.4. Recent Developments
- 11.2.14.5. Financials (Based on Availability)
- 11.2.15 Immunostics
- 11.2.15.1. Overview
- 11.2.15.2. Products
- 11.2.15.3. SWOT Analysis
- 11.2.15.4. Recent Developments
- 11.2.15.5. Financials (Based on Availability)
- 11.2.1 Abbott
List of Figures
- Figure 1: Global Cancer Screening Technology Revenue Breakdown (billion, %) by Region 2025 & 2033
- Figure 2: North America Cancer Screening Technology Revenue (billion), by Application 2025 & 2033
- Figure 3: North America Cancer Screening Technology Revenue Share (%), by Application 2025 & 2033
- Figure 4: North America Cancer Screening Technology Revenue (billion), by Type 2025 & 2033
- Figure 5: North America Cancer Screening Technology Revenue Share (%), by Type 2025 & 2033
- Figure 6: North America Cancer Screening Technology Revenue (billion), by Country 2025 & 2033
- Figure 7: North America Cancer Screening Technology Revenue Share (%), by Country 2025 & 2033
- Figure 8: South America Cancer Screening Technology Revenue (billion), by Application 2025 & 2033
- Figure 9: South America Cancer Screening Technology Revenue Share (%), by Application 2025 & 2033
- Figure 10: South America Cancer Screening Technology Revenue (billion), by Type 2025 & 2033
- Figure 11: South America Cancer Screening Technology Revenue Share (%), by Type 2025 & 2033
- Figure 12: South America Cancer Screening Technology Revenue (billion), by Country 2025 & 2033
- Figure 13: South America Cancer Screening Technology Revenue Share (%), by Country 2025 & 2033
- Figure 14: Europe Cancer Screening Technology Revenue (billion), by Application 2025 & 2033
- Figure 15: Europe Cancer Screening Technology Revenue Share (%), by Application 2025 & 2033
- Figure 16: Europe Cancer Screening Technology Revenue (billion), by Type 2025 & 2033
- Figure 17: Europe Cancer Screening Technology Revenue Share (%), by Type 2025 & 2033
- Figure 18: Europe Cancer Screening Technology Revenue (billion), by Country 2025 & 2033
- Figure 19: Europe Cancer Screening Technology Revenue Share (%), by Country 2025 & 2033
- Figure 20: Middle East & Africa Cancer Screening Technology Revenue (billion), by Application 2025 & 2033
- Figure 21: Middle East & Africa Cancer Screening Technology Revenue Share (%), by Application 2025 & 2033
- Figure 22: Middle East & Africa Cancer Screening Technology Revenue (billion), by Type 2025 & 2033
- Figure 23: Middle East & Africa Cancer Screening Technology Revenue Share (%), by Type 2025 & 2033
- Figure 24: Middle East & Africa Cancer Screening Technology Revenue (billion), by Country 2025 & 2033
- Figure 25: Middle East & Africa Cancer Screening Technology Revenue Share (%), by Country 2025 & 2033
- Figure 26: Asia Pacific Cancer Screening Technology Revenue (billion), by Application 2025 & 2033
- Figure 27: Asia Pacific Cancer Screening Technology Revenue Share (%), by Application 2025 & 2033
- Figure 28: Asia Pacific Cancer Screening Technology Revenue (billion), by Type 2025 & 2033
- Figure 29: Asia Pacific Cancer Screening Technology Revenue Share (%), by Type 2025 & 2033
- Figure 30: Asia Pacific Cancer Screening Technology Revenue (billion), by Country 2025 & 2033
- Figure 31: Asia Pacific Cancer Screening Technology Revenue Share (%), by Country 2025 & 2033
List of Tables
- Table 1: Global Cancer Screening Technology Revenue billion Forecast, by Application 2020 & 2033
- Table 2: Global Cancer Screening Technology Revenue billion Forecast, by Type 2020 & 2033
- Table 3: Global Cancer Screening Technology Revenue billion Forecast, by Region 2020 & 2033
- Table 4: Global Cancer Screening Technology Revenue billion Forecast, by Application 2020 & 2033
- Table 5: Global Cancer Screening Technology Revenue billion Forecast, by Type 2020 & 2033
- Table 6: Global Cancer Screening Technology Revenue billion Forecast, by Country 2020 & 2033
- Table 7: United States Cancer Screening Technology Revenue (billion) Forecast, by Application 2020 & 2033
- Table 8: Canada Cancer Screening Technology Revenue (billion) Forecast, by Application 2020 & 2033
- Table 9: Mexico Cancer Screening Technology Revenue (billion) Forecast, by Application 2020 & 2033
- Table 10: Global Cancer Screening Technology Revenue billion Forecast, by Application 2020 & 2033
- Table 11: Global Cancer Screening Technology Revenue billion Forecast, by Type 2020 & 2033
- Table 12: Global Cancer Screening Technology Revenue billion Forecast, by Country 2020 & 2033
- Table 13: Brazil Cancer Screening Technology Revenue (billion) Forecast, by Application 2020 & 2033
- Table 14: Argentina Cancer Screening Technology Revenue (billion) Forecast, by Application 2020 & 2033
- Table 15: Rest of South America Cancer Screening Technology Revenue (billion) Forecast, by Application 2020 & 2033
- Table 16: Global Cancer Screening Technology Revenue billion Forecast, by Application 2020 & 2033
- Table 17: Global Cancer Screening Technology Revenue billion Forecast, by Type 2020 & 2033
- Table 18: Global Cancer Screening Technology Revenue billion Forecast, by Country 2020 & 2033
- Table 19: United Kingdom Cancer Screening Technology Revenue (billion) Forecast, by Application 2020 & 2033
- Table 20: Germany Cancer Screening Technology Revenue (billion) Forecast, by Application 2020 & 2033
- Table 21: France Cancer Screening Technology Revenue (billion) Forecast, by Application 2020 & 2033
- Table 22: Italy Cancer Screening Technology Revenue (billion) Forecast, by Application 2020 & 2033
- Table 23: Spain Cancer Screening Technology Revenue (billion) Forecast, by Application 2020 & 2033
- Table 24: Russia Cancer Screening Technology Revenue (billion) Forecast, by Application 2020 & 2033
- Table 25: Benelux Cancer Screening Technology Revenue (billion) Forecast, by Application 2020 & 2033
- Table 26: Nordics Cancer Screening Technology Revenue (billion) Forecast, by Application 2020 & 2033
- Table 27: Rest of Europe Cancer Screening Technology Revenue (billion) Forecast, by Application 2020 & 2033
- Table 28: Global Cancer Screening Technology Revenue billion Forecast, by Application 2020 & 2033
- Table 29: Global Cancer Screening Technology Revenue billion Forecast, by Type 2020 & 2033
- Table 30: Global Cancer Screening Technology Revenue billion Forecast, by Country 2020 & 2033
- Table 31: Turkey Cancer Screening Technology Revenue (billion) Forecast, by Application 2020 & 2033
- Table 32: Israel Cancer Screening Technology Revenue (billion) Forecast, by Application 2020 & 2033
- Table 33: GCC Cancer Screening Technology Revenue (billion) Forecast, by Application 2020 & 2033
- Table 34: North Africa Cancer Screening Technology Revenue (billion) Forecast, by Application 2020 & 2033
- Table 35: South Africa Cancer Screening Technology Revenue (billion) Forecast, by Application 2020 & 2033
- Table 36: Rest of Middle East & Africa Cancer Screening Technology Revenue (billion) Forecast, by Application 2020 & 2033
- Table 37: Global Cancer Screening Technology Revenue billion Forecast, by Application 2020 & 2033
- Table 38: Global Cancer Screening Technology Revenue billion Forecast, by Type 2020 & 2033
- Table 39: Global Cancer Screening Technology Revenue billion Forecast, by Country 2020 & 2033
- Table 40: China Cancer Screening Technology Revenue (billion) Forecast, by Application 2020 & 2033
- Table 41: India Cancer Screening Technology Revenue (billion) Forecast, by Application 2020 & 2033
- Table 42: Japan Cancer Screening Technology Revenue (billion) Forecast, by Application 2020 & 2033
- Table 43: South Korea Cancer Screening Technology Revenue (billion) Forecast, by Application 2020 & 2033
- Table 44: ASEAN Cancer Screening Technology Revenue (billion) Forecast, by Application 2020 & 2033
- Table 45: Oceania Cancer Screening Technology Revenue (billion) Forecast, by Application 2020 & 2033
- Table 46: Rest of Asia Pacific Cancer Screening Technology Revenue (billion) Forecast, by Application 2020 & 2033
Frequently Asked Questions
1. What is the projected Compound Annual Growth Rate (CAGR) of the Cancer Screening Technology?
The projected CAGR is approximately 9.6%.
2. Which companies are prominent players in the Cancer Screening Technology?
Key companies in the market include Abbott, BD, Siemens Healthineers, GE Healthcare, F. Hoffmann-La Roche, Olympus Corporation, FUJIFILM Corporation, Agilent Technologies, Eiken Chemical, Hitachi Chemical (Kyowa Medex), Clinical Genomics Pty Ltd (Quest Diagnostics), Sysmex, QIAGEN, R-Biopharm, Immunostics.
3. What are the main segments of the Cancer Screening Technology?
The market segments include Application, Type.
4. Can you provide details about the market size?
The market size is estimated to be USD 70.99 billion as of 2022.
5. What are some drivers contributing to market growth?
N/A
6. What are the notable trends driving market growth?
N/A
7. Are there any restraints impacting market growth?
N/A
8. Can you provide examples of recent developments in the market?
N/A
9. What pricing options are available for accessing the report?
Pricing options include single-user, multi-user, and enterprise licenses priced at USD 2900.00, USD 4350.00, and USD 5800.00 respectively.
10. Is the market size provided in terms of value or volume?
The market size is provided in terms of value, measured in billion.
11. Are there any specific market keywords associated with the report?
Yes, the market keyword associated with the report is "Cancer Screening Technology," which aids in identifying and referencing the specific market segment covered.
12. How do I determine which pricing option suits my needs best?
The pricing options vary based on user requirements and access needs. Individual users may opt for single-user licenses, while businesses requiring broader access may choose multi-user or enterprise licenses for cost-effective access to the report.
13. Are there any additional resources or data provided in the Cancer Screening Technology report?
While the report offers comprehensive insights, it's advisable to review the specific contents or supplementary materials provided to ascertain if additional resources or data are available.
14. How can I stay updated on further developments or reports in the Cancer Screening Technology?
To stay informed about further developments, trends, and reports in the Cancer Screening Technology, consider subscribing to industry newsletters, following relevant companies and organizations, or regularly checking reputable industry news sources and publications.
Methodology
Step 1 - Identification of Relevant Samples Size from Population Database


Step 2 - Approaches for Defining Global Market Size (Value, Volume* & Price*)

Note*: In applicable scenarios
Step 3 - Data Sources
Primary Research
- Web Analytics
- Survey Reports
- Research Institute
- Latest Research Reports
- Opinion Leaders
Secondary Research
- Annual Reports
- White Paper
- Latest Press Release
- Industry Association
- Paid Database
- Investor Presentations

Step 4 - Data Triangulation
Involves using different sources of information in order to increase the validity of a study
These sources are likely to be stakeholders in a program - participants, other researchers, program staff, other community members, and so on.
Then we put all data in single framework & apply various statistical tools to find out the dynamic on the market.
During the analysis stage, feedback from the stakeholder groups would be compared to determine areas of agreement as well as areas of divergence