

Key Insights
The global Digital Interactive Display Walls market is poised for robust growth, projected to reach an estimated $48.29 billion in 2025, with a compelling Compound Annual Growth Rate (CAGR) of 8.09% extending through 2033. This expansion is fueled by an increasing demand across diverse applications, including retail for immersive customer experiences, corporate environments for enhanced collaboration and presentations, and the transportation sector for real-time information dissemination. The healthcare industry is leveraging these displays for patient education and diagnostics, while the hospitality sector is adopting them for dynamic guest engagement and wayfinding. Museums are also embracing interactive walls to create more engaging and educational exhibits. Key drivers for this market surge include the escalating need for sophisticated visual communication solutions, advancements in touch technology, and the growing integration of Artificial Intelligence (AI) and the Internet of Things (IoT) to create smarter, more responsive display systems.
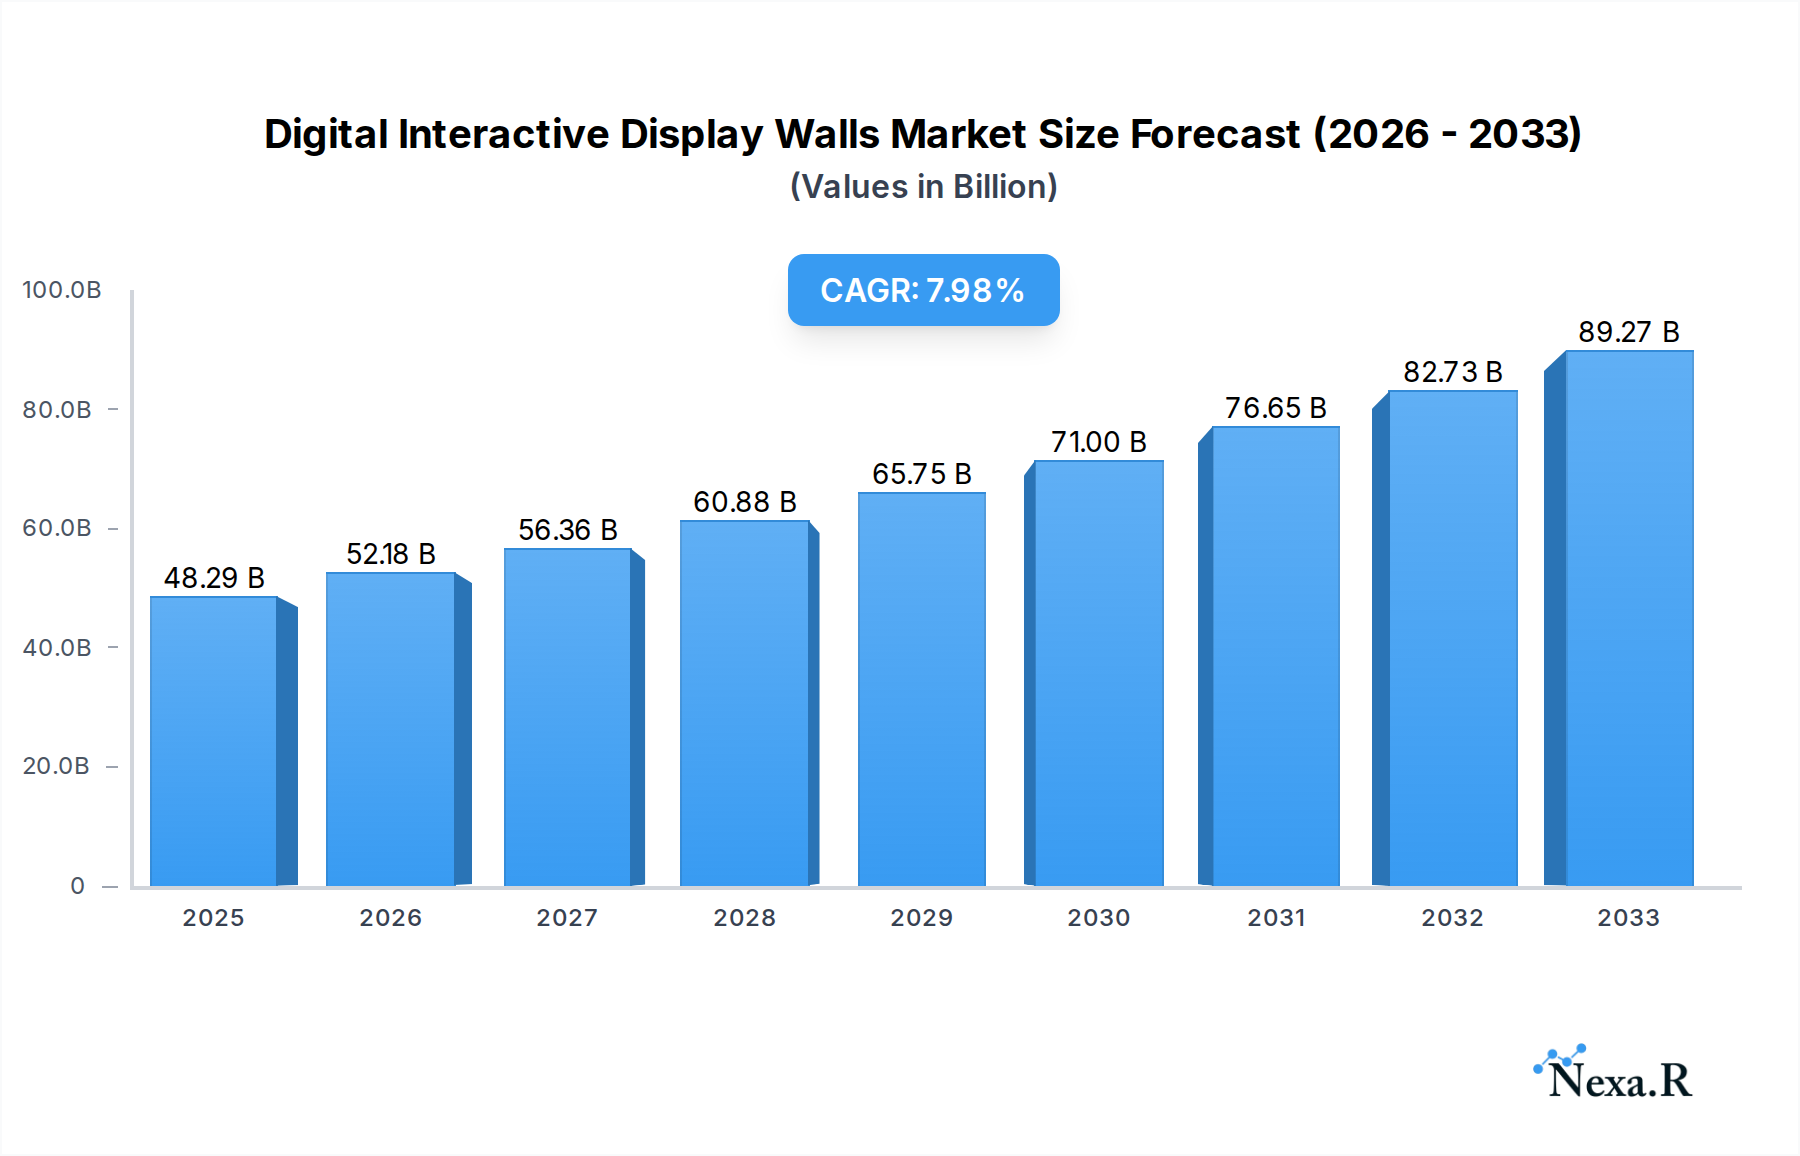
Digital Interactive Display Walls Market Size (In Billion)
The market is characterized by rapid technological advancements, with LED technology increasingly dominating due to its superior brightness, energy efficiency, and adaptability. The competitive landscape is robust, featuring established players like Christie Digital System Inc., Samsung, Microsoft, and Panasonic, alongside innovative companies such as eyefactive GmbH and IDEUM. These companies are actively investing in research and development to offer solutions with higher resolutions, enhanced interactivity, and seamless integration capabilities. While the market enjoys significant growth potential, challenges such as the high initial investment cost for large-scale deployments and the need for skilled personnel for installation and maintenance could present some hurdles. However, the clear benefits of improved engagement, streamlined communication, and data visualization are expected to outweigh these challenges, propelling sustained market expansion across North America, Europe, and the rapidly growing Asia Pacific region.

Digital Interactive Display Walls Company Market Share
Digital Interactive Display Walls Market Dynamics & Structure
The global digital interactive display walls market is characterized by a dynamic and evolving competitive landscape, with key players vying for market share through technological innovation and strategic partnerships. The market concentration is moderately fragmented, featuring a mix of established giants and agile innovators. Christie Digital System Inc., Panasonic, Samsung, and NEC Display Solutions hold significant positions due to their extensive product portfolios and global reach. However, specialized firms like eyefactive GmbH, Prestop B.V., and IDEUM are carving out niches with advanced software integration and custom solutions. The primary driver of technological innovation is the ever-increasing demand for immersive and engaging user experiences across various sectors. Advancements in touch technology, high-resolution displays (4K and 8K), seamless video wall integration, and AI-powered content management systems are pushing the boundaries of what's possible. Regulatory frameworks, while not overly restrictive, tend to focus on safety standards and data privacy, particularly for applications in public spaces and healthcare. Competitive product substitutes include traditional static signage, standalone interactive kiosks, and projection-based systems, but the integrated nature and visual impact of display walls offer a distinct advantage. End-user demographics are broadening, encompassing both B2B clients seeking enhanced corporate communication and customer engagement, and B2C applications in entertainment and education. Mergers and acquisition (M&A) trends are moderately active, with larger companies acquiring smaller, technologically adept firms to bolster their offerings and expand market access. For instance, the acquisition of SMART Technologies by Foxconn has significantly reshaped the interactive whiteboard and display market, impacting the broader interactive display wall ecosystem. This trend underscores a strategic imperative to consolidate expertise and accelerate product development in this rapidly advancing sector.
- Market Concentration: Moderately fragmented with dominant players and specialized innovators.
- Technological Innovation Drivers: Demand for immersive experiences, advanced touch technology, high-resolution displays, AI integration.
- Regulatory Frameworks: Primarily focus on safety standards and data privacy.
- Competitive Product Substitutes: Static signage, standalone kiosks, projection systems.
- End-User Demographics: Broadening B2B and B2C applications.
- M&A Trends: Moderately active, with strategic acquisitions to enhance capabilities.
Digital Interactive Display Walls Growth Trends & Insights
The global digital interactive display walls market is poised for substantial growth, projected to witness a Compound Annual Growth Rate (CAGR) of approximately 12.5% from 2025 to 2033, reaching an estimated market size of $22.3 billion by 2033. This robust expansion is fueled by a confluence of escalating demand for sophisticated visual communication, the increasing adoption of digital signage solutions across diverse industries, and relentless technological advancements that enhance interactivity and immersion. During the historical period of 2019-2024, the market experienced a steady upward trajectory, albeit with some fluctuations attributed to global economic conditions and the initial impacts of the COVID-19 pandemic. However, the post-pandemic era has witnessed a significant resurgence, with businesses and institutions recognizing the critical role of interactive displays in engaging audiences, streamlining operations, and delivering compelling brand experiences. The base year of 2025 marks a pivotal point, with preliminary estimates placing the market value at $10.1 billion, setting the stage for accelerated growth in the subsequent forecast period.
Adoption rates for digital interactive display walls are rapidly increasing, driven by their versatility and effectiveness in various applications. In the Retail sector, these displays are transforming the customer journey, offering personalized product information, interactive catalogs, and engaging brand storytelling, leading to enhanced sales and customer loyalty. The Corporate segment is leveraging display walls for dynamic presentations, collaborative workspaces, and sophisticated digital-out-of-home advertising in lobbies and meeting rooms, fostering better communication and employee engagement. The Transportation sector is increasingly deploying these solutions for real-time information dissemination, wayfinding, and passenger entertainment in airports, train stations, and public transit hubs. In Healthcare, interactive display walls are being utilized for patient education, room occupancy management, and creating calming therapeutic environments. The Hospitality industry benefits from enhanced guest experiences through interactive concierges, digital menus, and personalized information displays. Museums are embracing these technologies to create immersive educational exhibits and interactive visitor experiences.
Technological disruptions, such as the development of ultra-thin bezel displays for seamless video walls, the integration of AI for facial recognition and personalized content delivery, and advancements in multi-touch capabilities, are further democratizing access and increasing the perceived value of these solutions. Consumer behavior is shifting towards a preference for interactive and personalized experiences, making digital interactive display walls an indispensable tool for businesses aiming to capture and retain attention in an increasingly competitive marketplace. The penetration of these displays is expected to deepen significantly across all major verticals as the cost of advanced components decreases and the return on investment becomes more evident. The estimated market size of $10.1 billion in 2025 serves as a solid foundation for continued expansion, with the forecast period promising to solidify the dominance of interactive display technology in visual communication strategies.
Dominant Regions, Countries, or Segments in Digital Interactive Display Walls
The global digital interactive display walls market is experiencing robust growth, with significant variations in dominance across regions and segments. North America currently stands as the leading region, driven by its early adoption of advanced technologies, a strong corporate sector, and significant investment in smart infrastructure, particularly in countries like the United States and Canada. The market size in North America is estimated to be approximately $3.5 billion in 2025, representing a substantial portion of the global market share. This dominance is fueled by several key factors, including a high concentration of multinational corporations that are early adopters of innovative display solutions for branding, internal communications, and customer engagement. Furthermore, the robust retail sector in North America continuously seeks ways to enhance the in-store customer experience, making interactive display walls a key investment. Government initiatives promoting digital transformation and smart city development also contribute to the region's leadership.
From a segment perspective, Corporate applications are the primary growth driver within the digital interactive display walls market, with an estimated market share of 28% in 2025, contributing approximately $2.8 billion to the global market value. This segment's dominance stems from the widespread use of interactive display walls in boardrooms, lobbies, collaborative workspaces, and for digital signage. Companies are increasingly investing in these solutions to foster employee collaboration, enhance client presentations, and create impactful first impressions. The demand for seamless video conferencing solutions and interactive whiteboards further fuels this segment.
Within the Types segment, LED display walls are emerging as a dominant force, capturing an estimated 45% market share by 2025, valued at around $4.5 billion. The superior brightness, contrast ratios, energy efficiency, and scalability of LED technology make them ideal for large-scale, high-impact installations, ranging from massive video billboards to sophisticated command and control centers. While LCD technology still holds a significant presence due to its cost-effectiveness and versatility, the rapid advancements and falling prices of LED panels are steadily tilting the scales in favor of LED.
Key drivers underpinning this dominance include:
- Economic Policies: Supportive government policies for technological adoption and digital transformation initiatives in North America.
- Infrastructure Development: Significant investments in smart infrastructure and commercial real estate development that incorporate advanced display solutions.
- Industry Trends: A strong emphasis on customer experience and employee productivity within the corporate sector, leading to increased demand for interactive solutions.
- Technological Advancements: Continuous improvements in LED and LCD display technology, leading to higher resolutions, better color reproduction, and increased interactivity.
- Market Penetration: High adoption rates in key verticals like retail, corporate, and entertainment, creating a strong installed base and ongoing demand.
The growth potential for these dominant regions and segments remains exceptionally high, with continued innovation and increasing awareness of the benefits offered by digital interactive display walls.
Digital Interactive Display Walls Product Landscape
The product landscape for digital interactive display walls is marked by continuous innovation aimed at enhancing user interaction and visual impact. Manufacturers are pushing the boundaries with ultra-high definition resolutions (4K and 8K), seamless bezel-less designs for expansive video walls, and advanced touch technologies that offer multi-user interactivity and precise responsiveness. Christie Digital System Inc. is renowned for its large-scale projection and LED display solutions, while Samsung and LG lead in advanced LCD and LED panel technology. Companies like MultiTaction and eyefactive GmbH focus on integrated software platforms that enable sophisticated content management, real-time data visualization, and collaborative functionalities. The integration of AI for personalized content delivery and analytics is a growing trend, offering unique selling propositions such as dynamic content adaptation based on viewer demographics or real-time environmental conditions. The performance metrics emphasize factors like brightness, contrast ratio, color accuracy, pixel pitch (for LED), and response time, all contributing to a more immersive and engaging visual experience.
Key Drivers, Barriers & Challenges in Digital Interactive Display Walls
Key Drivers:
- Technological Advancements: Continuous improvements in LED and LCD display technology, alongside enhanced touch capabilities and processing power, are making interactive display walls more versatile and accessible.
- Demand for Immersive Experiences: The growing desire across industries for engaging and interactive customer and employee experiences is a primary catalyst.
- Digital Transformation Initiatives: Businesses are increasingly investing in digital solutions to modernize operations, enhance brand visibility, and improve communication.
- Declining Component Costs: As manufacturing processes mature and economies of scale are realized, the cost of high-quality display components is decreasing, making these solutions more affordable.
Barriers & Challenges:
- High Initial Investment Costs: Despite declining prices, the initial outlay for large-scale interactive display walls can still be a significant barrier for small to medium-sized businesses.
- Content Creation and Management Complexity: Developing and managing dynamic, interactive content can be complex and require specialized expertise and software.
- Integration with Existing Systems: Seamless integration with existing IT infrastructure and software platforms can pose technical challenges.
- Supply Chain Disruptions: Global supply chain volatility can impact the availability and pricing of key components, affecting production timelines.
- Rapid Technological Obsolescence: The fast pace of technological advancement means that systems can become outdated relatively quickly, necessitating continuous investment.
Emerging Opportunities in Digital Interactive Display Walls
Emerging opportunities in the digital interactive display walls market lie in the burgeoning adoption within niche sectors and the integration of advanced AI capabilities. The Healthcare sector presents a significant untapped market, with potential applications in patient education, diagnostic visualization, and therapeutic environments. In Education, interactive display walls are poised to revolutionize classrooms and lecture halls, fostering collaborative learning and engaging students. Furthermore, the development of more sophisticated haptic feedback and gesture recognition technologies will unlock new levels of interactivity. The increasing demand for sustainable and energy-efficient display solutions also presents an opportunity for manufacturers to innovate with eco-friendly materials and power management systems. The rise of the metaverse and immersive digital experiences also hints at future applications where large-scale, interactive displays will play a crucial role in bridging the physical and digital realms.
Growth Accelerators in the Digital Interactive Display Walls Industry
Several catalysts are accelerating growth in the digital interactive display walls industry. The ongoing technological breakthroughs in microLED and OLED display technologies promise even higher resolutions, greater energy efficiency, and more flexible form factors, opening up new design possibilities. Strategic partnerships between display manufacturers, software developers, and content providers are crucial, creating integrated ecosystems that offer comprehensive solutions to end-users. Market expansion strategies, particularly targeting developing economies where digital adoption is rapidly increasing, will significantly drive future growth. The increasing focus on data analytics and personalization within business operations is also a key accelerator, as interactive display walls provide a powerful platform for collecting user data and delivering tailored experiences, thereby increasing their perceived value and ROI.
Key Players Shaping the Digital Interactive Display Walls Market
- Christie Digital System Inc.
- eyefactive GmbH
- Prestop B.V.
- IDEUM
- Intermedia Touch
- Planar
- Panasonic
- MultiTaction
- Pro Display
- Leyard Optoelectronic
- Samsung
- Microsoft
- SMART Technologies
- Promethean
- NEC Display Solutions
- BenQ
- ViewSonic
- Sharp Electronics
- Elo Touch Solutions
- Prowise
Notable Milestones in Digital Interactive Display Walls Sector
- 2019: Increased adoption of AI-powered analytics in interactive displays for personalized advertising and user engagement.
- 2020: Advancements in touchless interactive technologies gain traction due to public health concerns.
- 2021: Significant price reductions in high-resolution LED panels drive wider adoption for large-scale video walls.
- 2022: Microsoft announces new integration features for its Surface Hub devices, enhancing collaborative capabilities.
- 2023: Introduction of ultra-thin bezel LED displays for truly seamless video wall installations.
- 2024: Growing interest in microLED technology for its superior brightness, contrast, and energy efficiency.
In-Depth Digital Interactive Display Walls Market Outlook
The future outlook for the digital interactive display walls market is exceptionally promising, driven by continuous technological innovation and expanding application frontiers. Growth accelerators such as advancements in microLED technology, strategic ecosystem partnerships, and penetration into emerging markets will fuel sustained expansion. The increasing integration of AI and machine learning will transform these displays from passive visual tools into intelligent hubs for data interaction and personalized engagement. As costs continue to decline and user expectations for immersive experiences rise, digital interactive display walls are set to become an indispensable component of modern business, education, and public infrastructure, solidifying their position as a core technology for the next decade.
Digital Interactive Display Walls Segmentation
-
1. Application
- 1.1. Retail
- 1.2. Corporate
- 1.3. Transportation
- 1.4. Healthcare
- 1.5. Hospitality
- 1.6. Museum
- 1.7. Others
-
2. Types
- 2.1. LCD
- 2.2. LED
- 2.3. Others
Digital Interactive Display Walls Segmentation By Geography
-
1. North America
- 1.1. United States
- 1.2. Canada
- 1.3. Mexico
-
2. South America
- 2.1. Brazil
- 2.2. Argentina
- 2.3. Rest of South America
-
3. Europe
- 3.1. United Kingdom
- 3.2. Germany
- 3.3. France
- 3.4. Italy
- 3.5. Spain
- 3.6. Russia
- 3.7. Benelux
- 3.8. Nordics
- 3.9. Rest of Europe
-
4. Middle East & Africa
- 4.1. Turkey
- 4.2. Israel
- 4.3. GCC
- 4.4. North Africa
- 4.5. South Africa
- 4.6. Rest of Middle East & Africa
-
5. Asia Pacific
- 5.1. China
- 5.2. India
- 5.3. Japan
- 5.4. South Korea
- 5.5. ASEAN
- 5.6. Oceania
- 5.7. Rest of Asia Pacific
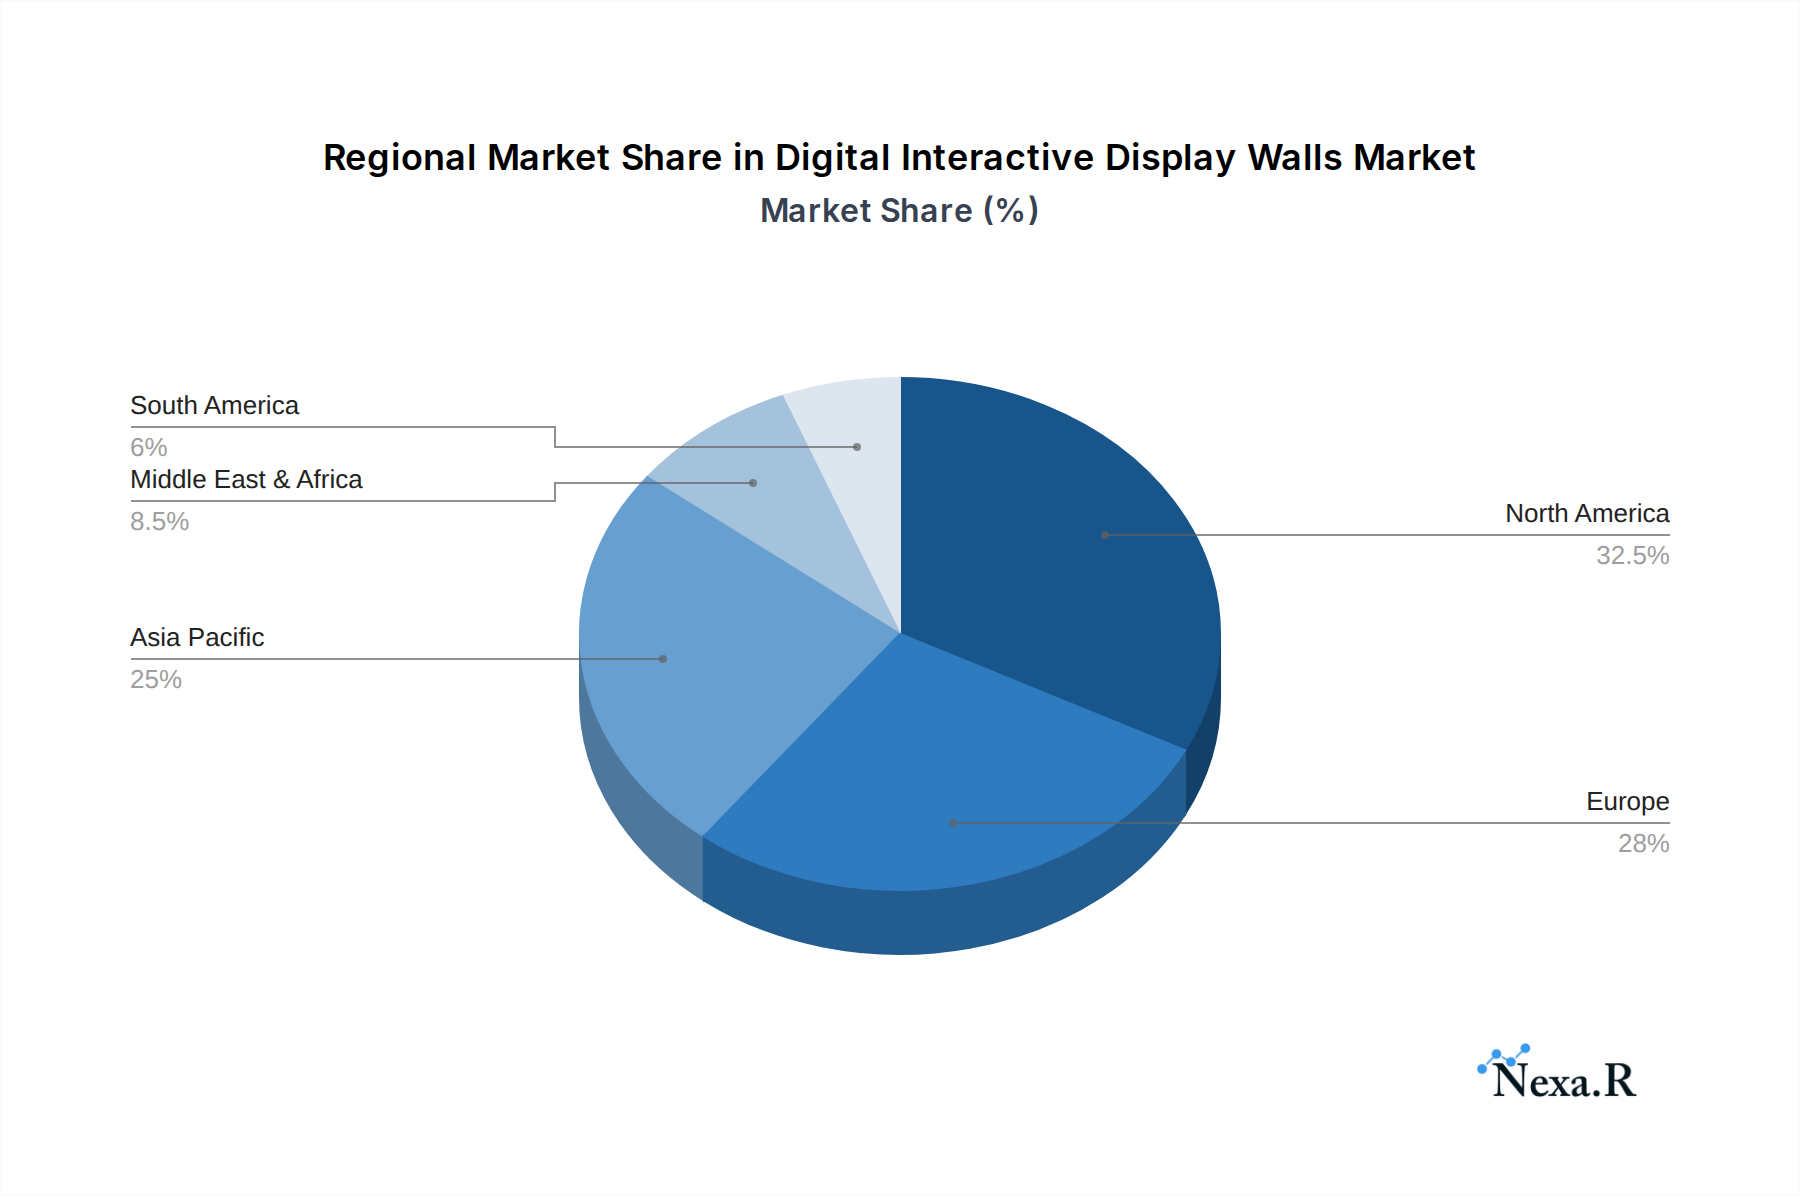
Digital Interactive Display Walls Regional Market Share
Geographic Coverage of Digital Interactive Display Walls
Digital Interactive Display Walls REPORT HIGHLIGHTS
| Aspects | Details |
|---|---|
| Study Period | 2020-2034 |
| Base Year | 2025 |
| Estimated Year | 2026 |
| Forecast Period | 2026-2034 |
| Historical Period | 2020-2025 |
| Growth Rate | CAGR of 8.09% from 2020-2034 |
| Segmentation |
|
Table of Contents
- 1. Introduction
- 1.1. Research Scope
- 1.2. Market Segmentation
- 1.3. Research Methodology
- 1.4. Definitions and Assumptions
- 2. Executive Summary
- 2.1. Introduction
- 3. Market Dynamics
- 3.1. Introduction
- 3.2. Market Drivers
- 3.3. Market Restrains
- 3.4. Market Trends
- 4. Market Factor Analysis
- 4.1. Porters Five Forces
- 4.2. Supply/Value Chain
- 4.3. PESTEL analysis
- 4.4. Market Entropy
- 4.5. Patent/Trademark Analysis
- 5. Global Digital Interactive Display Walls Analysis, Insights and Forecast, 2020-2032
- 5.1. Market Analysis, Insights and Forecast - by Application
- 5.1.1. Retail
- 5.1.2. Corporate
- 5.1.3. Transportation
- 5.1.4. Healthcare
- 5.1.5. Hospitality
- 5.1.6. Museum
- 5.1.7. Others
- 5.2. Market Analysis, Insights and Forecast - by Types
- 5.2.1. LCD
- 5.2.2. LED
- 5.2.3. Others
- 5.3. Market Analysis, Insights and Forecast - by Region
- 5.3.1. North America
- 5.3.2. South America
- 5.3.3. Europe
- 5.3.4. Middle East & Africa
- 5.3.5. Asia Pacific
- 5.1. Market Analysis, Insights and Forecast - by Application
- 6. North America Digital Interactive Display Walls Analysis, Insights and Forecast, 2020-2032
- 6.1. Market Analysis, Insights and Forecast - by Application
- 6.1.1. Retail
- 6.1.2. Corporate
- 6.1.3. Transportation
- 6.1.4. Healthcare
- 6.1.5. Hospitality
- 6.1.6. Museum
- 6.1.7. Others
- 6.2. Market Analysis, Insights and Forecast - by Types
- 6.2.1. LCD
- 6.2.2. LED
- 6.2.3. Others
- 6.1. Market Analysis, Insights and Forecast - by Application
- 7. South America Digital Interactive Display Walls Analysis, Insights and Forecast, 2020-2032
- 7.1. Market Analysis, Insights and Forecast - by Application
- 7.1.1. Retail
- 7.1.2. Corporate
- 7.1.3. Transportation
- 7.1.4. Healthcare
- 7.1.5. Hospitality
- 7.1.6. Museum
- 7.1.7. Others
- 7.2. Market Analysis, Insights and Forecast - by Types
- 7.2.1. LCD
- 7.2.2. LED
- 7.2.3. Others
- 7.1. Market Analysis, Insights and Forecast - by Application
- 8. Europe Digital Interactive Display Walls Analysis, Insights and Forecast, 2020-2032
- 8.1. Market Analysis, Insights and Forecast - by Application
- 8.1.1. Retail
- 8.1.2. Corporate
- 8.1.3. Transportation
- 8.1.4. Healthcare
- 8.1.5. Hospitality
- 8.1.6. Museum
- 8.1.7. Others
- 8.2. Market Analysis, Insights and Forecast - by Types
- 8.2.1. LCD
- 8.2.2. LED
- 8.2.3. Others
- 8.1. Market Analysis, Insights and Forecast - by Application
- 9. Middle East & Africa Digital Interactive Display Walls Analysis, Insights and Forecast, 2020-2032
- 9.1. Market Analysis, Insights and Forecast - by Application
- 9.1.1. Retail
- 9.1.2. Corporate
- 9.1.3. Transportation
- 9.1.4. Healthcare
- 9.1.5. Hospitality
- 9.1.6. Museum
- 9.1.7. Others
- 9.2. Market Analysis, Insights and Forecast - by Types
- 9.2.1. LCD
- 9.2.2. LED
- 9.2.3. Others
- 9.1. Market Analysis, Insights and Forecast - by Application
- 10. Asia Pacific Digital Interactive Display Walls Analysis, Insights and Forecast, 2020-2032
- 10.1. Market Analysis, Insights and Forecast - by Application
- 10.1.1. Retail
- 10.1.2. Corporate
- 10.1.3. Transportation
- 10.1.4. Healthcare
- 10.1.5. Hospitality
- 10.1.6. Museum
- 10.1.7. Others
- 10.2. Market Analysis, Insights and Forecast - by Types
- 10.2.1. LCD
- 10.2.2. LED
- 10.2.3. Others
- 10.1. Market Analysis, Insights and Forecast - by Application
- 11. Competitive Analysis
- 11.1. Global Market Share Analysis 2025
- 11.2. Company Profiles
- 11.2.1 Christie Digital System Inc.
- 11.2.1.1. Overview
- 11.2.1.2. Products
- 11.2.1.3. SWOT Analysis
- 11.2.1.4. Recent Developments
- 11.2.1.5. Financials (Based on Availability)
- 11.2.2 eyefactive GmbH
- 11.2.2.1. Overview
- 11.2.2.2. Products
- 11.2.2.3. SWOT Analysis
- 11.2.2.4. Recent Developments
- 11.2.2.5. Financials (Based on Availability)
- 11.2.3 Prestop B.V.
- 11.2.3.1. Overview
- 11.2.3.2. Products
- 11.2.3.3. SWOT Analysis
- 11.2.3.4. Recent Developments
- 11.2.3.5. Financials (Based on Availability)
- 11.2.4 IDEUM
- 11.2.4.1. Overview
- 11.2.4.2. Products
- 11.2.4.3. SWOT Analysis
- 11.2.4.4. Recent Developments
- 11.2.4.5. Financials (Based on Availability)
- 11.2.5 Intermedia Touch
- 11.2.5.1. Overview
- 11.2.5.2. Products
- 11.2.5.3. SWOT Analysis
- 11.2.5.4. Recent Developments
- 11.2.5.5. Financials (Based on Availability)
- 11.2.6 Planar
- 11.2.6.1. Overview
- 11.2.6.2. Products
- 11.2.6.3. SWOT Analysis
- 11.2.6.4. Recent Developments
- 11.2.6.5. Financials (Based on Availability)
- 11.2.7 Panasonic
- 11.2.7.1. Overview
- 11.2.7.2. Products
- 11.2.7.3. SWOT Analysis
- 11.2.7.4. Recent Developments
- 11.2.7.5. Financials (Based on Availability)
- 11.2.8 MultiTaction
- 11.2.8.1. Overview
- 11.2.8.2. Products
- 11.2.8.3. SWOT Analysis
- 11.2.8.4. Recent Developments
- 11.2.8.5. Financials (Based on Availability)
- 11.2.9 Pro Display
- 11.2.9.1. Overview
- 11.2.9.2. Products
- 11.2.9.3. SWOT Analysis
- 11.2.9.4. Recent Developments
- 11.2.9.5. Financials (Based on Availability)
- 11.2.10 Leyard Optoelectronic
- 11.2.10.1. Overview
- 11.2.10.2. Products
- 11.2.10.3. SWOT Analysis
- 11.2.10.4. Recent Developments
- 11.2.10.5. Financials (Based on Availability)
- 11.2.11 Samsung
- 11.2.11.1. Overview
- 11.2.11.2. Products
- 11.2.11.3. SWOT Analysis
- 11.2.11.4. Recent Developments
- 11.2.11.5. Financials (Based on Availability)
- 11.2.12 Microsoft
- 11.2.12.1. Overview
- 11.2.12.2. Products
- 11.2.12.3. SWOT Analysis
- 11.2.12.4. Recent Developments
- 11.2.12.5. Financials (Based on Availability)
- 11.2.13 SMART Technologies
- 11.2.13.1. Overview
- 11.2.13.2. Products
- 11.2.13.3. SWOT Analysis
- 11.2.13.4. Recent Developments
- 11.2.13.5. Financials (Based on Availability)
- 11.2.14 Promethean
- 11.2.14.1. Overview
- 11.2.14.2. Products
- 11.2.14.3. SWOT Analysis
- 11.2.14.4. Recent Developments
- 11.2.14.5. Financials (Based on Availability)
- 11.2.15 NEC Display Solutions
- 11.2.15.1. Overview
- 11.2.15.2. Products
- 11.2.15.3. SWOT Analysis
- 11.2.15.4. Recent Developments
- 11.2.15.5. Financials (Based on Availability)
- 11.2.16 BenQ
- 11.2.16.1. Overview
- 11.2.16.2. Products
- 11.2.16.3. SWOT Analysis
- 11.2.16.4. Recent Developments
- 11.2.16.5. Financials (Based on Availability)
- 11.2.17 ViewSonic
- 11.2.17.1. Overview
- 11.2.17.2. Products
- 11.2.17.3. SWOT Analysis
- 11.2.17.4. Recent Developments
- 11.2.17.5. Financials (Based on Availability)
- 11.2.18 Sharp Electronics
- 11.2.18.1. Overview
- 11.2.18.2. Products
- 11.2.18.3. SWOT Analysis
- 11.2.18.4. Recent Developments
- 11.2.18.5. Financials (Based on Availability)
- 11.2.19 Elo Touch Solutions
- 11.2.19.1. Overview
- 11.2.19.2. Products
- 11.2.19.3. SWOT Analysis
- 11.2.19.4. Recent Developments
- 11.2.19.5. Financials (Based on Availability)
- 11.2.20 Prowise
- 11.2.20.1. Overview
- 11.2.20.2. Products
- 11.2.20.3. SWOT Analysis
- 11.2.20.4. Recent Developments
- 11.2.20.5. Financials (Based on Availability)
- 11.2.1 Christie Digital System Inc.
List of Figures
- Figure 1: Global Digital Interactive Display Walls Revenue Breakdown (billion, %) by Region 2025 & 2033
- Figure 2: North America Digital Interactive Display Walls Revenue (billion), by Application 2025 & 2033
- Figure 3: North America Digital Interactive Display Walls Revenue Share (%), by Application 2025 & 2033
- Figure 4: North America Digital Interactive Display Walls Revenue (billion), by Types 2025 & 2033
- Figure 5: North America Digital Interactive Display Walls Revenue Share (%), by Types 2025 & 2033
- Figure 6: North America Digital Interactive Display Walls Revenue (billion), by Country 2025 & 2033
- Figure 7: North America Digital Interactive Display Walls Revenue Share (%), by Country 2025 & 2033
- Figure 8: South America Digital Interactive Display Walls Revenue (billion), by Application 2025 & 2033
- Figure 9: South America Digital Interactive Display Walls Revenue Share (%), by Application 2025 & 2033
- Figure 10: South America Digital Interactive Display Walls Revenue (billion), by Types 2025 & 2033
- Figure 11: South America Digital Interactive Display Walls Revenue Share (%), by Types 2025 & 2033
- Figure 12: South America Digital Interactive Display Walls Revenue (billion), by Country 2025 & 2033
- Figure 13: South America Digital Interactive Display Walls Revenue Share (%), by Country 2025 & 2033
- Figure 14: Europe Digital Interactive Display Walls Revenue (billion), by Application 2025 & 2033
- Figure 15: Europe Digital Interactive Display Walls Revenue Share (%), by Application 2025 & 2033
- Figure 16: Europe Digital Interactive Display Walls Revenue (billion), by Types 2025 & 2033
- Figure 17: Europe Digital Interactive Display Walls Revenue Share (%), by Types 2025 & 2033
- Figure 18: Europe Digital Interactive Display Walls Revenue (billion), by Country 2025 & 2033
- Figure 19: Europe Digital Interactive Display Walls Revenue Share (%), by Country 2025 & 2033
- Figure 20: Middle East & Africa Digital Interactive Display Walls Revenue (billion), by Application 2025 & 2033
- Figure 21: Middle East & Africa Digital Interactive Display Walls Revenue Share (%), by Application 2025 & 2033
- Figure 22: Middle East & Africa Digital Interactive Display Walls Revenue (billion), by Types 2025 & 2033
- Figure 23: Middle East & Africa Digital Interactive Display Walls Revenue Share (%), by Types 2025 & 2033
- Figure 24: Middle East & Africa Digital Interactive Display Walls Revenue (billion), by Country 2025 & 2033
- Figure 25: Middle East & Africa Digital Interactive Display Walls Revenue Share (%), by Country 2025 & 2033
- Figure 26: Asia Pacific Digital Interactive Display Walls Revenue (billion), by Application 2025 & 2033
- Figure 27: Asia Pacific Digital Interactive Display Walls Revenue Share (%), by Application 2025 & 2033
- Figure 28: Asia Pacific Digital Interactive Display Walls Revenue (billion), by Types 2025 & 2033
- Figure 29: Asia Pacific Digital Interactive Display Walls Revenue Share (%), by Types 2025 & 2033
- Figure 30: Asia Pacific Digital Interactive Display Walls Revenue (billion), by Country 2025 & 2033
- Figure 31: Asia Pacific Digital Interactive Display Walls Revenue Share (%), by Country 2025 & 2033
List of Tables
- Table 1: Global Digital Interactive Display Walls Revenue billion Forecast, by Application 2020 & 2033
- Table 2: Global Digital Interactive Display Walls Revenue billion Forecast, by Types 2020 & 2033
- Table 3: Global Digital Interactive Display Walls Revenue billion Forecast, by Region 2020 & 2033
- Table 4: Global Digital Interactive Display Walls Revenue billion Forecast, by Application 2020 & 2033
- Table 5: Global Digital Interactive Display Walls Revenue billion Forecast, by Types 2020 & 2033
- Table 6: Global Digital Interactive Display Walls Revenue billion Forecast, by Country 2020 & 2033
- Table 7: United States Digital Interactive Display Walls Revenue (billion) Forecast, by Application 2020 & 2033
- Table 8: Canada Digital Interactive Display Walls Revenue (billion) Forecast, by Application 2020 & 2033
- Table 9: Mexico Digital Interactive Display Walls Revenue (billion) Forecast, by Application 2020 & 2033
- Table 10: Global Digital Interactive Display Walls Revenue billion Forecast, by Application 2020 & 2033
- Table 11: Global Digital Interactive Display Walls Revenue billion Forecast, by Types 2020 & 2033
- Table 12: Global Digital Interactive Display Walls Revenue billion Forecast, by Country 2020 & 2033
- Table 13: Brazil Digital Interactive Display Walls Revenue (billion) Forecast, by Application 2020 & 2033
- Table 14: Argentina Digital Interactive Display Walls Revenue (billion) Forecast, by Application 2020 & 2033
- Table 15: Rest of South America Digital Interactive Display Walls Revenue (billion) Forecast, by Application 2020 & 2033
- Table 16: Global Digital Interactive Display Walls Revenue billion Forecast, by Application 2020 & 2033
- Table 17: Global Digital Interactive Display Walls Revenue billion Forecast, by Types 2020 & 2033
- Table 18: Global Digital Interactive Display Walls Revenue billion Forecast, by Country 2020 & 2033
- Table 19: United Kingdom Digital Interactive Display Walls Revenue (billion) Forecast, by Application 2020 & 2033
- Table 20: Germany Digital Interactive Display Walls Revenue (billion) Forecast, by Application 2020 & 2033
- Table 21: France Digital Interactive Display Walls Revenue (billion) Forecast, by Application 2020 & 2033
- Table 22: Italy Digital Interactive Display Walls Revenue (billion) Forecast, by Application 2020 & 2033
- Table 23: Spain Digital Interactive Display Walls Revenue (billion) Forecast, by Application 2020 & 2033
- Table 24: Russia Digital Interactive Display Walls Revenue (billion) Forecast, by Application 2020 & 2033
- Table 25: Benelux Digital Interactive Display Walls Revenue (billion) Forecast, by Application 2020 & 2033
- Table 26: Nordics Digital Interactive Display Walls Revenue (billion) Forecast, by Application 2020 & 2033
- Table 27: Rest of Europe Digital Interactive Display Walls Revenue (billion) Forecast, by Application 2020 & 2033
- Table 28: Global Digital Interactive Display Walls Revenue billion Forecast, by Application 2020 & 2033
- Table 29: Global Digital Interactive Display Walls Revenue billion Forecast, by Types 2020 & 2033
- Table 30: Global Digital Interactive Display Walls Revenue billion Forecast, by Country 2020 & 2033
- Table 31: Turkey Digital Interactive Display Walls Revenue (billion) Forecast, by Application 2020 & 2033
- Table 32: Israel Digital Interactive Display Walls Revenue (billion) Forecast, by Application 2020 & 2033
- Table 33: GCC Digital Interactive Display Walls Revenue (billion) Forecast, by Application 2020 & 2033
- Table 34: North Africa Digital Interactive Display Walls Revenue (billion) Forecast, by Application 2020 & 2033
- Table 35: South Africa Digital Interactive Display Walls Revenue (billion) Forecast, by Application 2020 & 2033
- Table 36: Rest of Middle East & Africa Digital Interactive Display Walls Revenue (billion) Forecast, by Application 2020 & 2033
- Table 37: Global Digital Interactive Display Walls Revenue billion Forecast, by Application 2020 & 2033
- Table 38: Global Digital Interactive Display Walls Revenue billion Forecast, by Types 2020 & 2033
- Table 39: Global Digital Interactive Display Walls Revenue billion Forecast, by Country 2020 & 2033
- Table 40: China Digital Interactive Display Walls Revenue (billion) Forecast, by Application 2020 & 2033
- Table 41: India Digital Interactive Display Walls Revenue (billion) Forecast, by Application 2020 & 2033
- Table 42: Japan Digital Interactive Display Walls Revenue (billion) Forecast, by Application 2020 & 2033
- Table 43: South Korea Digital Interactive Display Walls Revenue (billion) Forecast, by Application 2020 & 2033
- Table 44: ASEAN Digital Interactive Display Walls Revenue (billion) Forecast, by Application 2020 & 2033
- Table 45: Oceania Digital Interactive Display Walls Revenue (billion) Forecast, by Application 2020 & 2033
- Table 46: Rest of Asia Pacific Digital Interactive Display Walls Revenue (billion) Forecast, by Application 2020 & 2033
Frequently Asked Questions
1. What is the projected Compound Annual Growth Rate (CAGR) of the Digital Interactive Display Walls?
The projected CAGR is approximately 8.09%.
2. Which companies are prominent players in the Digital Interactive Display Walls?
Key companies in the market include Christie Digital System Inc., eyefactive GmbH, Prestop B.V., IDEUM, Intermedia Touch, Planar, Panasonic, MultiTaction, Pro Display, Leyard Optoelectronic, Samsung, Microsoft, SMART Technologies, Promethean, NEC Display Solutions, BenQ, ViewSonic, Sharp Electronics, Elo Touch Solutions, Prowise.
3. What are the main segments of the Digital Interactive Display Walls?
The market segments include Application, Types.
4. Can you provide details about the market size?
The market size is estimated to be USD 48.29 billion as of 2022.
5. What are some drivers contributing to market growth?
N/A
6. What are the notable trends driving market growth?
N/A
7. Are there any restraints impacting market growth?
N/A
8. Can you provide examples of recent developments in the market?
N/A
9. What pricing options are available for accessing the report?
Pricing options include single-user, multi-user, and enterprise licenses priced at USD 4900.00, USD 7350.00, and USD 9800.00 respectively.
10. Is the market size provided in terms of value or volume?
The market size is provided in terms of value, measured in billion.
11. Are there any specific market keywords associated with the report?
Yes, the market keyword associated with the report is "Digital Interactive Display Walls," which aids in identifying and referencing the specific market segment covered.
12. How do I determine which pricing option suits my needs best?
The pricing options vary based on user requirements and access needs. Individual users may opt for single-user licenses, while businesses requiring broader access may choose multi-user or enterprise licenses for cost-effective access to the report.
13. Are there any additional resources or data provided in the Digital Interactive Display Walls report?
While the report offers comprehensive insights, it's advisable to review the specific contents or supplementary materials provided to ascertain if additional resources or data are available.
14. How can I stay updated on further developments or reports in the Digital Interactive Display Walls?
To stay informed about further developments, trends, and reports in the Digital Interactive Display Walls, consider subscribing to industry newsletters, following relevant companies and organizations, or regularly checking reputable industry news sources and publications.
Methodology
Step 1 - Identification of Relevant Samples Size from Population Database


Step 2 - Approaches for Defining Global Market Size (Value, Volume* & Price*)

Note*: In applicable scenarios
Step 3 - Data Sources
Primary Research
- Web Analytics
- Survey Reports
- Research Institute
- Latest Research Reports
- Opinion Leaders
Secondary Research
- Annual Reports
- White Paper
- Latest Press Release
- Industry Association
- Paid Database
- Investor Presentations

Step 4 - Data Triangulation
Involves using different sources of information in order to increase the validity of a study
These sources are likely to be stakeholders in a program - participants, other researchers, program staff, other community members, and so on.
Then we put all data in single framework & apply various statistical tools to find out the dynamic on the market.
During the analysis stage, feedback from the stakeholder groups would be compared to determine areas of agreement as well as areas of divergence