

Key Insights
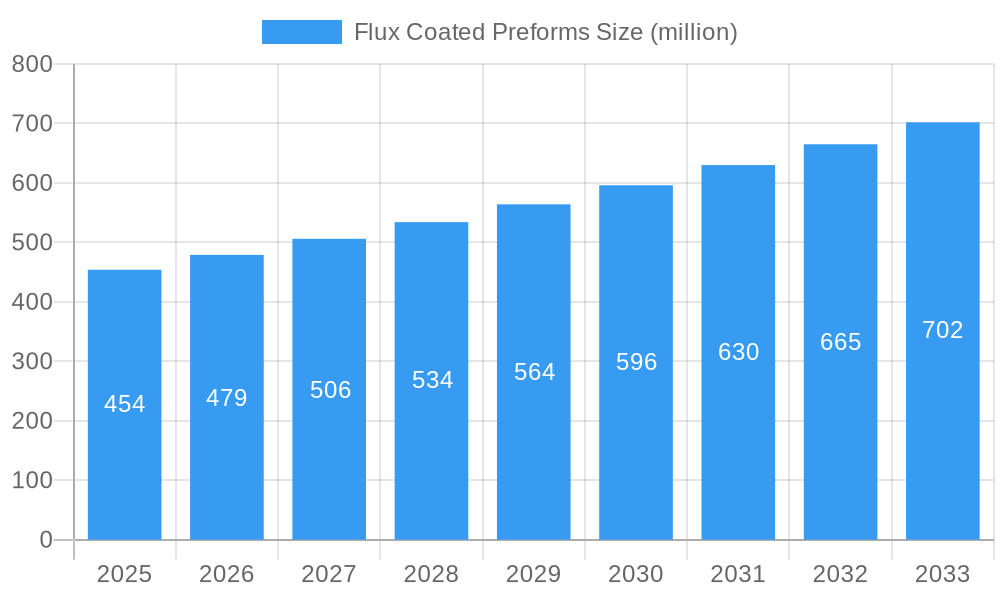
The global flux-coated preforms market, valued at $454 million in 2025, is projected to experience robust growth, driven by the increasing demand for advanced electronics and miniaturization in various industries. The compound annual growth rate (CAGR) of 5.2% from 2025 to 2033 indicates a steady expansion, fueled by several key factors. The rising adoption of surface mount technology (SMT) in consumer electronics, automotive, and aerospace sectors significantly contributes to market growth. Furthermore, the increasing demand for high-reliability soldering solutions in critical applications, along with ongoing technological advancements in preform design and flux formulations leading to improved solder joint quality and reduced production costs, are bolstering market expansion. Stringent regulatory compliance regarding lead-free soldering further fuels the demand for high-quality flux-coated preforms. Competitive pressures among manufacturers are also driving innovation, resulting in new product offerings and improved performance characteristics.
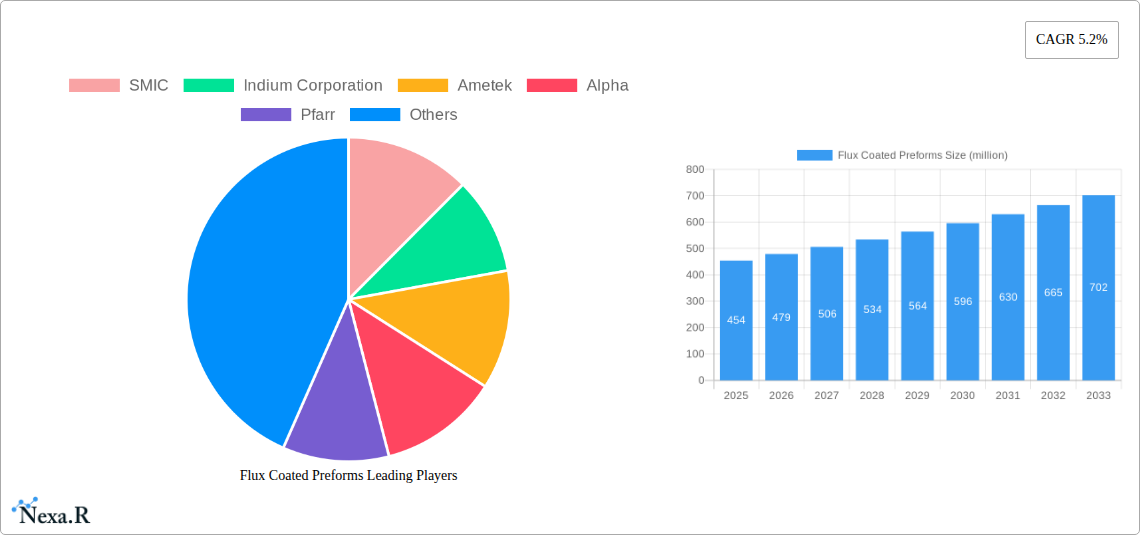
Flux Coated Preforms Market Size (In Million)
However, potential market restraints include fluctuations in raw material prices, particularly for metals like tin and lead, which can impact production costs and profitability. Geopolitical uncertainties and supply chain disruptions can also pose challenges to market growth. Despite these challenges, the long-term outlook for flux-coated preforms remains positive, driven by continuous technological advancements, the growing electronics industry, and the increasing need for reliable and efficient soldering solutions across various sectors. Key players, including SMIC, Indium Corporation, Ametek, and others, are strategically investing in research and development to enhance product offerings and expand their market share. Segmentation within the market likely includes variations based on preform type, flux composition, and target application, although details are not provided here.
Flux Coated Preforms Company Market Share
Flux Coated Preforms Market Report: 2019-2033
This comprehensive report provides an in-depth analysis of the Flux Coated Preforms market, encompassing market dynamics, growth trends, regional dominance, product landscape, key players, and future outlook. The study period covers 2019-2033, with 2025 as the base and estimated year. This report is crucial for industry professionals, investors, and strategists seeking a clear understanding of this dynamic market segment within the broader electronics and semiconductor industries (parent market) and specifically targeting the soldering and assembly applications (child market).
Flux Coated Preforms Market Dynamics & Structure
This section analyzes the market structure, highlighting competitive intensity, technological advancements, and regulatory influences shaping the Flux Coated Preforms landscape. The report quantifies market concentration, revealing the market share held by major players such as SMIC, Indium Corporation, Ametek, Alpha, Pfarr, Harris Products, AIM, Zhejiang YaTong Advanced Materials, Solderwell Advanced Materials, Fromosol, Guangdong Zhongshi Metal Co, and Shenmao. We delve into the impact of mergers and acquisitions (M&A) activity, estimating a total of xx million USD in deals during the historical period (2019-2024). Innovation barriers, including material sourcing constraints and stringent quality standards, are thoroughly examined.
- Market Concentration: The market exhibits a moderately concentrated structure, with the top 5 players holding approximately xx% market share in 2025.
- Technological Innovation: Ongoing R&D focuses on improving flux performance, reducing environmental impact, and enhancing compatibility with advanced materials.
- Regulatory Framework: Compliance with RoHS and REACH regulations significantly impacts material selection and manufacturing processes.
- Competitive Substitutes: Alternative soldering technologies and materials present a competitive challenge.
- End-User Demographics: The primary end-users are electronics manufacturers across various sectors, including consumer electronics, automotive, and industrial automation.
- M&A Trends: Consolidation is anticipated to continue, driven by the need to achieve economies of scale and expand product portfolios.
Flux Coated Preforms Growth Trends & Insights
This section provides a detailed analysis of the Flux Coated Preforms market size evolution from 2019 to 2033. Using proprietary data and market analysis techniques, we project a Compound Annual Growth Rate (CAGR) of xx% during the forecast period (2025-2033), reaching a market value of xx million units by 2033. The report examines factors driving adoption rates, including the increasing demand for miniaturized electronics and the need for high-reliability soldering solutions. Technological advancements, like the introduction of lead-free fluxes, are also analyzed for their impact on market growth. The evolving consumer preference for eco-friendly electronics impacts the market, with a projected xx% market penetration of eco-friendly flux coated preforms by 2033.
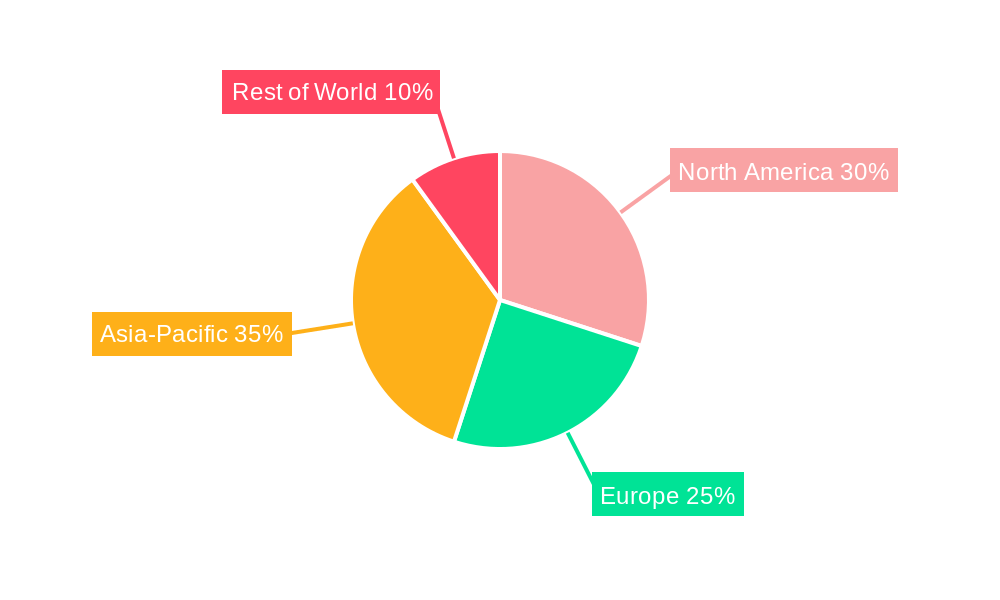
Dominant Regions, Countries, or Segments in Flux Coated Preforms
This section identifies the leading regions and segments driving market growth. Asia-Pacific is projected to be the dominant region, holding approximately xx% of the global market share in 2025, fuelled by a robust electronics manufacturing sector. North America and Europe also contribute significantly, with market shares of xx% and xx%, respectively. The report analyzes factors underpinning regional dominance, focusing on aspects like economic policies, investment in infrastructure, and the density of electronics manufacturing facilities.
- Key Drivers in Asia-Pacific: Rapid growth of electronics manufacturing, government incentives, and a large pool of skilled labor.
- Key Drivers in North America: Strong demand from the automotive and aerospace sectors, coupled with technological advancements.
- Key Drivers in Europe: Focus on sustainable manufacturing practices and stringent environmental regulations.
Flux Coated Preforms Product Landscape
Flux coated preforms are designed to simplify and improve soldering processes. Recent innovations focus on enhancing flux activity, improving wetting characteristics, and minimizing residue. Applications span diverse sectors, including consumer electronics, automotive electronics, and industrial control systems. Key performance metrics include flux activity, residue level, and compatibility with various soldering techniques. Unique selling propositions include improved process efficiency, enhanced joint reliability, and reduced environmental impact. The advancements in flux chemistry and preform design continually lead to higher-quality soldering connections.
Key Drivers, Barriers & Challenges in Flux Coated Preforms
Key Drivers:
- Increasing demand for miniaturized electronic devices.
- Adoption of lead-free soldering technologies.
- Growth in the automotive and industrial electronics sectors.
Challenges & Restraints:
- Fluctuations in raw material prices, impacting profitability. (Estimated impact: xx% on production costs in 2025).
- Stringent environmental regulations, requiring compliance investments. (Estimated investment needed: xx million USD annually by 2030).
- Intense competition from existing and new market entrants.
Emerging Opportunities in Flux Coated Preforms
Emerging opportunities lie in:
- Expanding into untapped markets in developing economies.
- Development of specialized fluxes for high-temperature applications.
- Leveraging advancements in materials science for improved flux performance.
Growth Accelerators in the Flux Coated Preforms Industry
Long-term growth is accelerated by:
Technological breakthroughs in flux chemistry and preform design. Strategic partnerships to expand market reach and product offerings. Expansion into new applications, such as 5G infrastructure and electric vehicles.
Key Players Shaping the Flux Coated Preforms Market
- SMIC
- Indium Corporation
- Ametek
- Alpha
- Pfarr
- Harris Products
- AIM
- Zhejiang YaTong Advanced Materials
- Solderwell Advanced Materials
- Fromosol
- Guangdong Zhongshi Metal Co
- Shenmao
Notable Milestones in Flux Coated Preforms Sector
- 2021: Introduction of a new eco-friendly flux by Indium Corporation.
- 2022: Strategic partnership between Ametek and a leading electronics manufacturer.
- 2023: Launch of a high-temperature flux coated preform by Solderwell.
In-Depth Flux Coated Preforms Market Outlook
The Flux Coated Preforms market is poised for continued growth, driven by increasing demand from key industries. Strategic opportunities include focusing on innovation, expanding into new applications, and forging strategic alliances. The market's future potential is substantial, with a projected market value exceeding xx million units by 2033. Continued technological advancements and the rise of innovative manufacturing techniques will further shape the sector's growth trajectory.
Flux Coated Preforms Segmentation
-
1. Application
- 1.1. Electronics and Semiconductor
- 1.2. Military and Aerospace
- 1.3. Medical
- 1.4. Others
-
2. Type
- 2.1. Active Flux
- 2.2. Inactive Flux
Flux Coated Preforms Segmentation By Geography
-
1. North America
- 1.1. United States
- 1.2. Canada
- 1.3. Mexico
-
2. South America
- 2.1. Brazil
- 2.2. Argentina
- 2.3. Rest of South America
-
3. Europe
- 3.1. United Kingdom
- 3.2. Germany
- 3.3. France
- 3.4. Italy
- 3.5. Spain
- 3.6. Russia
- 3.7. Benelux
- 3.8. Nordics
- 3.9. Rest of Europe
-
4. Middle East & Africa
- 4.1. Turkey
- 4.2. Israel
- 4.3. GCC
- 4.4. North Africa
- 4.5. South Africa
- 4.6. Rest of Middle East & Africa
-
5. Asia Pacific
- 5.1. China
- 5.2. India
- 5.3. Japan
- 5.4. South Korea
- 5.5. ASEAN
- 5.6. Oceania
- 5.7. Rest of Asia Pacific
Flux Coated Preforms Regional Market Share
Geographic Coverage of Flux Coated Preforms
Flux Coated Preforms REPORT HIGHLIGHTS
| Aspects | Details |
|---|---|
| Study Period | 2020-2034 |
| Base Year | 2025 |
| Estimated Year | 2026 |
| Forecast Period | 2026-2034 |
| Historical Period | 2020-2025 |
| Growth Rate | CAGR of 5.2% from 2020-2034 |
| Segmentation |
|
Table of Contents
- 1. Introduction
- 1.1. Research Scope
- 1.2. Market Segmentation
- 1.3. Research Methodology
- 1.4. Definitions and Assumptions
- 2. Executive Summary
- 2.1. Introduction
- 3. Market Dynamics
- 3.1. Introduction
- 3.2. Market Drivers
- 3.3. Market Restrains
- 3.4. Market Trends
- 4. Market Factor Analysis
- 4.1. Porters Five Forces
- 4.2. Supply/Value Chain
- 4.3. PESTEL analysis
- 4.4. Market Entropy
- 4.5. Patent/Trademark Analysis
- 5. Global Flux Coated Preforms Analysis, Insights and Forecast, 2020-2032
- 5.1. Market Analysis, Insights and Forecast - by Application
- 5.1.1. Electronics and Semiconductor
- 5.1.2. Military and Aerospace
- 5.1.3. Medical
- 5.1.4. Others
- 5.2. Market Analysis, Insights and Forecast - by Type
- 5.2.1. Active Flux
- 5.2.2. Inactive Flux
- 5.3. Market Analysis, Insights and Forecast - by Region
- 5.3.1. North America
- 5.3.2. South America
- 5.3.3. Europe
- 5.3.4. Middle East & Africa
- 5.3.5. Asia Pacific
- 5.1. Market Analysis, Insights and Forecast - by Application
- 6. North America Flux Coated Preforms Analysis, Insights and Forecast, 2020-2032
- 6.1. Market Analysis, Insights and Forecast - by Application
- 6.1.1. Electronics and Semiconductor
- 6.1.2. Military and Aerospace
- 6.1.3. Medical
- 6.1.4. Others
- 6.2. Market Analysis, Insights and Forecast - by Type
- 6.2.1. Active Flux
- 6.2.2. Inactive Flux
- 6.1. Market Analysis, Insights and Forecast - by Application
- 7. South America Flux Coated Preforms Analysis, Insights and Forecast, 2020-2032
- 7.1. Market Analysis, Insights and Forecast - by Application
- 7.1.1. Electronics and Semiconductor
- 7.1.2. Military and Aerospace
- 7.1.3. Medical
- 7.1.4. Others
- 7.2. Market Analysis, Insights and Forecast - by Type
- 7.2.1. Active Flux
- 7.2.2. Inactive Flux
- 7.1. Market Analysis, Insights and Forecast - by Application
- 8. Europe Flux Coated Preforms Analysis, Insights and Forecast, 2020-2032
- 8.1. Market Analysis, Insights and Forecast - by Application
- 8.1.1. Electronics and Semiconductor
- 8.1.2. Military and Aerospace
- 8.1.3. Medical
- 8.1.4. Others
- 8.2. Market Analysis, Insights and Forecast - by Type
- 8.2.1. Active Flux
- 8.2.2. Inactive Flux
- 8.1. Market Analysis, Insights and Forecast - by Application
- 9. Middle East & Africa Flux Coated Preforms Analysis, Insights and Forecast, 2020-2032
- 9.1. Market Analysis, Insights and Forecast - by Application
- 9.1.1. Electronics and Semiconductor
- 9.1.2. Military and Aerospace
- 9.1.3. Medical
- 9.1.4. Others
- 9.2. Market Analysis, Insights and Forecast - by Type
- 9.2.1. Active Flux
- 9.2.2. Inactive Flux
- 9.1. Market Analysis, Insights and Forecast - by Application
- 10. Asia Pacific Flux Coated Preforms Analysis, Insights and Forecast, 2020-2032
- 10.1. Market Analysis, Insights and Forecast - by Application
- 10.1.1. Electronics and Semiconductor
- 10.1.2. Military and Aerospace
- 10.1.3. Medical
- 10.1.4. Others
- 10.2. Market Analysis, Insights and Forecast - by Type
- 10.2.1. Active Flux
- 10.2.2. Inactive Flux
- 10.1. Market Analysis, Insights and Forecast - by Application
- 11. Competitive Analysis
- 11.1. Global Market Share Analysis 2025
- 11.2. Company Profiles
- 11.2.1 SMIC
- 11.2.1.1. Overview
- 11.2.1.2. Products
- 11.2.1.3. SWOT Analysis
- 11.2.1.4. Recent Developments
- 11.2.1.5. Financials (Based on Availability)
- 11.2.2 Indium Corporation
- 11.2.2.1. Overview
- 11.2.2.2. Products
- 11.2.2.3. SWOT Analysis
- 11.2.2.4. Recent Developments
- 11.2.2.5. Financials (Based on Availability)
- 11.2.3 Ametek
- 11.2.3.1. Overview
- 11.2.3.2. Products
- 11.2.3.3. SWOT Analysis
- 11.2.3.4. Recent Developments
- 11.2.3.5. Financials (Based on Availability)
- 11.2.4 Alpha
- 11.2.4.1. Overview
- 11.2.4.2. Products
- 11.2.4.3. SWOT Analysis
- 11.2.4.4. Recent Developments
- 11.2.4.5. Financials (Based on Availability)
- 11.2.5 Pfarr
- 11.2.5.1. Overview
- 11.2.5.2. Products
- 11.2.5.3. SWOT Analysis
- 11.2.5.4. Recent Developments
- 11.2.5.5. Financials (Based on Availability)
- 11.2.6 Harris Products
- 11.2.6.1. Overview
- 11.2.6.2. Products
- 11.2.6.3. SWOT Analysis
- 11.2.6.4. Recent Developments
- 11.2.6.5. Financials (Based on Availability)
- 11.2.7 AIM
- 11.2.7.1. Overview
- 11.2.7.2. Products
- 11.2.7.3. SWOT Analysis
- 11.2.7.4. Recent Developments
- 11.2.7.5. Financials (Based on Availability)
- 11.2.8 Zhejiang YaTong Advanced Materials
- 11.2.8.1. Overview
- 11.2.8.2. Products
- 11.2.8.3. SWOT Analysis
- 11.2.8.4. Recent Developments
- 11.2.8.5. Financials (Based on Availability)
- 11.2.9 Solderwell Advanced Materials
- 11.2.9.1. Overview
- 11.2.9.2. Products
- 11.2.9.3. SWOT Analysis
- 11.2.9.4. Recent Developments
- 11.2.9.5. Financials (Based on Availability)
- 11.2.10 Fromosol
- 11.2.10.1. Overview
- 11.2.10.2. Products
- 11.2.10.3. SWOT Analysis
- 11.2.10.4. Recent Developments
- 11.2.10.5. Financials (Based on Availability)
- 11.2.11 Guangdong Zhongshi Metal Co
- 11.2.11.1. Overview
- 11.2.11.2. Products
- 11.2.11.3. SWOT Analysis
- 11.2.11.4. Recent Developments
- 11.2.11.5. Financials (Based on Availability)
- 11.2.12 Shenmao
- 11.2.12.1. Overview
- 11.2.12.2. Products
- 11.2.12.3. SWOT Analysis
- 11.2.12.4. Recent Developments
- 11.2.12.5. Financials (Based on Availability)
- 11.2.1 SMIC
List of Figures
- Figure 1: Global Flux Coated Preforms Revenue Breakdown (million, %) by Region 2025 & 2033
- Figure 2: Global Flux Coated Preforms Volume Breakdown (K, %) by Region 2025 & 2033
- Figure 3: North America Flux Coated Preforms Revenue (million), by Application 2025 & 2033
- Figure 4: North America Flux Coated Preforms Volume (K), by Application 2025 & 2033
- Figure 5: North America Flux Coated Preforms Revenue Share (%), by Application 2025 & 2033
- Figure 6: North America Flux Coated Preforms Volume Share (%), by Application 2025 & 2033
- Figure 7: North America Flux Coated Preforms Revenue (million), by Type 2025 & 2033
- Figure 8: North America Flux Coated Preforms Volume (K), by Type 2025 & 2033
- Figure 9: North America Flux Coated Preforms Revenue Share (%), by Type 2025 & 2033
- Figure 10: North America Flux Coated Preforms Volume Share (%), by Type 2025 & 2033
- Figure 11: North America Flux Coated Preforms Revenue (million), by Country 2025 & 2033
- Figure 12: North America Flux Coated Preforms Volume (K), by Country 2025 & 2033
- Figure 13: North America Flux Coated Preforms Revenue Share (%), by Country 2025 & 2033
- Figure 14: North America Flux Coated Preforms Volume Share (%), by Country 2025 & 2033
- Figure 15: South America Flux Coated Preforms Revenue (million), by Application 2025 & 2033
- Figure 16: South America Flux Coated Preforms Volume (K), by Application 2025 & 2033
- Figure 17: South America Flux Coated Preforms Revenue Share (%), by Application 2025 & 2033
- Figure 18: South America Flux Coated Preforms Volume Share (%), by Application 2025 & 2033
- Figure 19: South America Flux Coated Preforms Revenue (million), by Type 2025 & 2033
- Figure 20: South America Flux Coated Preforms Volume (K), by Type 2025 & 2033
- Figure 21: South America Flux Coated Preforms Revenue Share (%), by Type 2025 & 2033
- Figure 22: South America Flux Coated Preforms Volume Share (%), by Type 2025 & 2033
- Figure 23: South America Flux Coated Preforms Revenue (million), by Country 2025 & 2033
- Figure 24: South America Flux Coated Preforms Volume (K), by Country 2025 & 2033
- Figure 25: South America Flux Coated Preforms Revenue Share (%), by Country 2025 & 2033
- Figure 26: South America Flux Coated Preforms Volume Share (%), by Country 2025 & 2033
- Figure 27: Europe Flux Coated Preforms Revenue (million), by Application 2025 & 2033
- Figure 28: Europe Flux Coated Preforms Volume (K), by Application 2025 & 2033
- Figure 29: Europe Flux Coated Preforms Revenue Share (%), by Application 2025 & 2033
- Figure 30: Europe Flux Coated Preforms Volume Share (%), by Application 2025 & 2033
- Figure 31: Europe Flux Coated Preforms Revenue (million), by Type 2025 & 2033
- Figure 32: Europe Flux Coated Preforms Volume (K), by Type 2025 & 2033
- Figure 33: Europe Flux Coated Preforms Revenue Share (%), by Type 2025 & 2033
- Figure 34: Europe Flux Coated Preforms Volume Share (%), by Type 2025 & 2033
- Figure 35: Europe Flux Coated Preforms Revenue (million), by Country 2025 & 2033
- Figure 36: Europe Flux Coated Preforms Volume (K), by Country 2025 & 2033
- Figure 37: Europe Flux Coated Preforms Revenue Share (%), by Country 2025 & 2033
- Figure 38: Europe Flux Coated Preforms Volume Share (%), by Country 2025 & 2033
- Figure 39: Middle East & Africa Flux Coated Preforms Revenue (million), by Application 2025 & 2033
- Figure 40: Middle East & Africa Flux Coated Preforms Volume (K), by Application 2025 & 2033
- Figure 41: Middle East & Africa Flux Coated Preforms Revenue Share (%), by Application 2025 & 2033
- Figure 42: Middle East & Africa Flux Coated Preforms Volume Share (%), by Application 2025 & 2033
- Figure 43: Middle East & Africa Flux Coated Preforms Revenue (million), by Type 2025 & 2033
- Figure 44: Middle East & Africa Flux Coated Preforms Volume (K), by Type 2025 & 2033
- Figure 45: Middle East & Africa Flux Coated Preforms Revenue Share (%), by Type 2025 & 2033
- Figure 46: Middle East & Africa Flux Coated Preforms Volume Share (%), by Type 2025 & 2033
- Figure 47: Middle East & Africa Flux Coated Preforms Revenue (million), by Country 2025 & 2033
- Figure 48: Middle East & Africa Flux Coated Preforms Volume (K), by Country 2025 & 2033
- Figure 49: Middle East & Africa Flux Coated Preforms Revenue Share (%), by Country 2025 & 2033
- Figure 50: Middle East & Africa Flux Coated Preforms Volume Share (%), by Country 2025 & 2033
- Figure 51: Asia Pacific Flux Coated Preforms Revenue (million), by Application 2025 & 2033
- Figure 52: Asia Pacific Flux Coated Preforms Volume (K), by Application 2025 & 2033
- Figure 53: Asia Pacific Flux Coated Preforms Revenue Share (%), by Application 2025 & 2033
- Figure 54: Asia Pacific Flux Coated Preforms Volume Share (%), by Application 2025 & 2033
- Figure 55: Asia Pacific Flux Coated Preforms Revenue (million), by Type 2025 & 2033
- Figure 56: Asia Pacific Flux Coated Preforms Volume (K), by Type 2025 & 2033
- Figure 57: Asia Pacific Flux Coated Preforms Revenue Share (%), by Type 2025 & 2033
- Figure 58: Asia Pacific Flux Coated Preforms Volume Share (%), by Type 2025 & 2033
- Figure 59: Asia Pacific Flux Coated Preforms Revenue (million), by Country 2025 & 2033
- Figure 60: Asia Pacific Flux Coated Preforms Volume (K), by Country 2025 & 2033
- Figure 61: Asia Pacific Flux Coated Preforms Revenue Share (%), by Country 2025 & 2033
- Figure 62: Asia Pacific Flux Coated Preforms Volume Share (%), by Country 2025 & 2033
List of Tables
- Table 1: Global Flux Coated Preforms Revenue million Forecast, by Application 2020 & 2033
- Table 2: Global Flux Coated Preforms Volume K Forecast, by Application 2020 & 2033
- Table 3: Global Flux Coated Preforms Revenue million Forecast, by Type 2020 & 2033
- Table 4: Global Flux Coated Preforms Volume K Forecast, by Type 2020 & 2033
- Table 5: Global Flux Coated Preforms Revenue million Forecast, by Region 2020 & 2033
- Table 6: Global Flux Coated Preforms Volume K Forecast, by Region 2020 & 2033
- Table 7: Global Flux Coated Preforms Revenue million Forecast, by Application 2020 & 2033
- Table 8: Global Flux Coated Preforms Volume K Forecast, by Application 2020 & 2033
- Table 9: Global Flux Coated Preforms Revenue million Forecast, by Type 2020 & 2033
- Table 10: Global Flux Coated Preforms Volume K Forecast, by Type 2020 & 2033
- Table 11: Global Flux Coated Preforms Revenue million Forecast, by Country 2020 & 2033
- Table 12: Global Flux Coated Preforms Volume K Forecast, by Country 2020 & 2033
- Table 13: United States Flux Coated Preforms Revenue (million) Forecast, by Application 2020 & 2033
- Table 14: United States Flux Coated Preforms Volume (K) Forecast, by Application 2020 & 2033
- Table 15: Canada Flux Coated Preforms Revenue (million) Forecast, by Application 2020 & 2033
- Table 16: Canada Flux Coated Preforms Volume (K) Forecast, by Application 2020 & 2033
- Table 17: Mexico Flux Coated Preforms Revenue (million) Forecast, by Application 2020 & 2033
- Table 18: Mexico Flux Coated Preforms Volume (K) Forecast, by Application 2020 & 2033
- Table 19: Global Flux Coated Preforms Revenue million Forecast, by Application 2020 & 2033
- Table 20: Global Flux Coated Preforms Volume K Forecast, by Application 2020 & 2033
- Table 21: Global Flux Coated Preforms Revenue million Forecast, by Type 2020 & 2033
- Table 22: Global Flux Coated Preforms Volume K Forecast, by Type 2020 & 2033
- Table 23: Global Flux Coated Preforms Revenue million Forecast, by Country 2020 & 2033
- Table 24: Global Flux Coated Preforms Volume K Forecast, by Country 2020 & 2033
- Table 25: Brazil Flux Coated Preforms Revenue (million) Forecast, by Application 2020 & 2033
- Table 26: Brazil Flux Coated Preforms Volume (K) Forecast, by Application 2020 & 2033
- Table 27: Argentina Flux Coated Preforms Revenue (million) Forecast, by Application 2020 & 2033
- Table 28: Argentina Flux Coated Preforms Volume (K) Forecast, by Application 2020 & 2033
- Table 29: Rest of South America Flux Coated Preforms Revenue (million) Forecast, by Application 2020 & 2033
- Table 30: Rest of South America Flux Coated Preforms Volume (K) Forecast, by Application 2020 & 2033
- Table 31: Global Flux Coated Preforms Revenue million Forecast, by Application 2020 & 2033
- Table 32: Global Flux Coated Preforms Volume K Forecast, by Application 2020 & 2033
- Table 33: Global Flux Coated Preforms Revenue million Forecast, by Type 2020 & 2033
- Table 34: Global Flux Coated Preforms Volume K Forecast, by Type 2020 & 2033
- Table 35: Global Flux Coated Preforms Revenue million Forecast, by Country 2020 & 2033
- Table 36: Global Flux Coated Preforms Volume K Forecast, by Country 2020 & 2033
- Table 37: United Kingdom Flux Coated Preforms Revenue (million) Forecast, by Application 2020 & 2033
- Table 38: United Kingdom Flux Coated Preforms Volume (K) Forecast, by Application 2020 & 2033
- Table 39: Germany Flux Coated Preforms Revenue (million) Forecast, by Application 2020 & 2033
- Table 40: Germany Flux Coated Preforms Volume (K) Forecast, by Application 2020 & 2033
- Table 41: France Flux Coated Preforms Revenue (million) Forecast, by Application 2020 & 2033
- Table 42: France Flux Coated Preforms Volume (K) Forecast, by Application 2020 & 2033
- Table 43: Italy Flux Coated Preforms Revenue (million) Forecast, by Application 2020 & 2033
- Table 44: Italy Flux Coated Preforms Volume (K) Forecast, by Application 2020 & 2033
- Table 45: Spain Flux Coated Preforms Revenue (million) Forecast, by Application 2020 & 2033
- Table 46: Spain Flux Coated Preforms Volume (K) Forecast, by Application 2020 & 2033
- Table 47: Russia Flux Coated Preforms Revenue (million) Forecast, by Application 2020 & 2033
- Table 48: Russia Flux Coated Preforms Volume (K) Forecast, by Application 2020 & 2033
- Table 49: Benelux Flux Coated Preforms Revenue (million) Forecast, by Application 2020 & 2033
- Table 50: Benelux Flux Coated Preforms Volume (K) Forecast, by Application 2020 & 2033
- Table 51: Nordics Flux Coated Preforms Revenue (million) Forecast, by Application 2020 & 2033
- Table 52: Nordics Flux Coated Preforms Volume (K) Forecast, by Application 2020 & 2033
- Table 53: Rest of Europe Flux Coated Preforms Revenue (million) Forecast, by Application 2020 & 2033
- Table 54: Rest of Europe Flux Coated Preforms Volume (K) Forecast, by Application 2020 & 2033
- Table 55: Global Flux Coated Preforms Revenue million Forecast, by Application 2020 & 2033
- Table 56: Global Flux Coated Preforms Volume K Forecast, by Application 2020 & 2033
- Table 57: Global Flux Coated Preforms Revenue million Forecast, by Type 2020 & 2033
- Table 58: Global Flux Coated Preforms Volume K Forecast, by Type 2020 & 2033
- Table 59: Global Flux Coated Preforms Revenue million Forecast, by Country 2020 & 2033
- Table 60: Global Flux Coated Preforms Volume K Forecast, by Country 2020 & 2033
- Table 61: Turkey Flux Coated Preforms Revenue (million) Forecast, by Application 2020 & 2033
- Table 62: Turkey Flux Coated Preforms Volume (K) Forecast, by Application 2020 & 2033
- Table 63: Israel Flux Coated Preforms Revenue (million) Forecast, by Application 2020 & 2033
- Table 64: Israel Flux Coated Preforms Volume (K) Forecast, by Application 2020 & 2033
- Table 65: GCC Flux Coated Preforms Revenue (million) Forecast, by Application 2020 & 2033
- Table 66: GCC Flux Coated Preforms Volume (K) Forecast, by Application 2020 & 2033
- Table 67: North Africa Flux Coated Preforms Revenue (million) Forecast, by Application 2020 & 2033
- Table 68: North Africa Flux Coated Preforms Volume (K) Forecast, by Application 2020 & 2033
- Table 69: South Africa Flux Coated Preforms Revenue (million) Forecast, by Application 2020 & 2033
- Table 70: South Africa Flux Coated Preforms Volume (K) Forecast, by Application 2020 & 2033
- Table 71: Rest of Middle East & Africa Flux Coated Preforms Revenue (million) Forecast, by Application 2020 & 2033
- Table 72: Rest of Middle East & Africa Flux Coated Preforms Volume (K) Forecast, by Application 2020 & 2033
- Table 73: Global Flux Coated Preforms Revenue million Forecast, by Application 2020 & 2033
- Table 74: Global Flux Coated Preforms Volume K Forecast, by Application 2020 & 2033
- Table 75: Global Flux Coated Preforms Revenue million Forecast, by Type 2020 & 2033
- Table 76: Global Flux Coated Preforms Volume K Forecast, by Type 2020 & 2033
- Table 77: Global Flux Coated Preforms Revenue million Forecast, by Country 2020 & 2033
- Table 78: Global Flux Coated Preforms Volume K Forecast, by Country 2020 & 2033
- Table 79: China Flux Coated Preforms Revenue (million) Forecast, by Application 2020 & 2033
- Table 80: China Flux Coated Preforms Volume (K) Forecast, by Application 2020 & 2033
- Table 81: India Flux Coated Preforms Revenue (million) Forecast, by Application 2020 & 2033
- Table 82: India Flux Coated Preforms Volume (K) Forecast, by Application 2020 & 2033
- Table 83: Japan Flux Coated Preforms Revenue (million) Forecast, by Application 2020 & 2033
- Table 84: Japan Flux Coated Preforms Volume (K) Forecast, by Application 2020 & 2033
- Table 85: South Korea Flux Coated Preforms Revenue (million) Forecast, by Application 2020 & 2033
- Table 86: South Korea Flux Coated Preforms Volume (K) Forecast, by Application 2020 & 2033
- Table 87: ASEAN Flux Coated Preforms Revenue (million) Forecast, by Application 2020 & 2033
- Table 88: ASEAN Flux Coated Preforms Volume (K) Forecast, by Application 2020 & 2033
- Table 89: Oceania Flux Coated Preforms Revenue (million) Forecast, by Application 2020 & 2033
- Table 90: Oceania Flux Coated Preforms Volume (K) Forecast, by Application 2020 & 2033
- Table 91: Rest of Asia Pacific Flux Coated Preforms Revenue (million) Forecast, by Application 2020 & 2033
- Table 92: Rest of Asia Pacific Flux Coated Preforms Volume (K) Forecast, by Application 2020 & 2033
Frequently Asked Questions
1. What is the projected Compound Annual Growth Rate (CAGR) of the Flux Coated Preforms?
The projected CAGR is approximately 5.2%.
2. Which companies are prominent players in the Flux Coated Preforms?
Key companies in the market include SMIC, Indium Corporation, Ametek, Alpha, Pfarr, Harris Products, AIM, Zhejiang YaTong Advanced Materials, Solderwell Advanced Materials, Fromosol, Guangdong Zhongshi Metal Co, Shenmao.
3. What are the main segments of the Flux Coated Preforms?
The market segments include Application, Type.
4. Can you provide details about the market size?
The market size is estimated to be USD 454 million as of 2022.
5. What are some drivers contributing to market growth?
N/A
6. What are the notable trends driving market growth?
N/A
7. Are there any restraints impacting market growth?
N/A
8. Can you provide examples of recent developments in the market?
N/A
9. What pricing options are available for accessing the report?
Pricing options include single-user, multi-user, and enterprise licenses priced at USD 3950.00, USD 5925.00, and USD 7900.00 respectively.
10. Is the market size provided in terms of value or volume?
The market size is provided in terms of value, measured in million and volume, measured in K.
11. Are there any specific market keywords associated with the report?
Yes, the market keyword associated with the report is "Flux Coated Preforms," which aids in identifying and referencing the specific market segment covered.
12. How do I determine which pricing option suits my needs best?
The pricing options vary based on user requirements and access needs. Individual users may opt for single-user licenses, while businesses requiring broader access may choose multi-user or enterprise licenses for cost-effective access to the report.
13. Are there any additional resources or data provided in the Flux Coated Preforms report?
While the report offers comprehensive insights, it's advisable to review the specific contents or supplementary materials provided to ascertain if additional resources or data are available.
14. How can I stay updated on further developments or reports in the Flux Coated Preforms?
To stay informed about further developments, trends, and reports in the Flux Coated Preforms, consider subscribing to industry newsletters, following relevant companies and organizations, or regularly checking reputable industry news sources and publications.
Methodology
Step 1 - Identification of Relevant Samples Size from Population Database


Step 2 - Approaches for Defining Global Market Size (Value, Volume* & Price*)

Note*: In applicable scenarios
Step 3 - Data Sources
Primary Research
- Web Analytics
- Survey Reports
- Research Institute
- Latest Research Reports
- Opinion Leaders
Secondary Research
- Annual Reports
- White Paper
- Latest Press Release
- Industry Association
- Paid Database
- Investor Presentations

Step 4 - Data Triangulation
Involves using different sources of information in order to increase the validity of a study
These sources are likely to be stakeholders in a program - participants, other researchers, program staff, other community members, and so on.
Then we put all data in single framework & apply various statistical tools to find out the dynamic on the market.
During the analysis stage, feedback from the stakeholder groups would be compared to determine areas of agreement as well as areas of divergence