

Key Insights
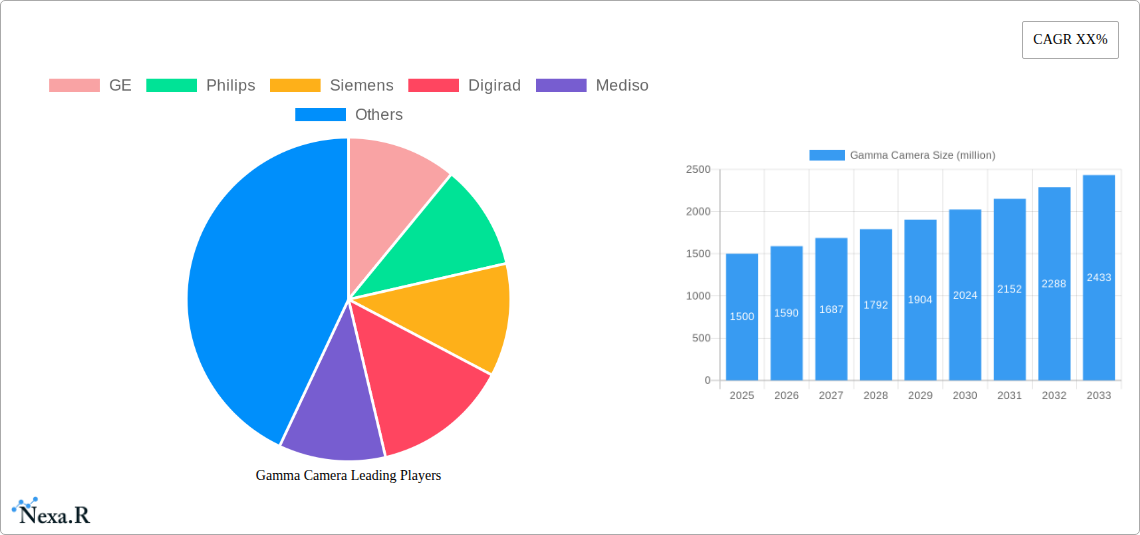
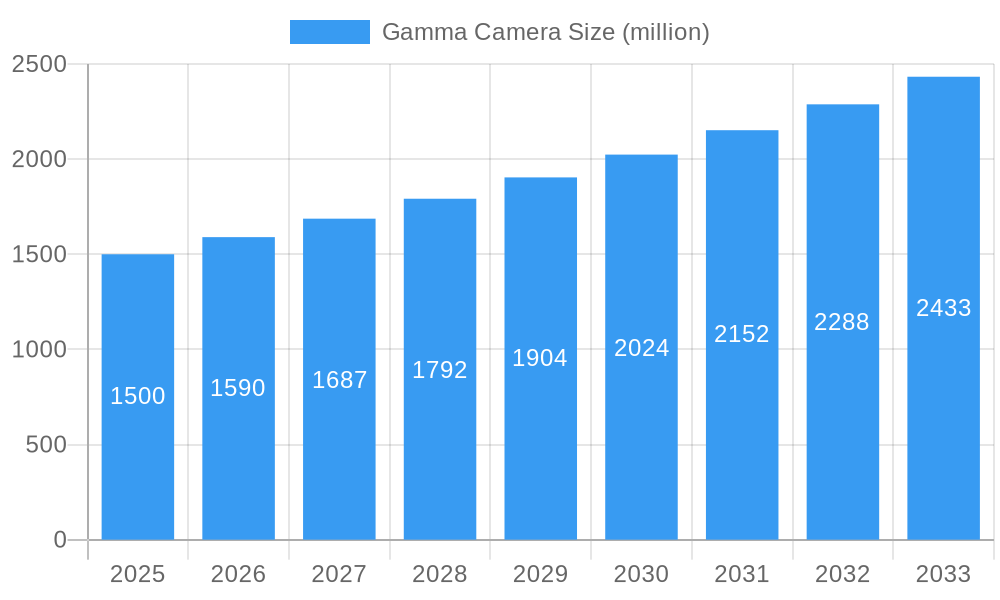
The global gamma camera market is experiencing robust growth, driven by increasing prevalence of various diseases requiring nuclear medicine imaging, technological advancements leading to improved image quality and resolution, and rising demand for minimally invasive diagnostic procedures. The market, estimated at $1.5 billion in 2025, is projected to exhibit a compound annual growth rate (CAGR) of 6% from 2025 to 2033, reaching approximately $2.5 billion by the end of the forecast period. Key drivers include the aging global population, increasing incidence of cancer and cardiovascular diseases, and growing adoption of SPECT/CT and hybrid imaging systems that combine gamma camera technology with other modalities like CT scans, improving diagnostic accuracy and reducing the need for multiple scans. This trend towards advanced imaging technologies is also supported by the ongoing development of new radiopharmaceuticals that enhance image contrast and specificity.
Gamma Camera Market Size (In Billion)
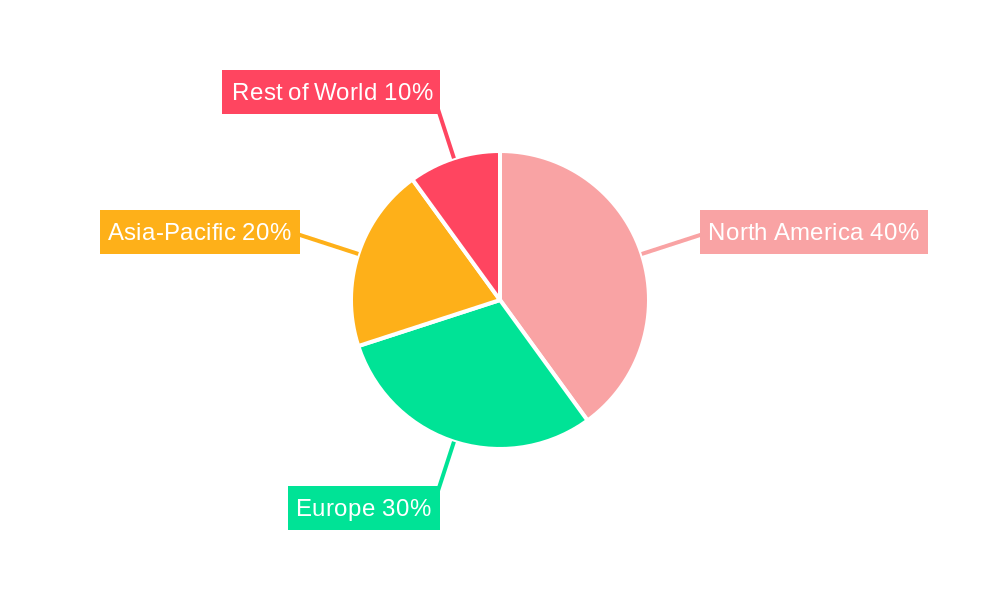
However, market growth is tempered by factors such as high equipment costs, stringent regulatory approvals required for new devices and radiopharmaceuticals, and the need for skilled technicians to operate and maintain gamma cameras. The market is segmented by type (SPECT, planar), application (cardiology, oncology, neurology), and end-user (hospitals, clinics, research centers). Leading players like GE Healthcare, Philips, Siemens Healthineers, and others are investing heavily in research and development to enhance gamma camera technology, introduce advanced features, and expand their market reach. Competition is fierce, with companies focusing on product innovation, strategic partnerships, and mergers and acquisitions to gain market share. Regional variations exist, with North America and Europe currently holding significant shares due to advanced healthcare infrastructure and high adoption rates of advanced imaging techniques. Emerging markets in Asia-Pacific are expected to contribute substantially to market growth in the coming years as healthcare infrastructure improves and access to nuclear medicine expands.
Gamma Camera Company Market Share
Gamma Camera Market Report: 2019-2033 - A Comprehensive Analysis
This comprehensive report provides an in-depth analysis of the global Gamma Camera market, offering valuable insights for industry professionals, investors, and strategic decision-makers. The study covers the period from 2019 to 2033, with a focus on the forecast period (2025-2033), utilizing 2025 as the base year and estimated year. The report segments the market by various factors and analyzes key players, growth trends, and future opportunities. The market size is estimated to be xx million units in 2025, with a projected CAGR of xx% during the forecast period. This report offers actionable intelligence across the parent market of Medical Imaging Equipment and the child market of Nuclear Medicine Equipment.
Gamma Camera Market Dynamics & Structure
The Gamma Camera market is characterized by a moderately concentrated landscape, with key players like GE, Philips, and Siemens holding significant market share. Technological innovation, particularly in detector technology and image processing, is a key driver. Regulatory frameworks, including those related to radiation safety and medical device approvals, significantly influence market dynamics. Competitive substitutes, such as MRI and CT scanners, exert pressure, particularly in specific applications. The end-user demographic is primarily hospitals and diagnostic imaging centers, with a growing presence in ambulatory care settings. M&A activity has been moderate in recent years, with xx major deals recorded between 2019 and 2024, representing a total value of xx million units.
- Market Concentration: GE, Philips, and Siemens hold approximately xx% of the market share collectively in 2025.
- Technological Innovation: Advancements in semiconductor technology and digital signal processing are driving improvements in image resolution and sensitivity.
- Regulatory Landscape: Stringent regulatory approvals processes impact time-to-market for new products.
- Competitive Substitutes: MRI and CT scans offer alternative imaging modalities, limiting Gamma Camera adoption in some applications.
- M&A Activity: Consolidation is expected to continue, driven by the need for economies of scale and technological advancements.
Gamma Camera Growth Trends & Insights
The global Gamma Camera market experienced a steady growth trajectory between 2019 and 2024, driven by the increasing prevalence of cardiovascular diseases, oncology, and other conditions requiring nuclear medicine imaging. Adoption rates have shown a positive correlation with healthcare infrastructure development and economic growth in emerging markets. Technological disruptions, such as the introduction of SPECT/CT systems, have fueled market expansion by offering enhanced diagnostic capabilities. Changes in consumer behavior, including a greater emphasis on minimally invasive procedures and early diagnosis, have further contributed to market growth. The market size is projected to reach xx million units by 2033, exhibiting a CAGR of xx% during the forecast period. Market penetration is expected to increase significantly in developing economies, driven by rising disposable incomes and improved healthcare access.
Dominant Regions, Countries, or Segments in Gamma Camera
North America currently holds the largest market share for Gamma Cameras, driven by factors such as high healthcare expenditure, advanced healthcare infrastructure, and a large patient pool. Europe follows as a significant market, with consistent growth driven by increasing adoption rates in Western European countries. Asia-Pacific is experiencing rapid expansion, fueled by rising healthcare investment and increasing awareness of nuclear medicine applications. The hospital segment dominates the market, representing approximately xx% of the total market share in 2025.
- North America: High healthcare expenditure and advanced infrastructure contribute to market dominance.
- Europe: Consistent growth driven by adoption in Western European countries.
- Asia-Pacific: Rapid expansion fueled by rising healthcare investments and awareness.
- Hospital Segment: Represents the largest end-user segment due to high demand for diagnostic imaging services.
Gamma Camera Product Landscape
Gamma Cameras have undergone significant advancements, featuring improved detector technology, advanced image processing algorithms, and integrated SPECT/CT capabilities. These advancements lead to enhanced image quality, reduced scan times, and improved diagnostic accuracy. Key selling propositions include improved spatial resolution, increased sensitivity, and reduced radiation exposure to patients. Technological advancements such as the use of solid-state detectors and advanced reconstruction algorithms continue to drive product innovation.
Key Drivers, Barriers & Challenges in Gamma Camera
Key Drivers: Increasing prevalence of chronic diseases, rising healthcare spending, technological advancements, and growing awareness of nuclear medicine's benefits drive market growth. Favorable regulatory environments in certain regions also stimulate adoption.
Challenges & Restraints: High initial investment costs, stringent regulatory approvals, skilled personnel shortages, and competition from alternative imaging modalities pose significant challenges. Supply chain disruptions related to crucial components could impact production and market availability, causing price fluctuations. These factors could hinder market growth if not addressed proactively.
Emerging Opportunities in Gamma Camera
Untapped markets in developing economies present significant growth potential. Innovative applications, such as molecular imaging and personalized medicine, offer new avenues for market expansion. The increasing integration of AI and machine learning in image analysis and interpretation presents a significant opportunity. Furthermore, evolving consumer preferences towards minimally invasive procedures and improved diagnostic accuracy are creating new demand for advanced Gamma Camera systems.
Growth Accelerators in the Gamma Camera Industry
Technological breakthroughs, particularly in detector technology and image processing, are major growth accelerators. Strategic partnerships between manufacturers and healthcare providers facilitate market access and product adoption. Expansion into emerging markets through distribution networks and joint ventures will further drive growth. Focus on developing cost-effective and portable Gamma Camera systems for use in remote areas is expected to unlock significant growth potential.
Notable Milestones in Gamma Camera Sector
- 2020: Introduction of a new Gamma Camera model with improved image resolution by GE.
- 2021: Acquisition of a smaller Gamma Camera manufacturer by Siemens, expanding its market presence.
- 2022: FDA approval of a new SPECT/CT system with advanced features by Philips.
- 2023: Launch of a portable Gamma Camera for use in remote areas by a smaller player. (Further milestones for the remaining years would be added here based on available data).
In-Depth Gamma Camera Market Outlook
The Gamma Camera market is poised for continued growth driven by technological advancements, increasing healthcare expenditure globally, and the growing adoption of nuclear medicine procedures. Strategic partnerships, expansion into untapped markets, and the development of innovative applications will be key drivers of future market potential. The integration of AI and machine learning in Gamma Camera systems presents a significant opportunity to enhance diagnostic accuracy and workflow efficiency, further accelerating market growth and creating new avenues for investment and innovation.
Gamma Camera Segmentation
-
1. Application
- 1.1. Thyroid Scanning
- 1.2. Molecular Breast Imaging
- 1.3. Kidney Scanning
- 1.4. Others
-
2. Types
- 2.1. Large
- 2.2. Small
Gamma Camera Segmentation By Geography
-
1. North America
- 1.1. United States
- 1.2. Canada
- 1.3. Mexico
-
2. South America
- 2.1. Brazil
- 2.2. Argentina
- 2.3. Rest of South America
-
3. Europe
- 3.1. United Kingdom
- 3.2. Germany
- 3.3. France
- 3.4. Italy
- 3.5. Spain
- 3.6. Russia
- 3.7. Benelux
- 3.8. Nordics
- 3.9. Rest of Europe
-
4. Middle East & Africa
- 4.1. Turkey
- 4.2. Israel
- 4.3. GCC
- 4.4. North Africa
- 4.5. South Africa
- 4.6. Rest of Middle East & Africa
-
5. Asia Pacific
- 5.1. China
- 5.2. India
- 5.3. Japan
- 5.4. South Korea
- 5.5. ASEAN
- 5.6. Oceania
- 5.7. Rest of Asia Pacific
Gamma Camera Regional Market Share
Geographic Coverage of Gamma Camera
Gamma Camera REPORT HIGHLIGHTS
| Aspects | Details |
|---|---|
| Study Period | 2020-2034 |
| Base Year | 2025 |
| Estimated Year | 2026 |
| Forecast Period | 2026-2034 |
| Historical Period | 2020-2025 |
| Growth Rate | CAGR of XX% from 2020-2034 |
| Segmentation |
|
Table of Contents
- 1. Introduction
- 1.1. Research Scope
- 1.2. Market Segmentation
- 1.3. Research Methodology
- 1.4. Definitions and Assumptions
- 2. Executive Summary
- 2.1. Introduction
- 3. Market Dynamics
- 3.1. Introduction
- 3.2. Market Drivers
- 3.3. Market Restrains
- 3.4. Market Trends
- 4. Market Factor Analysis
- 4.1. Porters Five Forces
- 4.2. Supply/Value Chain
- 4.3. PESTEL analysis
- 4.4. Market Entropy
- 4.5. Patent/Trademark Analysis
- 5. Global Gamma Camera Analysis, Insights and Forecast, 2020-2032
- 5.1. Market Analysis, Insights and Forecast - by Application
- 5.1.1. Thyroid Scanning
- 5.1.2. Molecular Breast Imaging
- 5.1.3. Kidney Scanning
- 5.1.4. Others
- 5.2. Market Analysis, Insights and Forecast - by Types
- 5.2.1. Large
- 5.2.2. Small
- 5.3. Market Analysis, Insights and Forecast - by Region
- 5.3.1. North America
- 5.3.2. South America
- 5.3.3. Europe
- 5.3.4. Middle East & Africa
- 5.3.5. Asia Pacific
- 5.1. Market Analysis, Insights and Forecast - by Application
- 6. North America Gamma Camera Analysis, Insights and Forecast, 2020-2032
- 6.1. Market Analysis, Insights and Forecast - by Application
- 6.1.1. Thyroid Scanning
- 6.1.2. Molecular Breast Imaging
- 6.1.3. Kidney Scanning
- 6.1.4. Others
- 6.2. Market Analysis, Insights and Forecast - by Types
- 6.2.1. Large
- 6.2.2. Small
- 6.1. Market Analysis, Insights and Forecast - by Application
- 7. South America Gamma Camera Analysis, Insights and Forecast, 2020-2032
- 7.1. Market Analysis, Insights and Forecast - by Application
- 7.1.1. Thyroid Scanning
- 7.1.2. Molecular Breast Imaging
- 7.1.3. Kidney Scanning
- 7.1.4. Others
- 7.2. Market Analysis, Insights and Forecast - by Types
- 7.2.1. Large
- 7.2.2. Small
- 7.1. Market Analysis, Insights and Forecast - by Application
- 8. Europe Gamma Camera Analysis, Insights and Forecast, 2020-2032
- 8.1. Market Analysis, Insights and Forecast - by Application
- 8.1.1. Thyroid Scanning
- 8.1.2. Molecular Breast Imaging
- 8.1.3. Kidney Scanning
- 8.1.4. Others
- 8.2. Market Analysis, Insights and Forecast - by Types
- 8.2.1. Large
- 8.2.2. Small
- 8.1. Market Analysis, Insights and Forecast - by Application
- 9. Middle East & Africa Gamma Camera Analysis, Insights and Forecast, 2020-2032
- 9.1. Market Analysis, Insights and Forecast - by Application
- 9.1.1. Thyroid Scanning
- 9.1.2. Molecular Breast Imaging
- 9.1.3. Kidney Scanning
- 9.1.4. Others
- 9.2. Market Analysis, Insights and Forecast - by Types
- 9.2.1. Large
- 9.2.2. Small
- 9.1. Market Analysis, Insights and Forecast - by Application
- 10. Asia Pacific Gamma Camera Analysis, Insights and Forecast, 2020-2032
- 10.1. Market Analysis, Insights and Forecast - by Application
- 10.1.1. Thyroid Scanning
- 10.1.2. Molecular Breast Imaging
- 10.1.3. Kidney Scanning
- 10.1.4. Others
- 10.2. Market Analysis, Insights and Forecast - by Types
- 10.2.1. Large
- 10.2.2. Small
- 10.1. Market Analysis, Insights and Forecast - by Application
- 11. Competitive Analysis
- 11.1. Global Market Share Analysis 2025
- 11.2. Company Profiles
- 11.2.1 GE
- 11.2.1.1. Overview
- 11.2.1.2. Products
- 11.2.1.3. SWOT Analysis
- 11.2.1.4. Recent Developments
- 11.2.1.5. Financials (Based on Availability)
- 11.2.2 Philips
- 11.2.2.1. Overview
- 11.2.2.2. Products
- 11.2.2.3. SWOT Analysis
- 11.2.2.4. Recent Developments
- 11.2.2.5. Financials (Based on Availability)
- 11.2.3 Siemens
- 11.2.3.1. Overview
- 11.2.3.2. Products
- 11.2.3.3. SWOT Analysis
- 11.2.3.4. Recent Developments
- 11.2.3.5. Financials (Based on Availability)
- 11.2.4 Digirad
- 11.2.4.1. Overview
- 11.2.4.2. Products
- 11.2.4.3. SWOT Analysis
- 11.2.4.4. Recent Developments
- 11.2.4.5. Financials (Based on Availability)
- 11.2.5 Mediso
- 11.2.5.1. Overview
- 11.2.5.2. Products
- 11.2.5.3. SWOT Analysis
- 11.2.5.4. Recent Developments
- 11.2.5.5. Financials (Based on Availability)
- 11.2.6 MIE
- 11.2.6.1. Overview
- 11.2.6.2. Products
- 11.2.6.3. SWOT Analysis
- 11.2.6.4. Recent Developments
- 11.2.6.5. Financials (Based on Availability)
- 11.2.7 DDD Diagnostic
- 11.2.7.1. Overview
- 11.2.7.2. Products
- 11.2.7.3. SWOT Analysis
- 11.2.7.4. Recent Developments
- 11.2.7.5. Financials (Based on Availability)
- 11.2.8 Dilon Technologies
- 11.2.8.1. Overview
- 11.2.8.2. Products
- 11.2.8.3. SWOT Analysis
- 11.2.8.4. Recent Developments
- 11.2.8.5. Financials (Based on Availability)
- 11.2.9 Gamma Medica
- 11.2.9.1. Overview
- 11.2.9.2. Products
- 11.2.9.3. SWOT Analysis
- 11.2.9.4. Recent Developments
- 11.2.9.5. Financials (Based on Availability)
- 11.2.10 Capintec
- 11.2.10.1. Overview
- 11.2.10.2. Products
- 11.2.10.3. SWOT Analysis
- 11.2.10.4. Recent Developments
- 11.2.10.5. Financials (Based on Availability)
- 11.2.11 Beijing Hamamatsu
- 11.2.11.1. Overview
- 11.2.11.2. Products
- 11.2.11.3. SWOT Analysis
- 11.2.11.4. Recent Developments
- 11.2.11.5. Financials (Based on Availability)
- 11.2.12 Basda
- 11.2.12.1. Overview
- 11.2.12.2. Products
- 11.2.12.3. SWOT Analysis
- 11.2.12.4. Recent Developments
- 11.2.12.5. Financials (Based on Availability)
- 11.2.1 GE
List of Figures
- Figure 1: Global Gamma Camera Revenue Breakdown (million, %) by Region 2025 & 2033
- Figure 2: Global Gamma Camera Volume Breakdown (K, %) by Region 2025 & 2033
- Figure 3: North America Gamma Camera Revenue (million), by Application 2025 & 2033
- Figure 4: North America Gamma Camera Volume (K), by Application 2025 & 2033
- Figure 5: North America Gamma Camera Revenue Share (%), by Application 2025 & 2033
- Figure 6: North America Gamma Camera Volume Share (%), by Application 2025 & 2033
- Figure 7: North America Gamma Camera Revenue (million), by Types 2025 & 2033
- Figure 8: North America Gamma Camera Volume (K), by Types 2025 & 2033
- Figure 9: North America Gamma Camera Revenue Share (%), by Types 2025 & 2033
- Figure 10: North America Gamma Camera Volume Share (%), by Types 2025 & 2033
- Figure 11: North America Gamma Camera Revenue (million), by Country 2025 & 2033
- Figure 12: North America Gamma Camera Volume (K), by Country 2025 & 2033
- Figure 13: North America Gamma Camera Revenue Share (%), by Country 2025 & 2033
- Figure 14: North America Gamma Camera Volume Share (%), by Country 2025 & 2033
- Figure 15: South America Gamma Camera Revenue (million), by Application 2025 & 2033
- Figure 16: South America Gamma Camera Volume (K), by Application 2025 & 2033
- Figure 17: South America Gamma Camera Revenue Share (%), by Application 2025 & 2033
- Figure 18: South America Gamma Camera Volume Share (%), by Application 2025 & 2033
- Figure 19: South America Gamma Camera Revenue (million), by Types 2025 & 2033
- Figure 20: South America Gamma Camera Volume (K), by Types 2025 & 2033
- Figure 21: South America Gamma Camera Revenue Share (%), by Types 2025 & 2033
- Figure 22: South America Gamma Camera Volume Share (%), by Types 2025 & 2033
- Figure 23: South America Gamma Camera Revenue (million), by Country 2025 & 2033
- Figure 24: South America Gamma Camera Volume (K), by Country 2025 & 2033
- Figure 25: South America Gamma Camera Revenue Share (%), by Country 2025 & 2033
- Figure 26: South America Gamma Camera Volume Share (%), by Country 2025 & 2033
- Figure 27: Europe Gamma Camera Revenue (million), by Application 2025 & 2033
- Figure 28: Europe Gamma Camera Volume (K), by Application 2025 & 2033
- Figure 29: Europe Gamma Camera Revenue Share (%), by Application 2025 & 2033
- Figure 30: Europe Gamma Camera Volume Share (%), by Application 2025 & 2033
- Figure 31: Europe Gamma Camera Revenue (million), by Types 2025 & 2033
- Figure 32: Europe Gamma Camera Volume (K), by Types 2025 & 2033
- Figure 33: Europe Gamma Camera Revenue Share (%), by Types 2025 & 2033
- Figure 34: Europe Gamma Camera Volume Share (%), by Types 2025 & 2033
- Figure 35: Europe Gamma Camera Revenue (million), by Country 2025 & 2033
- Figure 36: Europe Gamma Camera Volume (K), by Country 2025 & 2033
- Figure 37: Europe Gamma Camera Revenue Share (%), by Country 2025 & 2033
- Figure 38: Europe Gamma Camera Volume Share (%), by Country 2025 & 2033
- Figure 39: Middle East & Africa Gamma Camera Revenue (million), by Application 2025 & 2033
- Figure 40: Middle East & Africa Gamma Camera Volume (K), by Application 2025 & 2033
- Figure 41: Middle East & Africa Gamma Camera Revenue Share (%), by Application 2025 & 2033
- Figure 42: Middle East & Africa Gamma Camera Volume Share (%), by Application 2025 & 2033
- Figure 43: Middle East & Africa Gamma Camera Revenue (million), by Types 2025 & 2033
- Figure 44: Middle East & Africa Gamma Camera Volume (K), by Types 2025 & 2033
- Figure 45: Middle East & Africa Gamma Camera Revenue Share (%), by Types 2025 & 2033
- Figure 46: Middle East & Africa Gamma Camera Volume Share (%), by Types 2025 & 2033
- Figure 47: Middle East & Africa Gamma Camera Revenue (million), by Country 2025 & 2033
- Figure 48: Middle East & Africa Gamma Camera Volume (K), by Country 2025 & 2033
- Figure 49: Middle East & Africa Gamma Camera Revenue Share (%), by Country 2025 & 2033
- Figure 50: Middle East & Africa Gamma Camera Volume Share (%), by Country 2025 & 2033
- Figure 51: Asia Pacific Gamma Camera Revenue (million), by Application 2025 & 2033
- Figure 52: Asia Pacific Gamma Camera Volume (K), by Application 2025 & 2033
- Figure 53: Asia Pacific Gamma Camera Revenue Share (%), by Application 2025 & 2033
- Figure 54: Asia Pacific Gamma Camera Volume Share (%), by Application 2025 & 2033
- Figure 55: Asia Pacific Gamma Camera Revenue (million), by Types 2025 & 2033
- Figure 56: Asia Pacific Gamma Camera Volume (K), by Types 2025 & 2033
- Figure 57: Asia Pacific Gamma Camera Revenue Share (%), by Types 2025 & 2033
- Figure 58: Asia Pacific Gamma Camera Volume Share (%), by Types 2025 & 2033
- Figure 59: Asia Pacific Gamma Camera Revenue (million), by Country 2025 & 2033
- Figure 60: Asia Pacific Gamma Camera Volume (K), by Country 2025 & 2033
- Figure 61: Asia Pacific Gamma Camera Revenue Share (%), by Country 2025 & 2033
- Figure 62: Asia Pacific Gamma Camera Volume Share (%), by Country 2025 & 2033
List of Tables
- Table 1: Global Gamma Camera Revenue million Forecast, by Application 2020 & 2033
- Table 2: Global Gamma Camera Volume K Forecast, by Application 2020 & 2033
- Table 3: Global Gamma Camera Revenue million Forecast, by Types 2020 & 2033
- Table 4: Global Gamma Camera Volume K Forecast, by Types 2020 & 2033
- Table 5: Global Gamma Camera Revenue million Forecast, by Region 2020 & 2033
- Table 6: Global Gamma Camera Volume K Forecast, by Region 2020 & 2033
- Table 7: Global Gamma Camera Revenue million Forecast, by Application 2020 & 2033
- Table 8: Global Gamma Camera Volume K Forecast, by Application 2020 & 2033
- Table 9: Global Gamma Camera Revenue million Forecast, by Types 2020 & 2033
- Table 10: Global Gamma Camera Volume K Forecast, by Types 2020 & 2033
- Table 11: Global Gamma Camera Revenue million Forecast, by Country 2020 & 2033
- Table 12: Global Gamma Camera Volume K Forecast, by Country 2020 & 2033
- Table 13: United States Gamma Camera Revenue (million) Forecast, by Application 2020 & 2033
- Table 14: United States Gamma Camera Volume (K) Forecast, by Application 2020 & 2033
- Table 15: Canada Gamma Camera Revenue (million) Forecast, by Application 2020 & 2033
- Table 16: Canada Gamma Camera Volume (K) Forecast, by Application 2020 & 2033
- Table 17: Mexico Gamma Camera Revenue (million) Forecast, by Application 2020 & 2033
- Table 18: Mexico Gamma Camera Volume (K) Forecast, by Application 2020 & 2033
- Table 19: Global Gamma Camera Revenue million Forecast, by Application 2020 & 2033
- Table 20: Global Gamma Camera Volume K Forecast, by Application 2020 & 2033
- Table 21: Global Gamma Camera Revenue million Forecast, by Types 2020 & 2033
- Table 22: Global Gamma Camera Volume K Forecast, by Types 2020 & 2033
- Table 23: Global Gamma Camera Revenue million Forecast, by Country 2020 & 2033
- Table 24: Global Gamma Camera Volume K Forecast, by Country 2020 & 2033
- Table 25: Brazil Gamma Camera Revenue (million) Forecast, by Application 2020 & 2033
- Table 26: Brazil Gamma Camera Volume (K) Forecast, by Application 2020 & 2033
- Table 27: Argentina Gamma Camera Revenue (million) Forecast, by Application 2020 & 2033
- Table 28: Argentina Gamma Camera Volume (K) Forecast, by Application 2020 & 2033
- Table 29: Rest of South America Gamma Camera Revenue (million) Forecast, by Application 2020 & 2033
- Table 30: Rest of South America Gamma Camera Volume (K) Forecast, by Application 2020 & 2033
- Table 31: Global Gamma Camera Revenue million Forecast, by Application 2020 & 2033
- Table 32: Global Gamma Camera Volume K Forecast, by Application 2020 & 2033
- Table 33: Global Gamma Camera Revenue million Forecast, by Types 2020 & 2033
- Table 34: Global Gamma Camera Volume K Forecast, by Types 2020 & 2033
- Table 35: Global Gamma Camera Revenue million Forecast, by Country 2020 & 2033
- Table 36: Global Gamma Camera Volume K Forecast, by Country 2020 & 2033
- Table 37: United Kingdom Gamma Camera Revenue (million) Forecast, by Application 2020 & 2033
- Table 38: United Kingdom Gamma Camera Volume (K) Forecast, by Application 2020 & 2033
- Table 39: Germany Gamma Camera Revenue (million) Forecast, by Application 2020 & 2033
- Table 40: Germany Gamma Camera Volume (K) Forecast, by Application 2020 & 2033
- Table 41: France Gamma Camera Revenue (million) Forecast, by Application 2020 & 2033
- Table 42: France Gamma Camera Volume (K) Forecast, by Application 2020 & 2033
- Table 43: Italy Gamma Camera Revenue (million) Forecast, by Application 2020 & 2033
- Table 44: Italy Gamma Camera Volume (K) Forecast, by Application 2020 & 2033
- Table 45: Spain Gamma Camera Revenue (million) Forecast, by Application 2020 & 2033
- Table 46: Spain Gamma Camera Volume (K) Forecast, by Application 2020 & 2033
- Table 47: Russia Gamma Camera Revenue (million) Forecast, by Application 2020 & 2033
- Table 48: Russia Gamma Camera Volume (K) Forecast, by Application 2020 & 2033
- Table 49: Benelux Gamma Camera Revenue (million) Forecast, by Application 2020 & 2033
- Table 50: Benelux Gamma Camera Volume (K) Forecast, by Application 2020 & 2033
- Table 51: Nordics Gamma Camera Revenue (million) Forecast, by Application 2020 & 2033
- Table 52: Nordics Gamma Camera Volume (K) Forecast, by Application 2020 & 2033
- Table 53: Rest of Europe Gamma Camera Revenue (million) Forecast, by Application 2020 & 2033
- Table 54: Rest of Europe Gamma Camera Volume (K) Forecast, by Application 2020 & 2033
- Table 55: Global Gamma Camera Revenue million Forecast, by Application 2020 & 2033
- Table 56: Global Gamma Camera Volume K Forecast, by Application 2020 & 2033
- Table 57: Global Gamma Camera Revenue million Forecast, by Types 2020 & 2033
- Table 58: Global Gamma Camera Volume K Forecast, by Types 2020 & 2033
- Table 59: Global Gamma Camera Revenue million Forecast, by Country 2020 & 2033
- Table 60: Global Gamma Camera Volume K Forecast, by Country 2020 & 2033
- Table 61: Turkey Gamma Camera Revenue (million) Forecast, by Application 2020 & 2033
- Table 62: Turkey Gamma Camera Volume (K) Forecast, by Application 2020 & 2033
- Table 63: Israel Gamma Camera Revenue (million) Forecast, by Application 2020 & 2033
- Table 64: Israel Gamma Camera Volume (K) Forecast, by Application 2020 & 2033
- Table 65: GCC Gamma Camera Revenue (million) Forecast, by Application 2020 & 2033
- Table 66: GCC Gamma Camera Volume (K) Forecast, by Application 2020 & 2033
- Table 67: North Africa Gamma Camera Revenue (million) Forecast, by Application 2020 & 2033
- Table 68: North Africa Gamma Camera Volume (K) Forecast, by Application 2020 & 2033
- Table 69: South Africa Gamma Camera Revenue (million) Forecast, by Application 2020 & 2033
- Table 70: South Africa Gamma Camera Volume (K) Forecast, by Application 2020 & 2033
- Table 71: Rest of Middle East & Africa Gamma Camera Revenue (million) Forecast, by Application 2020 & 2033
- Table 72: Rest of Middle East & Africa Gamma Camera Volume (K) Forecast, by Application 2020 & 2033
- Table 73: Global Gamma Camera Revenue million Forecast, by Application 2020 & 2033
- Table 74: Global Gamma Camera Volume K Forecast, by Application 2020 & 2033
- Table 75: Global Gamma Camera Revenue million Forecast, by Types 2020 & 2033
- Table 76: Global Gamma Camera Volume K Forecast, by Types 2020 & 2033
- Table 77: Global Gamma Camera Revenue million Forecast, by Country 2020 & 2033
- Table 78: Global Gamma Camera Volume K Forecast, by Country 2020 & 2033
- Table 79: China Gamma Camera Revenue (million) Forecast, by Application 2020 & 2033
- Table 80: China Gamma Camera Volume (K) Forecast, by Application 2020 & 2033
- Table 81: India Gamma Camera Revenue (million) Forecast, by Application 2020 & 2033
- Table 82: India Gamma Camera Volume (K) Forecast, by Application 2020 & 2033
- Table 83: Japan Gamma Camera Revenue (million) Forecast, by Application 2020 & 2033
- Table 84: Japan Gamma Camera Volume (K) Forecast, by Application 2020 & 2033
- Table 85: South Korea Gamma Camera Revenue (million) Forecast, by Application 2020 & 2033
- Table 86: South Korea Gamma Camera Volume (K) Forecast, by Application 2020 & 2033
- Table 87: ASEAN Gamma Camera Revenue (million) Forecast, by Application 2020 & 2033
- Table 88: ASEAN Gamma Camera Volume (K) Forecast, by Application 2020 & 2033
- Table 89: Oceania Gamma Camera Revenue (million) Forecast, by Application 2020 & 2033
- Table 90: Oceania Gamma Camera Volume (K) Forecast, by Application 2020 & 2033
- Table 91: Rest of Asia Pacific Gamma Camera Revenue (million) Forecast, by Application 2020 & 2033
- Table 92: Rest of Asia Pacific Gamma Camera Volume (K) Forecast, by Application 2020 & 2033
Frequently Asked Questions
1. What is the projected Compound Annual Growth Rate (CAGR) of the Gamma Camera?
The projected CAGR is approximately XX%.
2. Which companies are prominent players in the Gamma Camera?
Key companies in the market include GE, Philips, Siemens, Digirad, Mediso, MIE, DDD Diagnostic, Dilon Technologies, Gamma Medica, Capintec, Beijing Hamamatsu, Basda.
3. What are the main segments of the Gamma Camera?
The market segments include Application, Types.
4. Can you provide details about the market size?
The market size is estimated to be USD XXX million as of 2022.
5. What are some drivers contributing to market growth?
N/A
6. What are the notable trends driving market growth?
N/A
7. Are there any restraints impacting market growth?
N/A
8. Can you provide examples of recent developments in the market?
N/A
9. What pricing options are available for accessing the report?
Pricing options include single-user, multi-user, and enterprise licenses priced at USD 3350.00, USD 5025.00, and USD 6700.00 respectively.
10. Is the market size provided in terms of value or volume?
The market size is provided in terms of value, measured in million and volume, measured in K.
11. Are there any specific market keywords associated with the report?
Yes, the market keyword associated with the report is "Gamma Camera," which aids in identifying and referencing the specific market segment covered.
12. How do I determine which pricing option suits my needs best?
The pricing options vary based on user requirements and access needs. Individual users may opt for single-user licenses, while businesses requiring broader access may choose multi-user or enterprise licenses for cost-effective access to the report.
13. Are there any additional resources or data provided in the Gamma Camera report?
While the report offers comprehensive insights, it's advisable to review the specific contents or supplementary materials provided to ascertain if additional resources or data are available.
14. How can I stay updated on further developments or reports in the Gamma Camera?
To stay informed about further developments, trends, and reports in the Gamma Camera, consider subscribing to industry newsletters, following relevant companies and organizations, or regularly checking reputable industry news sources and publications.
Methodology
Step 1 - Identification of Relevant Samples Size from Population Database


Step 2 - Approaches for Defining Global Market Size (Value, Volume* & Price*)

Note*: In applicable scenarios
Step 3 - Data Sources
Primary Research
- Web Analytics
- Survey Reports
- Research Institute
- Latest Research Reports
- Opinion Leaders
Secondary Research
- Annual Reports
- White Paper
- Latest Press Release
- Industry Association
- Paid Database
- Investor Presentations

Step 4 - Data Triangulation
Involves using different sources of information in order to increase the validity of a study
These sources are likely to be stakeholders in a program - participants, other researchers, program staff, other community members, and so on.
Then we put all data in single framework & apply various statistical tools to find out the dynamic on the market.
During the analysis stage, feedback from the stakeholder groups would be compared to determine areas of agreement as well as areas of divergence