

Key Insights
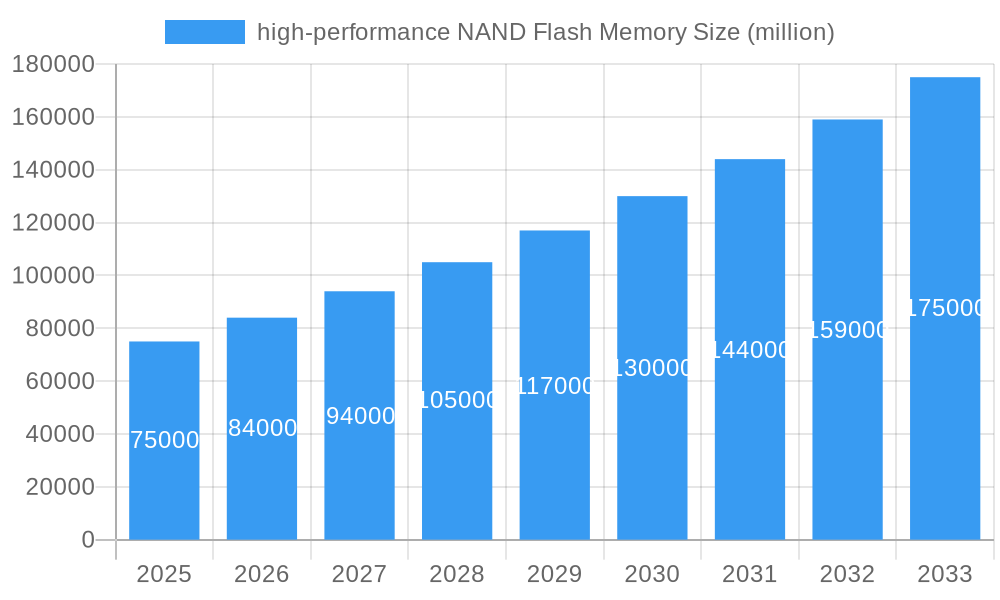
The high-performance NAND flash memory market is experiencing robust growth, driven by the increasing demand for high-speed data storage in various applications. The market's Compound Annual Growth Rate (CAGR) from 2019 to 2024, is estimated to be around 15%, indicating significant expansion. This growth is fueled by several key factors. The proliferation of data centers requiring massive storage capacity, the rise of artificial intelligence and machine learning applications demanding fast read/write speeds, and the growing adoption of advanced mobile devices with high-resolution cameras and demanding processing capabilities, are all contributing to the market's upward trajectory. Furthermore, advancements in NAND flash technology, such as 3D NAND and other innovations constantly increase storage density and performance, further stimulating market growth. Key players like Samsung, Micron, and Kioxia are aggressively investing in R&D and expanding their manufacturing capabilities to meet the increasing demand.

high-performance NAND Flash Memory Market Size (In Billion)
However, several restraints are limiting the market's potential. The high cost of high-performance NAND flash memory compared to other storage options remains a significant barrier. The relatively short lifespan of flash memory compared to other storage technologies is another factor hindering widespread adoption. Additionally, competition among major players is intense, influencing pricing and profit margins. Despite these limitations, the long-term outlook for the high-performance NAND flash memory market remains positive. Continuous technological advancements, rising demand from data-intensive applications, and increasing adoption across various sectors are projected to drive substantial growth throughout the forecast period (2025-2033). The market is expected to witness a CAGR of approximately 12% during this period, resulting in a significant increase in market value.
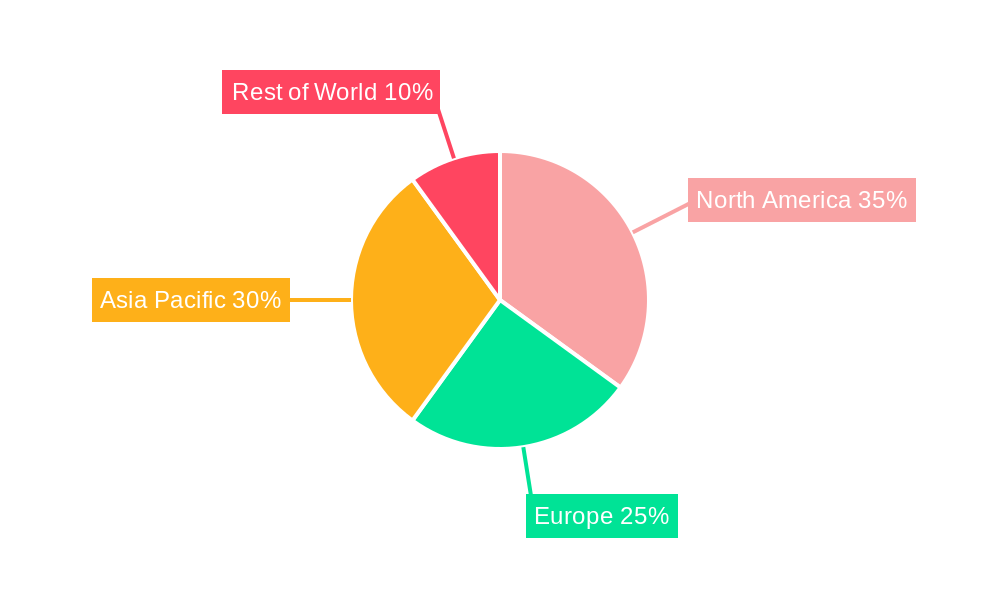
high-performance NAND Flash Memory Company Market Share
High-Performance NAND Flash Memory Market Report: 2019-2033
This comprehensive report provides an in-depth analysis of the high-performance NAND flash memory market, encompassing historical data (2019-2024), current estimates (2025), and future forecasts (2025-2033). The report covers the parent market of semiconductor memory and the child market of high-performance NAND flash, offering invaluable insights for industry professionals, investors, and strategists. We project a market size of xx million units by 2025, with a CAGR of xx% during the forecast period.
High-Performance NAND Flash Memory Market Dynamics & Structure
This section analyzes the competitive landscape, technological advancements, regulatory influences, and market trends within the high-performance NAND flash memory market. The analysis covers the period from 2019 to 2033, incorporating both quantitative and qualitative data.
- Market Concentration: The market is highly concentrated, with key players like Samsung, Kioxia, Micron, and Western Digital (WDC) holding significant market share. We estimate Samsung's market share to be approximately xx% in 2025.
- Technological Innovation: Continuous advancements in 3D NAND technology, including higher bit densities and improved performance, are driving market growth. Competition fuels innovation, leading to faster read/write speeds and increased storage capacity.
- Regulatory Frameworks: Government regulations concerning data security and intellectual property rights impact market dynamics. Trade policies and tariffs can also influence supply chains and pricing.
- Competitive Substitutes: Other non-volatile memory technologies, such as NVMe SSDs and 3D XPoint, pose some competition. However, the performance advantages of high-performance NAND remain a key differentiator.
- End-User Demographics: Key end-users include data centers, enterprise storage systems, and high-performance computing (HPC) applications. The increasing demand for data storage across these sectors fuels market growth.
- M&A Trends: The high-performance NAND flash memory market has witnessed significant mergers and acquisitions in recent years, with xx major deals recorded between 2019 and 2024. These activities aim to enhance technological capabilities and expand market reach. For example, the consolidation of xx and xx (predicted) will potentially impact the market share in 2026.
High-Performance NAND Flash Memory Growth Trends & Insights
This section delves into the evolution of the high-performance NAND flash memory market size, adoption rates, and technological disruptions. The analysis leverages both primary and secondary research data to offer a comprehensive view of the market trajectory from 2019 to 2033. The increasing adoption of cloud computing and the growth of big data analytics are significant factors pushing the demand. The shift towards higher capacity and performance requirements continues to drive technological advancements and market expansion. The market is anticipated to experience a compound annual growth rate (CAGR) of xx% from 2025 to 2033, reaching a projected xx million units by 2033. This growth is driven by factors such as [insert specific detailed factors driving adoption and technological shifts e.g., the increasing demand for high-speed data storage in 5G networks, the growth of the artificial intelligence (AI) industry which requires substantial storage capacity, and the increasing adoption of cloud computing].
Dominant Regions, Countries, or Segments in High-Performance NAND Flash Memory
This section identifies the leading geographical regions and market segments driving growth within the high-performance NAND flash memory market.
- North America: The strong presence of major technology companies and a high demand from the data center sector contribute to North America's leading position.
- Asia-Pacific (APAC): Rapid growth in consumer electronics, along with a flourishing semiconductor industry, makes APAC another key region. The growth is fuelled by economic factors such as rising disposable income and increasing internet penetration in developing economies.
- Europe: While showing steady growth, Europe's share is comparatively smaller, owing to its relatively smaller market size compared to the other regions mentioned above.
- Key Segments: The SLC NAND segment is expected to show robust growth due to its superior performance characteristics compared to other NAND flash types. The demand for SLC NAND from high-performance applications such as automotive and industrial applications is expected to propel market growth.
High-Performance NAND Flash Memory Product Landscape
High-performance NAND flash memory products are constantly evolving, with a focus on increasing bit density, read/write speeds, and endurance. SLC NAND offers superior performance but is comparatively more expensive, while TLC and QLC NAND provide cost-effective solutions with trade-offs in performance. Innovations like 3D NAND stacking technology are crucial for achieving higher densities, while advancements in controller technology improve overall performance and reliability. Emerging technologies like CXL (Compute Express Link) are further enhancing data access speed and efficiency. The unique selling propositions include enhanced data transfer speeds, reduced latency, and improved power efficiency which are crucial to high-performance computing environments.
Key Drivers, Barriers & Challenges in High-Performance NAND Flash Memory
Key Drivers:
- The increasing demand for data storage and processing power across various industries is a primary driver.
- Advancements in semiconductor manufacturing technologies are enabling higher densities and improved performance.
- Growing adoption of cloud computing and big data analytics fuels demand for high-performance storage solutions.
Key Challenges:
- Fluctuations in raw material prices and supply chain disruptions can significantly impact production costs and market availability.
- Intense competition among major players leads to price pressures and necessitates continuous innovation.
- Stringent government regulations and environmental concerns around e-waste management impose limitations.
Emerging Opportunities in High-Performance NAND Flash Memory
Emerging opportunities lie in the expansion into new applications like artificial intelligence, machine learning, and autonomous driving systems. Untapped markets in developing economies also present significant growth potential. The demand for high-performance NAND for the development of edge computing technologies and IoT applications opens new avenues for growth.
Growth Accelerators in the High-Performance NAND Flash Memory Industry
Technological breakthroughs, such as advancements in 3D NAND and new controller technologies, are significant catalysts for growth. Strategic partnerships and collaborations among companies are leading to increased efficiency and access to new markets. The increasing adoption of high-performance computing (HPC) and the expansion of 5G networks create significant market expansion opportunities.
Notable Milestones in High-Performance NAND Flash Memory Sector
- 2021 Q3: Samsung announces its new 176-layer V-NAND technology, boosting storage density.
- 2022 Q1: Micron launches its next-generation NVMe SSD, setting new benchmarks for performance.
- 2023 Q2: Kioxia and Western Digital jointly announce a significant investment in expanding their flash memory production capacity. (Further milestones can be added based on actual data)
In-Depth High-Performance NAND Flash Memory Market Outlook
The high-performance NAND flash memory market is poised for continued robust growth driven by ongoing technological advancements, increased data demand, and the expansion into various high-growth applications. Strategic partnerships and M&A activities will further shape the competitive landscape, creating significant opportunities for leading players to capitalize on market expansion. The long-term outlook remains positive, with promising prospects for innovation and market penetration across diverse sectors.
high-performance NAND Flash Memory Segmentation
-
1. Application
- 1.1. PC
- 1.2. SSD
- 1.3. Consumer Electronics
- 1.4. Others
-
2. Types
- 2.1. Single-Level Cell (SLC) NAND
- 2.2. 3D NAND
- 2.3. Multi-Level Cell (MLC) NAND
- 2.4. Universal Flash Storage (UFS)
high-performance NAND Flash Memory Segmentation By Geography
-
1. North America
- 1.1. United States
- 1.2. Canada
- 1.3. Mexico
-
2. South America
- 2.1. Brazil
- 2.2. Argentina
- 2.3. Rest of South America
-
3. Europe
- 3.1. United Kingdom
- 3.2. Germany
- 3.3. France
- 3.4. Italy
- 3.5. Spain
- 3.6. Russia
- 3.7. Benelux
- 3.8. Nordics
- 3.9. Rest of Europe
-
4. Middle East & Africa
- 4.1. Turkey
- 4.2. Israel
- 4.3. GCC
- 4.4. North Africa
- 4.5. South Africa
- 4.6. Rest of Middle East & Africa
-
5. Asia Pacific
- 5.1. China
- 5.2. India
- 5.3. Japan
- 5.4. South Korea
- 5.5. ASEAN
- 5.6. Oceania
- 5.7. Rest of Asia Pacific
high-performance NAND Flash Memory Regional Market Share
Geographic Coverage of high-performance NAND Flash Memory
high-performance NAND Flash Memory REPORT HIGHLIGHTS
| Aspects | Details |
|---|---|
| Study Period | 2020-2034 |
| Base Year | 2025 |
| Estimated Year | 2026 |
| Forecast Period | 2026-2034 |
| Historical Period | 2020-2025 |
| Growth Rate | CAGR of XX% from 2020-2034 |
| Segmentation |
|
Table of Contents
- 1. Introduction
- 1.1. Research Scope
- 1.2. Market Segmentation
- 1.3. Research Methodology
- 1.4. Definitions and Assumptions
- 2. Executive Summary
- 2.1. Introduction
- 3. Market Dynamics
- 3.1. Introduction
- 3.2. Market Drivers
- 3.3. Market Restrains
- 3.4. Market Trends
- 4. Market Factor Analysis
- 4.1. Porters Five Forces
- 4.2. Supply/Value Chain
- 4.3. PESTEL analysis
- 4.4. Market Entropy
- 4.5. Patent/Trademark Analysis
- 5. Global high-performance NAND Flash Memory Analysis, Insights and Forecast, 2020-2032
- 5.1. Market Analysis, Insights and Forecast - by Application
- 5.1.1. PC
- 5.1.2. SSD
- 5.1.3. Consumer Electronics
- 5.1.4. Others
- 5.2. Market Analysis, Insights and Forecast - by Types
- 5.2.1. Single-Level Cell (SLC) NAND
- 5.2.2. 3D NAND
- 5.2.3. Multi-Level Cell (MLC) NAND
- 5.2.4. Universal Flash Storage (UFS)
- 5.3. Market Analysis, Insights and Forecast - by Region
- 5.3.1. North America
- 5.3.2. South America
- 5.3.3. Europe
- 5.3.4. Middle East & Africa
- 5.3.5. Asia Pacific
- 5.1. Market Analysis, Insights and Forecast - by Application
- 6. North America high-performance NAND Flash Memory Analysis, Insights and Forecast, 2020-2032
- 6.1. Market Analysis, Insights and Forecast - by Application
- 6.1.1. PC
- 6.1.2. SSD
- 6.1.3. Consumer Electronics
- 6.1.4. Others
- 6.2. Market Analysis, Insights and Forecast - by Types
- 6.2.1. Single-Level Cell (SLC) NAND
- 6.2.2. 3D NAND
- 6.2.3. Multi-Level Cell (MLC) NAND
- 6.2.4. Universal Flash Storage (UFS)
- 6.1. Market Analysis, Insights and Forecast - by Application
- 7. South America high-performance NAND Flash Memory Analysis, Insights and Forecast, 2020-2032
- 7.1. Market Analysis, Insights and Forecast - by Application
- 7.1.1. PC
- 7.1.2. SSD
- 7.1.3. Consumer Electronics
- 7.1.4. Others
- 7.2. Market Analysis, Insights and Forecast - by Types
- 7.2.1. Single-Level Cell (SLC) NAND
- 7.2.2. 3D NAND
- 7.2.3. Multi-Level Cell (MLC) NAND
- 7.2.4. Universal Flash Storage (UFS)
- 7.1. Market Analysis, Insights and Forecast - by Application
- 8. Europe high-performance NAND Flash Memory Analysis, Insights and Forecast, 2020-2032
- 8.1. Market Analysis, Insights and Forecast - by Application
- 8.1.1. PC
- 8.1.2. SSD
- 8.1.3. Consumer Electronics
- 8.1.4. Others
- 8.2. Market Analysis, Insights and Forecast - by Types
- 8.2.1. Single-Level Cell (SLC) NAND
- 8.2.2. 3D NAND
- 8.2.3. Multi-Level Cell (MLC) NAND
- 8.2.4. Universal Flash Storage (UFS)
- 8.1. Market Analysis, Insights and Forecast - by Application
- 9. Middle East & Africa high-performance NAND Flash Memory Analysis, Insights and Forecast, 2020-2032
- 9.1. Market Analysis, Insights and Forecast - by Application
- 9.1.1. PC
- 9.1.2. SSD
- 9.1.3. Consumer Electronics
- 9.1.4. Others
- 9.2. Market Analysis, Insights and Forecast - by Types
- 9.2.1. Single-Level Cell (SLC) NAND
- 9.2.2. 3D NAND
- 9.2.3. Multi-Level Cell (MLC) NAND
- 9.2.4. Universal Flash Storage (UFS)
- 9.1. Market Analysis, Insights and Forecast - by Application
- 10. Asia Pacific high-performance NAND Flash Memory Analysis, Insights and Forecast, 2020-2032
- 10.1. Market Analysis, Insights and Forecast - by Application
- 10.1.1. PC
- 10.1.2. SSD
- 10.1.3. Consumer Electronics
- 10.1.4. Others
- 10.2. Market Analysis, Insights and Forecast - by Types
- 10.2.1. Single-Level Cell (SLC) NAND
- 10.2.2. 3D NAND
- 10.2.3. Multi-Level Cell (MLC) NAND
- 10.2.4. Universal Flash Storage (UFS)
- 10.1. Market Analysis, Insights and Forecast - by Application
- 11. Competitive Analysis
- 11.1. Global Market Share Analysis 2025
- 11.2. Company Profiles
- 11.2.1 Samsung
- 11.2.1.1. Overview
- 11.2.1.2. Products
- 11.2.1.3. SWOT Analysis
- 11.2.1.4. Recent Developments
- 11.2.1.5. Financials (Based on Availability)
- 11.2.2 Micron
- 11.2.2.1. Overview
- 11.2.2.2. Products
- 11.2.2.3. SWOT Analysis
- 11.2.2.4. Recent Developments
- 11.2.2.5. Financials (Based on Availability)
- 11.2.3 Cypress
- 11.2.3.1. Overview
- 11.2.3.2. Products
- 11.2.3.3. SWOT Analysis
- 11.2.3.4. Recent Developments
- 11.2.3.5. Financials (Based on Availability)
- 11.2.4 Kioxia
- 11.2.4.1. Overview
- 11.2.4.2. Products
- 11.2.4.3. SWOT Analysis
- 11.2.4.4. Recent Developments
- 11.2.4.5. Financials (Based on Availability)
- 11.2.5 WDC
- 11.2.5.1. Overview
- 11.2.5.2. Products
- 11.2.5.3. SWOT Analysis
- 11.2.5.4. Recent Developments
- 11.2.5.5. Financials (Based on Availability)
- 11.2.6 SK Hynix
- 11.2.6.1. Overview
- 11.2.6.2. Products
- 11.2.6.3. SWOT Analysis
- 11.2.6.4. Recent Developments
- 11.2.6.5. Financials (Based on Availability)
- 11.2.7 Intel
- 11.2.7.1. Overview
- 11.2.7.2. Products
- 11.2.7.3. SWOT Analysis
- 11.2.7.4. Recent Developments
- 11.2.7.5. Financials (Based on Availability)
- 11.2.8 Toshiba
- 11.2.8.1. Overview
- 11.2.8.2. Products
- 11.2.8.3. SWOT Analysis
- 11.2.8.4. Recent Developments
- 11.2.8.5. Financials (Based on Availability)
- 11.2.9 Winbond
- 11.2.9.1. Overview
- 11.2.9.2. Products
- 11.2.9.3. SWOT Analysis
- 11.2.9.4. Recent Developments
- 11.2.9.5. Financials (Based on Availability)
- 11.2.10 Macronix
- 11.2.10.1. Overview
- 11.2.10.2. Products
- 11.2.10.3. SWOT Analysis
- 11.2.10.4. Recent Developments
- 11.2.10.5. Financials (Based on Availability)
- 11.2.11 GigaDevice
- 11.2.11.1. Overview
- 11.2.11.2. Products
- 11.2.11.3. SWOT Analysis
- 11.2.11.4. Recent Developments
- 11.2.11.5. Financials (Based on Availability)
- 11.2.12 ATO Solution
- 11.2.12.1. Overview
- 11.2.12.2. Products
- 11.2.12.3. SWOT Analysis
- 11.2.12.4. Recent Developments
- 11.2.12.5. Financials (Based on Availability)
- 11.2.13 SkyHigh Memory
- 11.2.13.1. Overview
- 11.2.13.2. Products
- 11.2.13.3. SWOT Analysis
- 11.2.13.4. Recent Developments
- 11.2.13.5. Financials (Based on Availability)
- 11.2.14 SLC NAND
- 11.2.14.1. Overview
- 11.2.14.2. Products
- 11.2.14.3. SWOT Analysis
- 11.2.14.4. Recent Developments
- 11.2.14.5. Financials (Based on Availability)
- 11.2.15 Frontgrad
- 11.2.15.1. Overview
- 11.2.15.2. Products
- 11.2.15.3. SWOT Analysis
- 11.2.15.4. Recent Developments
- 11.2.15.5. Financials (Based on Availability)
- 11.2.1 Samsung
List of Figures
- Figure 1: Global high-performance NAND Flash Memory Revenue Breakdown (million, %) by Region 2025 & 2033
- Figure 2: North America high-performance NAND Flash Memory Revenue (million), by Application 2025 & 2033
- Figure 3: North America high-performance NAND Flash Memory Revenue Share (%), by Application 2025 & 2033
- Figure 4: North America high-performance NAND Flash Memory Revenue (million), by Types 2025 & 2033
- Figure 5: North America high-performance NAND Flash Memory Revenue Share (%), by Types 2025 & 2033
- Figure 6: North America high-performance NAND Flash Memory Revenue (million), by Country 2025 & 2033
- Figure 7: North America high-performance NAND Flash Memory Revenue Share (%), by Country 2025 & 2033
- Figure 8: South America high-performance NAND Flash Memory Revenue (million), by Application 2025 & 2033
- Figure 9: South America high-performance NAND Flash Memory Revenue Share (%), by Application 2025 & 2033
- Figure 10: South America high-performance NAND Flash Memory Revenue (million), by Types 2025 & 2033
- Figure 11: South America high-performance NAND Flash Memory Revenue Share (%), by Types 2025 & 2033
- Figure 12: South America high-performance NAND Flash Memory Revenue (million), by Country 2025 & 2033
- Figure 13: South America high-performance NAND Flash Memory Revenue Share (%), by Country 2025 & 2033
- Figure 14: Europe high-performance NAND Flash Memory Revenue (million), by Application 2025 & 2033
- Figure 15: Europe high-performance NAND Flash Memory Revenue Share (%), by Application 2025 & 2033
- Figure 16: Europe high-performance NAND Flash Memory Revenue (million), by Types 2025 & 2033
- Figure 17: Europe high-performance NAND Flash Memory Revenue Share (%), by Types 2025 & 2033
- Figure 18: Europe high-performance NAND Flash Memory Revenue (million), by Country 2025 & 2033
- Figure 19: Europe high-performance NAND Flash Memory Revenue Share (%), by Country 2025 & 2033
- Figure 20: Middle East & Africa high-performance NAND Flash Memory Revenue (million), by Application 2025 & 2033
- Figure 21: Middle East & Africa high-performance NAND Flash Memory Revenue Share (%), by Application 2025 & 2033
- Figure 22: Middle East & Africa high-performance NAND Flash Memory Revenue (million), by Types 2025 & 2033
- Figure 23: Middle East & Africa high-performance NAND Flash Memory Revenue Share (%), by Types 2025 & 2033
- Figure 24: Middle East & Africa high-performance NAND Flash Memory Revenue (million), by Country 2025 & 2033
- Figure 25: Middle East & Africa high-performance NAND Flash Memory Revenue Share (%), by Country 2025 & 2033
- Figure 26: Asia Pacific high-performance NAND Flash Memory Revenue (million), by Application 2025 & 2033
- Figure 27: Asia Pacific high-performance NAND Flash Memory Revenue Share (%), by Application 2025 & 2033
- Figure 28: Asia Pacific high-performance NAND Flash Memory Revenue (million), by Types 2025 & 2033
- Figure 29: Asia Pacific high-performance NAND Flash Memory Revenue Share (%), by Types 2025 & 2033
- Figure 30: Asia Pacific high-performance NAND Flash Memory Revenue (million), by Country 2025 & 2033
- Figure 31: Asia Pacific high-performance NAND Flash Memory Revenue Share (%), by Country 2025 & 2033
List of Tables
- Table 1: Global high-performance NAND Flash Memory Revenue million Forecast, by Application 2020 & 2033
- Table 2: Global high-performance NAND Flash Memory Revenue million Forecast, by Types 2020 & 2033
- Table 3: Global high-performance NAND Flash Memory Revenue million Forecast, by Region 2020 & 2033
- Table 4: Global high-performance NAND Flash Memory Revenue million Forecast, by Application 2020 & 2033
- Table 5: Global high-performance NAND Flash Memory Revenue million Forecast, by Types 2020 & 2033
- Table 6: Global high-performance NAND Flash Memory Revenue million Forecast, by Country 2020 & 2033
- Table 7: United States high-performance NAND Flash Memory Revenue (million) Forecast, by Application 2020 & 2033
- Table 8: Canada high-performance NAND Flash Memory Revenue (million) Forecast, by Application 2020 & 2033
- Table 9: Mexico high-performance NAND Flash Memory Revenue (million) Forecast, by Application 2020 & 2033
- Table 10: Global high-performance NAND Flash Memory Revenue million Forecast, by Application 2020 & 2033
- Table 11: Global high-performance NAND Flash Memory Revenue million Forecast, by Types 2020 & 2033
- Table 12: Global high-performance NAND Flash Memory Revenue million Forecast, by Country 2020 & 2033
- Table 13: Brazil high-performance NAND Flash Memory Revenue (million) Forecast, by Application 2020 & 2033
- Table 14: Argentina high-performance NAND Flash Memory Revenue (million) Forecast, by Application 2020 & 2033
- Table 15: Rest of South America high-performance NAND Flash Memory Revenue (million) Forecast, by Application 2020 & 2033
- Table 16: Global high-performance NAND Flash Memory Revenue million Forecast, by Application 2020 & 2033
- Table 17: Global high-performance NAND Flash Memory Revenue million Forecast, by Types 2020 & 2033
- Table 18: Global high-performance NAND Flash Memory Revenue million Forecast, by Country 2020 & 2033
- Table 19: United Kingdom high-performance NAND Flash Memory Revenue (million) Forecast, by Application 2020 & 2033
- Table 20: Germany high-performance NAND Flash Memory Revenue (million) Forecast, by Application 2020 & 2033
- Table 21: France high-performance NAND Flash Memory Revenue (million) Forecast, by Application 2020 & 2033
- Table 22: Italy high-performance NAND Flash Memory Revenue (million) Forecast, by Application 2020 & 2033
- Table 23: Spain high-performance NAND Flash Memory Revenue (million) Forecast, by Application 2020 & 2033
- Table 24: Russia high-performance NAND Flash Memory Revenue (million) Forecast, by Application 2020 & 2033
- Table 25: Benelux high-performance NAND Flash Memory Revenue (million) Forecast, by Application 2020 & 2033
- Table 26: Nordics high-performance NAND Flash Memory Revenue (million) Forecast, by Application 2020 & 2033
- Table 27: Rest of Europe high-performance NAND Flash Memory Revenue (million) Forecast, by Application 2020 & 2033
- Table 28: Global high-performance NAND Flash Memory Revenue million Forecast, by Application 2020 & 2033
- Table 29: Global high-performance NAND Flash Memory Revenue million Forecast, by Types 2020 & 2033
- Table 30: Global high-performance NAND Flash Memory Revenue million Forecast, by Country 2020 & 2033
- Table 31: Turkey high-performance NAND Flash Memory Revenue (million) Forecast, by Application 2020 & 2033
- Table 32: Israel high-performance NAND Flash Memory Revenue (million) Forecast, by Application 2020 & 2033
- Table 33: GCC high-performance NAND Flash Memory Revenue (million) Forecast, by Application 2020 & 2033
- Table 34: North Africa high-performance NAND Flash Memory Revenue (million) Forecast, by Application 2020 & 2033
- Table 35: South Africa high-performance NAND Flash Memory Revenue (million) Forecast, by Application 2020 & 2033
- Table 36: Rest of Middle East & Africa high-performance NAND Flash Memory Revenue (million) Forecast, by Application 2020 & 2033
- Table 37: Global high-performance NAND Flash Memory Revenue million Forecast, by Application 2020 & 2033
- Table 38: Global high-performance NAND Flash Memory Revenue million Forecast, by Types 2020 & 2033
- Table 39: Global high-performance NAND Flash Memory Revenue million Forecast, by Country 2020 & 2033
- Table 40: China high-performance NAND Flash Memory Revenue (million) Forecast, by Application 2020 & 2033
- Table 41: India high-performance NAND Flash Memory Revenue (million) Forecast, by Application 2020 & 2033
- Table 42: Japan high-performance NAND Flash Memory Revenue (million) Forecast, by Application 2020 & 2033
- Table 43: South Korea high-performance NAND Flash Memory Revenue (million) Forecast, by Application 2020 & 2033
- Table 44: ASEAN high-performance NAND Flash Memory Revenue (million) Forecast, by Application 2020 & 2033
- Table 45: Oceania high-performance NAND Flash Memory Revenue (million) Forecast, by Application 2020 & 2033
- Table 46: Rest of Asia Pacific high-performance NAND Flash Memory Revenue (million) Forecast, by Application 2020 & 2033
Frequently Asked Questions
1. What is the projected Compound Annual Growth Rate (CAGR) of the high-performance NAND Flash Memory?
The projected CAGR is approximately XX%.
2. Which companies are prominent players in the high-performance NAND Flash Memory?
Key companies in the market include Samsung, Micron, Cypress, Kioxia, WDC, SK Hynix, Intel, Toshiba, Winbond, Macronix, GigaDevice, ATO Solution, SkyHigh Memory, SLC NAND, Frontgrad.
3. What are the main segments of the high-performance NAND Flash Memory?
The market segments include Application, Types.
4. Can you provide details about the market size?
The market size is estimated to be USD XXX million as of 2022.
5. What are some drivers contributing to market growth?
N/A
6. What are the notable trends driving market growth?
N/A
7. Are there any restraints impacting market growth?
N/A
8. Can you provide examples of recent developments in the market?
N/A
9. What pricing options are available for accessing the report?
Pricing options include single-user, multi-user, and enterprise licenses priced at USD 2900.00, USD 4350.00, and USD 5800.00 respectively.
10. Is the market size provided in terms of value or volume?
The market size is provided in terms of value, measured in million.
11. Are there any specific market keywords associated with the report?
Yes, the market keyword associated with the report is "high-performance NAND Flash Memory," which aids in identifying and referencing the specific market segment covered.
12. How do I determine which pricing option suits my needs best?
The pricing options vary based on user requirements and access needs. Individual users may opt for single-user licenses, while businesses requiring broader access may choose multi-user or enterprise licenses for cost-effective access to the report.
13. Are there any additional resources or data provided in the high-performance NAND Flash Memory report?
While the report offers comprehensive insights, it's advisable to review the specific contents or supplementary materials provided to ascertain if additional resources or data are available.
14. How can I stay updated on further developments or reports in the high-performance NAND Flash Memory?
To stay informed about further developments, trends, and reports in the high-performance NAND Flash Memory, consider subscribing to industry newsletters, following relevant companies and organizations, or regularly checking reputable industry news sources and publications.
Methodology
Step 1 - Identification of Relevant Samples Size from Population Database


Step 2 - Approaches for Defining Global Market Size (Value, Volume* & Price*)

Note*: In applicable scenarios
Step 3 - Data Sources
Primary Research
- Web Analytics
- Survey Reports
- Research Institute
- Latest Research Reports
- Opinion Leaders
Secondary Research
- Annual Reports
- White Paper
- Latest Press Release
- Industry Association
- Paid Database
- Investor Presentations

Step 4 - Data Triangulation
Involves using different sources of information in order to increase the validity of a study
These sources are likely to be stakeholders in a program - participants, other researchers, program staff, other community members, and so on.
Then we put all data in single framework & apply various statistical tools to find out the dynamic on the market.
During the analysis stage, feedback from the stakeholder groups would be compared to determine areas of agreement as well as areas of divergence