

Key Insights
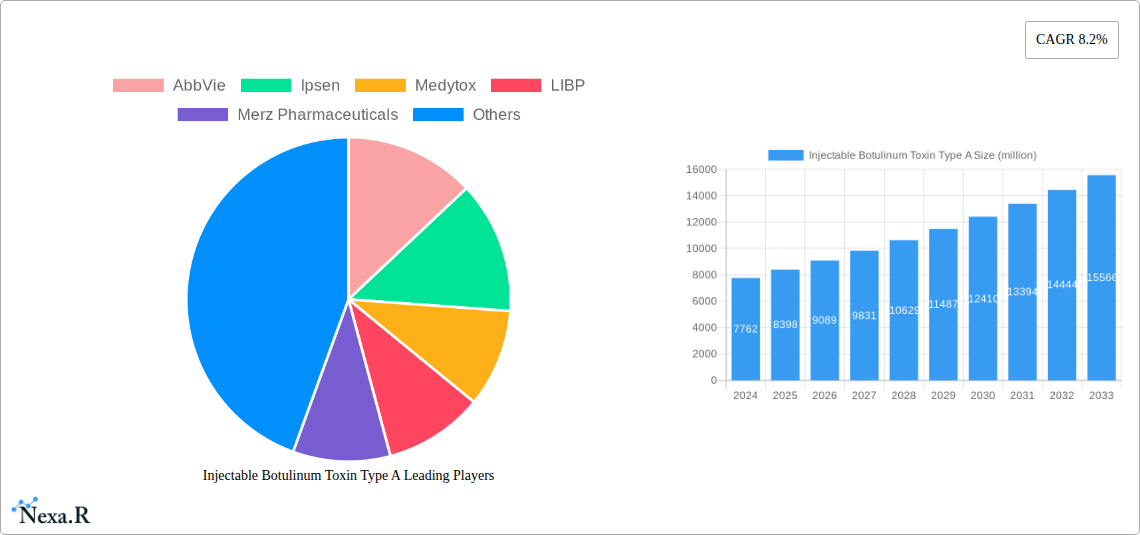
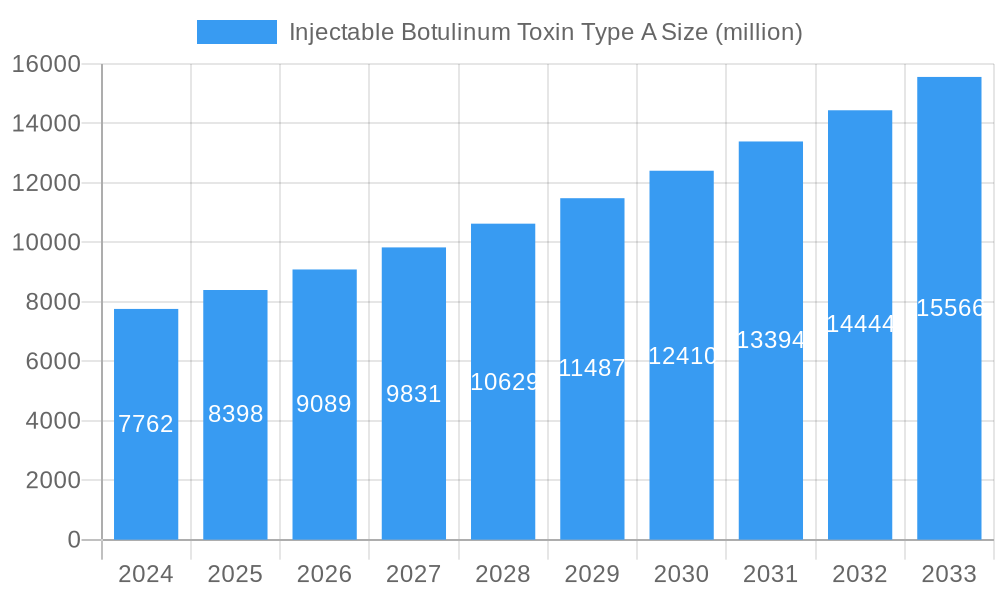
The global market for Injectable Botulinum Toxin Type A is poised for substantial growth, projected to reach an estimated USD 8,398 million by 2025. This expansion is driven by a confluence of factors, including the increasing prevalence of aesthetic procedures, a growing awareness of therapeutic applications, and advancements in product development. The market is anticipated to witness a robust Compound Annual Growth Rate (CAGR) of 8.2% throughout the forecast period from 2025 to 2033. Key applications within this market span both the Medical and Cosmetic sectors. In the cosmetic realm, the demand for non-surgical rejuvenation treatments like wrinkle reduction remains a primary driver. Medically, botulinum toxin is increasingly utilized for conditions such as blepharospasm, strabismus, muscle spasticity, and chronic migraine, contributing significantly to market value. The availability of different product concentrations, such as 50IU/Vial and 100IU/Vial, caters to diverse treatment needs, while an "Other" category likely encompasses specialized formulations and emerging applications.
Injectable Botulinum Toxin Type A Market Size (In Billion)
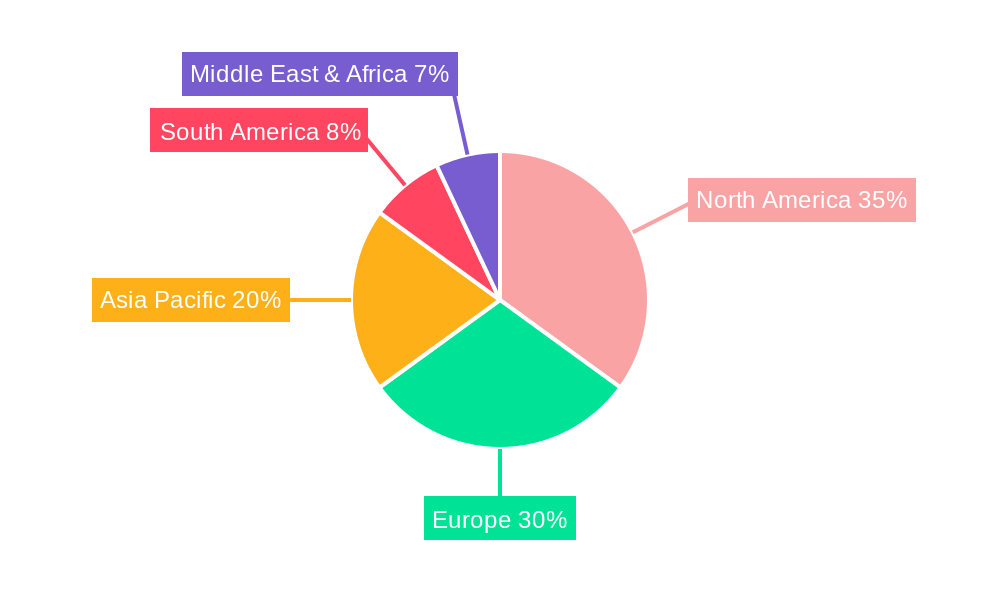
The competitive landscape features prominent global players including AbbVie, Ipsen, Medytox, LIBP, Merz Pharmaceuticals, Hugel, and Daewoong. These companies are actively engaged in research and development, seeking to expand the therapeutic applications of botulinum toxin and enhance the efficacy and safety of their existing products. Regional dynamics indicate a strong presence in North America and Europe, driven by high disposable incomes, advanced healthcare infrastructure, and a well-established culture of aesthetic procedures. However, the Asia Pacific region is emerging as a high-growth market, fueled by a burgeoning middle class, increasing aesthetic consciousness, and expanding access to minimally invasive treatments. While the market benefits from rising demand, potential restraints could include stringent regulatory approvals, the high cost of treatments for some patient populations, and the emergence of alternative therapies. Nevertheless, the overall outlook for Injectable Botulinum Toxin Type A remains highly positive, underscoring its critical role in both aesthetic enhancement and therapeutic interventions.
Injectable Botulinum Toxin Type A Company Market Share
Injectable Botulinum Toxin Type A Market Dynamics & Structure
The global injectable botulinum toxin type A market is characterized by moderate to high concentration, with a few dominant players holding significant market share. Technological innovation, particularly in enhancing efficacy, duration of action, and developing new therapeutic applications, serves as a key driver. Stringent regulatory frameworks, primarily overseen by bodies like the FDA and EMA, dictate product approval and market access, acting as both a quality assurance mechanism and a barrier to entry for new entrants. The competitive landscape includes a range of botulinum toxin products, as well as alternative treatments for cosmetic and medical conditions, such as dermal fillers and surgical procedures. End-user demographics are expanding beyond traditional cosmetic users to include a growing segment of patients seeking treatments for neurological disorders and pain management. Mergers and acquisitions (M&A) are notable, with companies strategically acquiring smaller players or complementary technologies to consolidate market position and expand their product portfolios. For instance, the acquisition of Allergan by AbbVie significantly reshaped the market landscape.
- Market Concentration: Dominated by a handful of key players, with a significant portion of the market held by the top 3-5 companies.
- Technological Innovation Drivers: Focus on improved patient outcomes, longer-lasting effects, and novel medical applications.
- Regulatory Frameworks: Strict approval processes ensure safety and efficacy, influencing R&D investments and market entry.
- Competitive Product Substitutes: Dermal fillers, laser treatments, and surgical interventions offer alternative solutions in the cosmetic segment.
- End-User Demographics: Growing adoption among both cosmetic and medical patients, including a rising male demographic for cosmetic treatments.
- M&A Trends: Strategic acquisitions to gain market share, acquire novel technologies, and expand geographical reach.
Injectable Botulinum Toxin Type A Growth Trends & Insights
The global injectable botulinum toxin type A market is poised for substantial growth, driven by an escalating demand for aesthetic procedures and an expanding array of therapeutic applications. The market size is projected to witness a robust Compound Annual Growth Rate (CAGR) of approximately 8.5% from 2025 to 2033. This growth trajectory is underpinned by increasing consumer awareness and acceptance of minimally invasive cosmetic treatments, fueled by social media influence and the desire for anti-aging solutions. In the medical domain, a significant driver is the growing prevalence of neurological disorders such as blepharospasm, cervical dystonia, and strabismus, for which botulinum toxin is a well-established treatment. Furthermore, research into new therapeutic uses, including chronic migraine, overactive bladder, and spasticity, is continuously broadening the market's scope.
Technological advancements are playing a pivotal role, with ongoing efforts to develop botulinum toxin formulations that offer improved efficacy, longer duration of action, and enhanced patient comfort. The introduction of novel delivery systems and improved manufacturing processes are also contributing to market expansion. Consumer behavior is shifting towards a preference for non-surgical and less invasive procedures, making botulinum toxin injections an attractive option. The younger demographic is increasingly participating in preventive aesthetic treatments, further boosting adoption rates. Market penetration is high in developed economies, with significant growth potential identified in emerging markets due to rising disposable incomes and increasing healthcare infrastructure. The base year of 2025 marks a period of consolidation and innovation, with the forecast period from 2025 to 2033 expected to witness accelerated adoption and diversification of applications. Historical data from 2019-2024 indicates a steady upward trend, setting a strong foundation for future expansion. The total market value for injectable botulinum toxin type A in 2025 is estimated to be around $7.8 billion, with projections reaching approximately $14.5 billion by 2033. This growth is influenced by a growing preference for treatments that offer a natural-looking aesthetic, alongside the continued efficacy in treating medical conditions. The market is also experiencing a rise in the use of smaller vial sizes for specific medical indications, driving demand for diverse product offerings.
Dominant Regions, Countries, or Segments in Injectable Botulinum Toxin Type A
The global injectable botulinum toxin type A market is significantly influenced by the dominance of the Cosmetic application segment, which consistently drives market growth and accounts for the largest share of revenue. This dominance is particularly pronounced in North America and Europe, regions with high disposable incomes, advanced aesthetic consciousness, and a well-established infrastructure for cosmetic procedures. The United States stands out as the leading country, driven by a high demand for anti-aging treatments and a robust network of skilled practitioners.
Key drivers for the dominance of the cosmetic segment include:
- Rising Aesthetic Consciousness: Growing societal acceptance and pursuit of youthful appearances.
- Technological Advancements: Development of more refined and natural-looking results.
- Minimally Invasive Appeal: Preference for non-surgical procedures with minimal downtime.
- Influencer Marketing & Social Media: Increased visibility and promotion of aesthetic treatments.
Within the cosmetic segment, the 100IU/Vial type is the most prevalent due to its versatility in treating larger facial areas and its cost-effectiveness for common procedures like frown lines and crow's feet. However, the 50IU/Vial is gaining traction for more targeted treatments and for practitioners who prefer to manage dosages precisely for individual patient needs, contributing to the overall growth of the segment.
The medical application segment, while smaller, is experiencing significant growth due to the expanding therapeutic indications and an aging global population. Countries in North America and Europe also lead in the medical application segment due to advanced healthcare systems and a higher diagnosis rate of conditions treated by botulinum toxin. Asia-Pacific is emerging as a key growth region for both cosmetic and medical applications, driven by increasing disposable incomes, growing awareness, and a large population base.
- Dominant Segment: Cosmetic Application
- Leading Region: North America
- Leading Country: United States
- Key Drivers in Cosmetic Segment: Increasing disposable income, rising demand for anti-aging treatments, and the growing popularity of minimally invasive procedures.
- Prevalent Product Type in Cosmetic: 100IU/Vial
- Emerging Product Type in Cosmetic: 50IU/Vial for targeted treatments.
- Growth Drivers in Medical Segment: Expanding therapeutic indications (chronic migraine, overactive bladder), aging population, and increased diagnosis rates.
- Emerging Growth Region: Asia-Pacific.
Injectable Botulinum Toxin Type A Product Landscape
The injectable botulinum toxin type A product landscape is characterized by continuous innovation focused on enhancing efficacy, duration of action, and safety profiles. Leading products offer distinct formulations catering to both cosmetic and medical applications, with variations in potency such as 50IU/Vial and 100IU/Vial being standard. Innovations include improved purification techniques and the development of novel delivery systems to optimize patient experience and treatment outcomes. Companies are also exploring new therapeutic indications, pushing the boundaries beyond established uses in wrinkles and neurological disorders to address conditions like hyperhidrosis and muscle spasticity. The performance metrics of these products, such as onset of action, duration of effect, and side effect profiles, are key differentiators in the competitive market.
Key Drivers, Barriers & Challenges in Injectable Botulinum Toxin Type A
Key Drivers:
The injectable botulinum toxin type A market is propelled by several key drivers. The burgeoning demand for aesthetic procedures, fueled by an aging global population and a growing desire for anti-aging solutions, is a primary growth engine. Technological advancements leading to improved product efficacy and duration of action further stimulate adoption. Furthermore, the expanding therapeutic applications in neurology, such as the treatment of chronic migraines and muscle spasticity, are opening new revenue streams and increasing market penetration.
Barriers & Challenges:
Despite robust growth, the market faces significant barriers and challenges. Stringent regulatory approvals and the high cost of R&D for new applications present a substantial barrier to entry for smaller companies. Competitive pressures from both established players and emerging biosimil products can impact pricing strategies and market share. Supply chain disruptions, particularly for specialized biological products, can lead to availability issues. Moreover, potential adverse events and the need for highly skilled practitioners to administer treatments safely and effectively remain critical considerations.
Emerging Opportunities in Injectable Botulinum Toxin Type A
Emerging opportunities in the injectable botulinum toxin type A market lie in the untapped potential of new therapeutic indications and expanding geographical markets. The exploration of botulinum toxin for conditions such as depression, rosacea, and certain types of pain disorders presents significant growth avenues. Furthermore, the increasing disposable incomes and growing awareness of aesthetic treatments in emerging economies in Asia-Pacific and Latin America offer substantial market expansion potential. The development of more patient-friendly delivery methods, such as needle-free applications, could also revolutionize accessibility and adoption.
Growth Accelerators in the Injectable Botulinum Toxin Type A Industry
Several catalysts are accelerating growth in the injectable botulinum toxin type A industry. Continuous innovation in product formulations, aiming for longer-lasting effects and reduced side effects, is a major accelerator. Strategic partnerships and collaborations between pharmaceutical companies and research institutions are speeding up the discovery and development of novel therapeutic applications. The increasing global acceptance and de-stigmatization of cosmetic procedures, coupled with targeted marketing campaigns by key players, are also driving significant market expansion. Furthermore, favorable reimbursement policies for certain medical indications are boosting demand.
Key Players Shaping the Injectable Botulinum Toxin Type A Market
- AbbVie
- Ipsen
- Medytox
- LIBP
- Merz Pharmaceuticals
- Hugel
- Daewoong
Notable Milestones in Injectable Botulinum Toxin Type A Sector
- 2019: FDA approval for Xeomin (incobotulinumtoxinA) for the treatment of upper limb spasticity.
- 2020: Ipsen receives expanded FDA approval for Dysport (abobotulinumtoxinA) for the treatment of cervical dystonia in adolescent patients.
- 2021: Merz Pharmaceuticals launches Xeomin for the cosmetic treatment of glabellar lines in specific European markets.
- 2022: Hugel secures approval for its botulinum toxin product, Botulax, in additional key international markets.
- 2023: Daewoong Pharmaceutical announces promising results from clinical trials for a new botulinum toxin formulation targeting aesthetic applications.
- 2024: Medytox continues to expand its global manufacturing capacity to meet growing demand for its botulinum toxin products.
In-Depth Injectable Botulinum Toxin Type A Market Outlook
The injectable botulinum toxin type A market is set for sustained and robust expansion, driven by both its established cosmetic applications and its burgeoning role in medical treatments. Future growth will be significantly influenced by ongoing research into new therapeutic indications, which promises to unlock substantial unmet medical needs and create new market segments. Strategic investments in R&D for novel formulations with enhanced efficacy and patient convenience, alongside aggressive market penetration strategies in emerging economies, will be crucial for sustained leadership. The industry's ability to navigate evolving regulatory landscapes and address supply chain complexities will also shape its trajectory, ensuring continued innovation and accessibility.
Injectable Botulinum Toxin Type A Segmentation
-
1. Application
- 1.1. Medical
- 1.2. Cosmetic
-
2. Types
- 2.1. 50IU/Vial
- 2.2. 100IU/Vial
- 2.3. Other
Injectable Botulinum Toxin Type A Segmentation By Geography
-
1. North America
- 1.1. United States
- 1.2. Canada
- 1.3. Mexico
-
2. South America
- 2.1. Brazil
- 2.2. Argentina
- 2.3. Rest of South America
-
3. Europe
- 3.1. United Kingdom
- 3.2. Germany
- 3.3. France
- 3.4. Italy
- 3.5. Spain
- 3.6. Russia
- 3.7. Benelux
- 3.8. Nordics
- 3.9. Rest of Europe
-
4. Middle East & Africa
- 4.1. Turkey
- 4.2. Israel
- 4.3. GCC
- 4.4. North Africa
- 4.5. South Africa
- 4.6. Rest of Middle East & Africa
-
5. Asia Pacific
- 5.1. China
- 5.2. India
- 5.3. Japan
- 5.4. South Korea
- 5.5. ASEAN
- 5.6. Oceania
- 5.7. Rest of Asia Pacific
Injectable Botulinum Toxin Type A Regional Market Share
Geographic Coverage of Injectable Botulinum Toxin Type A
Injectable Botulinum Toxin Type A REPORT HIGHLIGHTS
| Aspects | Details |
|---|---|
| Study Period | 2020-2034 |
| Base Year | 2025 |
| Estimated Year | 2026 |
| Forecast Period | 2026-2034 |
| Historical Period | 2020-2025 |
| Growth Rate | CAGR of 8.2% from 2020-2034 |
| Segmentation |
|
Table of Contents
- 1. Introduction
- 1.1. Research Scope
- 1.2. Market Segmentation
- 1.3. Research Methodology
- 1.4. Definitions and Assumptions
- 2. Executive Summary
- 2.1. Introduction
- 3. Market Dynamics
- 3.1. Introduction
- 3.2. Market Drivers
- 3.3. Market Restrains
- 3.4. Market Trends
- 4. Market Factor Analysis
- 4.1. Porters Five Forces
- 4.2. Supply/Value Chain
- 4.3. PESTEL analysis
- 4.4. Market Entropy
- 4.5. Patent/Trademark Analysis
- 5. Global Injectable Botulinum Toxin Type A Analysis, Insights and Forecast, 2020-2032
- 5.1. Market Analysis, Insights and Forecast - by Application
- 5.1.1. Medical
- 5.1.2. Cosmetic
- 5.2. Market Analysis, Insights and Forecast - by Types
- 5.2.1. 50IU/Vial
- 5.2.2. 100IU/Vial
- 5.2.3. Other
- 5.3. Market Analysis, Insights and Forecast - by Region
- 5.3.1. North America
- 5.3.2. South America
- 5.3.3. Europe
- 5.3.4. Middle East & Africa
- 5.3.5. Asia Pacific
- 5.1. Market Analysis, Insights and Forecast - by Application
- 6. North America Injectable Botulinum Toxin Type A Analysis, Insights and Forecast, 2020-2032
- 6.1. Market Analysis, Insights and Forecast - by Application
- 6.1.1. Medical
- 6.1.2. Cosmetic
- 6.2. Market Analysis, Insights and Forecast - by Types
- 6.2.1. 50IU/Vial
- 6.2.2. 100IU/Vial
- 6.2.3. Other
- 6.1. Market Analysis, Insights and Forecast - by Application
- 7. South America Injectable Botulinum Toxin Type A Analysis, Insights and Forecast, 2020-2032
- 7.1. Market Analysis, Insights and Forecast - by Application
- 7.1.1. Medical
- 7.1.2. Cosmetic
- 7.2. Market Analysis, Insights and Forecast - by Types
- 7.2.1. 50IU/Vial
- 7.2.2. 100IU/Vial
- 7.2.3. Other
- 7.1. Market Analysis, Insights and Forecast - by Application
- 8. Europe Injectable Botulinum Toxin Type A Analysis, Insights and Forecast, 2020-2032
- 8.1. Market Analysis, Insights and Forecast - by Application
- 8.1.1. Medical
- 8.1.2. Cosmetic
- 8.2. Market Analysis, Insights and Forecast - by Types
- 8.2.1. 50IU/Vial
- 8.2.2. 100IU/Vial
- 8.2.3. Other
- 8.1. Market Analysis, Insights and Forecast - by Application
- 9. Middle East & Africa Injectable Botulinum Toxin Type A Analysis, Insights and Forecast, 2020-2032
- 9.1. Market Analysis, Insights and Forecast - by Application
- 9.1.1. Medical
- 9.1.2. Cosmetic
- 9.2. Market Analysis, Insights and Forecast - by Types
- 9.2.1. 50IU/Vial
- 9.2.2. 100IU/Vial
- 9.2.3. Other
- 9.1. Market Analysis, Insights and Forecast - by Application
- 10. Asia Pacific Injectable Botulinum Toxin Type A Analysis, Insights and Forecast, 2020-2032
- 10.1. Market Analysis, Insights and Forecast - by Application
- 10.1.1. Medical
- 10.1.2. Cosmetic
- 10.2. Market Analysis, Insights and Forecast - by Types
- 10.2.1. 50IU/Vial
- 10.2.2. 100IU/Vial
- 10.2.3. Other
- 10.1. Market Analysis, Insights and Forecast - by Application
- 11. Competitive Analysis
- 11.1. Global Market Share Analysis 2025
- 11.2. Company Profiles
- 11.2.1 AbbVie
- 11.2.1.1. Overview
- 11.2.1.2. Products
- 11.2.1.3. SWOT Analysis
- 11.2.1.4. Recent Developments
- 11.2.1.5. Financials (Based on Availability)
- 11.2.2 Ipsen
- 11.2.2.1. Overview
- 11.2.2.2. Products
- 11.2.2.3. SWOT Analysis
- 11.2.2.4. Recent Developments
- 11.2.2.5. Financials (Based on Availability)
- 11.2.3 Medytox
- 11.2.3.1. Overview
- 11.2.3.2. Products
- 11.2.3.3. SWOT Analysis
- 11.2.3.4. Recent Developments
- 11.2.3.5. Financials (Based on Availability)
- 11.2.4 LIBP
- 11.2.4.1. Overview
- 11.2.4.2. Products
- 11.2.4.3. SWOT Analysis
- 11.2.4.4. Recent Developments
- 11.2.4.5. Financials (Based on Availability)
- 11.2.5 Merz Pharmaceuticals
- 11.2.5.1. Overview
- 11.2.5.2. Products
- 11.2.5.3. SWOT Analysis
- 11.2.5.4. Recent Developments
- 11.2.5.5. Financials (Based on Availability)
- 11.2.6 Hugel
- 11.2.6.1. Overview
- 11.2.6.2. Products
- 11.2.6.3. SWOT Analysis
- 11.2.6.4. Recent Developments
- 11.2.6.5. Financials (Based on Availability)
- 11.2.7 Daewoong
- 11.2.7.1. Overview
- 11.2.7.2. Products
- 11.2.7.3. SWOT Analysis
- 11.2.7.4. Recent Developments
- 11.2.7.5. Financials (Based on Availability)
- 11.2.1 AbbVie
List of Figures
- Figure 1: Global Injectable Botulinum Toxin Type A Revenue Breakdown (million, %) by Region 2025 & 2033
- Figure 2: Global Injectable Botulinum Toxin Type A Volume Breakdown (K, %) by Region 2025 & 2033
- Figure 3: North America Injectable Botulinum Toxin Type A Revenue (million), by Application 2025 & 2033
- Figure 4: North America Injectable Botulinum Toxin Type A Volume (K), by Application 2025 & 2033
- Figure 5: North America Injectable Botulinum Toxin Type A Revenue Share (%), by Application 2025 & 2033
- Figure 6: North America Injectable Botulinum Toxin Type A Volume Share (%), by Application 2025 & 2033
- Figure 7: North America Injectable Botulinum Toxin Type A Revenue (million), by Types 2025 & 2033
- Figure 8: North America Injectable Botulinum Toxin Type A Volume (K), by Types 2025 & 2033
- Figure 9: North America Injectable Botulinum Toxin Type A Revenue Share (%), by Types 2025 & 2033
- Figure 10: North America Injectable Botulinum Toxin Type A Volume Share (%), by Types 2025 & 2033
- Figure 11: North America Injectable Botulinum Toxin Type A Revenue (million), by Country 2025 & 2033
- Figure 12: North America Injectable Botulinum Toxin Type A Volume (K), by Country 2025 & 2033
- Figure 13: North America Injectable Botulinum Toxin Type A Revenue Share (%), by Country 2025 & 2033
- Figure 14: North America Injectable Botulinum Toxin Type A Volume Share (%), by Country 2025 & 2033
- Figure 15: South America Injectable Botulinum Toxin Type A Revenue (million), by Application 2025 & 2033
- Figure 16: South America Injectable Botulinum Toxin Type A Volume (K), by Application 2025 & 2033
- Figure 17: South America Injectable Botulinum Toxin Type A Revenue Share (%), by Application 2025 & 2033
- Figure 18: South America Injectable Botulinum Toxin Type A Volume Share (%), by Application 2025 & 2033
- Figure 19: South America Injectable Botulinum Toxin Type A Revenue (million), by Types 2025 & 2033
- Figure 20: South America Injectable Botulinum Toxin Type A Volume (K), by Types 2025 & 2033
- Figure 21: South America Injectable Botulinum Toxin Type A Revenue Share (%), by Types 2025 & 2033
- Figure 22: South America Injectable Botulinum Toxin Type A Volume Share (%), by Types 2025 & 2033
- Figure 23: South America Injectable Botulinum Toxin Type A Revenue (million), by Country 2025 & 2033
- Figure 24: South America Injectable Botulinum Toxin Type A Volume (K), by Country 2025 & 2033
- Figure 25: South America Injectable Botulinum Toxin Type A Revenue Share (%), by Country 2025 & 2033
- Figure 26: South America Injectable Botulinum Toxin Type A Volume Share (%), by Country 2025 & 2033
- Figure 27: Europe Injectable Botulinum Toxin Type A Revenue (million), by Application 2025 & 2033
- Figure 28: Europe Injectable Botulinum Toxin Type A Volume (K), by Application 2025 & 2033
- Figure 29: Europe Injectable Botulinum Toxin Type A Revenue Share (%), by Application 2025 & 2033
- Figure 30: Europe Injectable Botulinum Toxin Type A Volume Share (%), by Application 2025 & 2033
- Figure 31: Europe Injectable Botulinum Toxin Type A Revenue (million), by Types 2025 & 2033
- Figure 32: Europe Injectable Botulinum Toxin Type A Volume (K), by Types 2025 & 2033
- Figure 33: Europe Injectable Botulinum Toxin Type A Revenue Share (%), by Types 2025 & 2033
- Figure 34: Europe Injectable Botulinum Toxin Type A Volume Share (%), by Types 2025 & 2033
- Figure 35: Europe Injectable Botulinum Toxin Type A Revenue (million), by Country 2025 & 2033
- Figure 36: Europe Injectable Botulinum Toxin Type A Volume (K), by Country 2025 & 2033
- Figure 37: Europe Injectable Botulinum Toxin Type A Revenue Share (%), by Country 2025 & 2033
- Figure 38: Europe Injectable Botulinum Toxin Type A Volume Share (%), by Country 2025 & 2033
- Figure 39: Middle East & Africa Injectable Botulinum Toxin Type A Revenue (million), by Application 2025 & 2033
- Figure 40: Middle East & Africa Injectable Botulinum Toxin Type A Volume (K), by Application 2025 & 2033
- Figure 41: Middle East & Africa Injectable Botulinum Toxin Type A Revenue Share (%), by Application 2025 & 2033
- Figure 42: Middle East & Africa Injectable Botulinum Toxin Type A Volume Share (%), by Application 2025 & 2033
- Figure 43: Middle East & Africa Injectable Botulinum Toxin Type A Revenue (million), by Types 2025 & 2033
- Figure 44: Middle East & Africa Injectable Botulinum Toxin Type A Volume (K), by Types 2025 & 2033
- Figure 45: Middle East & Africa Injectable Botulinum Toxin Type A Revenue Share (%), by Types 2025 & 2033
- Figure 46: Middle East & Africa Injectable Botulinum Toxin Type A Volume Share (%), by Types 2025 & 2033
- Figure 47: Middle East & Africa Injectable Botulinum Toxin Type A Revenue (million), by Country 2025 & 2033
- Figure 48: Middle East & Africa Injectable Botulinum Toxin Type A Volume (K), by Country 2025 & 2033
- Figure 49: Middle East & Africa Injectable Botulinum Toxin Type A Revenue Share (%), by Country 2025 & 2033
- Figure 50: Middle East & Africa Injectable Botulinum Toxin Type A Volume Share (%), by Country 2025 & 2033
- Figure 51: Asia Pacific Injectable Botulinum Toxin Type A Revenue (million), by Application 2025 & 2033
- Figure 52: Asia Pacific Injectable Botulinum Toxin Type A Volume (K), by Application 2025 & 2033
- Figure 53: Asia Pacific Injectable Botulinum Toxin Type A Revenue Share (%), by Application 2025 & 2033
- Figure 54: Asia Pacific Injectable Botulinum Toxin Type A Volume Share (%), by Application 2025 & 2033
- Figure 55: Asia Pacific Injectable Botulinum Toxin Type A Revenue (million), by Types 2025 & 2033
- Figure 56: Asia Pacific Injectable Botulinum Toxin Type A Volume (K), by Types 2025 & 2033
- Figure 57: Asia Pacific Injectable Botulinum Toxin Type A Revenue Share (%), by Types 2025 & 2033
- Figure 58: Asia Pacific Injectable Botulinum Toxin Type A Volume Share (%), by Types 2025 & 2033
- Figure 59: Asia Pacific Injectable Botulinum Toxin Type A Revenue (million), by Country 2025 & 2033
- Figure 60: Asia Pacific Injectable Botulinum Toxin Type A Volume (K), by Country 2025 & 2033
- Figure 61: Asia Pacific Injectable Botulinum Toxin Type A Revenue Share (%), by Country 2025 & 2033
- Figure 62: Asia Pacific Injectable Botulinum Toxin Type A Volume Share (%), by Country 2025 & 2033
List of Tables
- Table 1: Global Injectable Botulinum Toxin Type A Revenue million Forecast, by Application 2020 & 2033
- Table 2: Global Injectable Botulinum Toxin Type A Volume K Forecast, by Application 2020 & 2033
- Table 3: Global Injectable Botulinum Toxin Type A Revenue million Forecast, by Types 2020 & 2033
- Table 4: Global Injectable Botulinum Toxin Type A Volume K Forecast, by Types 2020 & 2033
- Table 5: Global Injectable Botulinum Toxin Type A Revenue million Forecast, by Region 2020 & 2033
- Table 6: Global Injectable Botulinum Toxin Type A Volume K Forecast, by Region 2020 & 2033
- Table 7: Global Injectable Botulinum Toxin Type A Revenue million Forecast, by Application 2020 & 2033
- Table 8: Global Injectable Botulinum Toxin Type A Volume K Forecast, by Application 2020 & 2033
- Table 9: Global Injectable Botulinum Toxin Type A Revenue million Forecast, by Types 2020 & 2033
- Table 10: Global Injectable Botulinum Toxin Type A Volume K Forecast, by Types 2020 & 2033
- Table 11: Global Injectable Botulinum Toxin Type A Revenue million Forecast, by Country 2020 & 2033
- Table 12: Global Injectable Botulinum Toxin Type A Volume K Forecast, by Country 2020 & 2033
- Table 13: United States Injectable Botulinum Toxin Type A Revenue (million) Forecast, by Application 2020 & 2033
- Table 14: United States Injectable Botulinum Toxin Type A Volume (K) Forecast, by Application 2020 & 2033
- Table 15: Canada Injectable Botulinum Toxin Type A Revenue (million) Forecast, by Application 2020 & 2033
- Table 16: Canada Injectable Botulinum Toxin Type A Volume (K) Forecast, by Application 2020 & 2033
- Table 17: Mexico Injectable Botulinum Toxin Type A Revenue (million) Forecast, by Application 2020 & 2033
- Table 18: Mexico Injectable Botulinum Toxin Type A Volume (K) Forecast, by Application 2020 & 2033
- Table 19: Global Injectable Botulinum Toxin Type A Revenue million Forecast, by Application 2020 & 2033
- Table 20: Global Injectable Botulinum Toxin Type A Volume K Forecast, by Application 2020 & 2033
- Table 21: Global Injectable Botulinum Toxin Type A Revenue million Forecast, by Types 2020 & 2033
- Table 22: Global Injectable Botulinum Toxin Type A Volume K Forecast, by Types 2020 & 2033
- Table 23: Global Injectable Botulinum Toxin Type A Revenue million Forecast, by Country 2020 & 2033
- Table 24: Global Injectable Botulinum Toxin Type A Volume K Forecast, by Country 2020 & 2033
- Table 25: Brazil Injectable Botulinum Toxin Type A Revenue (million) Forecast, by Application 2020 & 2033
- Table 26: Brazil Injectable Botulinum Toxin Type A Volume (K) Forecast, by Application 2020 & 2033
- Table 27: Argentina Injectable Botulinum Toxin Type A Revenue (million) Forecast, by Application 2020 & 2033
- Table 28: Argentina Injectable Botulinum Toxin Type A Volume (K) Forecast, by Application 2020 & 2033
- Table 29: Rest of South America Injectable Botulinum Toxin Type A Revenue (million) Forecast, by Application 2020 & 2033
- Table 30: Rest of South America Injectable Botulinum Toxin Type A Volume (K) Forecast, by Application 2020 & 2033
- Table 31: Global Injectable Botulinum Toxin Type A Revenue million Forecast, by Application 2020 & 2033
- Table 32: Global Injectable Botulinum Toxin Type A Volume K Forecast, by Application 2020 & 2033
- Table 33: Global Injectable Botulinum Toxin Type A Revenue million Forecast, by Types 2020 & 2033
- Table 34: Global Injectable Botulinum Toxin Type A Volume K Forecast, by Types 2020 & 2033
- Table 35: Global Injectable Botulinum Toxin Type A Revenue million Forecast, by Country 2020 & 2033
- Table 36: Global Injectable Botulinum Toxin Type A Volume K Forecast, by Country 2020 & 2033
- Table 37: United Kingdom Injectable Botulinum Toxin Type A Revenue (million) Forecast, by Application 2020 & 2033
- Table 38: United Kingdom Injectable Botulinum Toxin Type A Volume (K) Forecast, by Application 2020 & 2033
- Table 39: Germany Injectable Botulinum Toxin Type A Revenue (million) Forecast, by Application 2020 & 2033
- Table 40: Germany Injectable Botulinum Toxin Type A Volume (K) Forecast, by Application 2020 & 2033
- Table 41: France Injectable Botulinum Toxin Type A Revenue (million) Forecast, by Application 2020 & 2033
- Table 42: France Injectable Botulinum Toxin Type A Volume (K) Forecast, by Application 2020 & 2033
- Table 43: Italy Injectable Botulinum Toxin Type A Revenue (million) Forecast, by Application 2020 & 2033
- Table 44: Italy Injectable Botulinum Toxin Type A Volume (K) Forecast, by Application 2020 & 2033
- Table 45: Spain Injectable Botulinum Toxin Type A Revenue (million) Forecast, by Application 2020 & 2033
- Table 46: Spain Injectable Botulinum Toxin Type A Volume (K) Forecast, by Application 2020 & 2033
- Table 47: Russia Injectable Botulinum Toxin Type A Revenue (million) Forecast, by Application 2020 & 2033
- Table 48: Russia Injectable Botulinum Toxin Type A Volume (K) Forecast, by Application 2020 & 2033
- Table 49: Benelux Injectable Botulinum Toxin Type A Revenue (million) Forecast, by Application 2020 & 2033
- Table 50: Benelux Injectable Botulinum Toxin Type A Volume (K) Forecast, by Application 2020 & 2033
- Table 51: Nordics Injectable Botulinum Toxin Type A Revenue (million) Forecast, by Application 2020 & 2033
- Table 52: Nordics Injectable Botulinum Toxin Type A Volume (K) Forecast, by Application 2020 & 2033
- Table 53: Rest of Europe Injectable Botulinum Toxin Type A Revenue (million) Forecast, by Application 2020 & 2033
- Table 54: Rest of Europe Injectable Botulinum Toxin Type A Volume (K) Forecast, by Application 2020 & 2033
- Table 55: Global Injectable Botulinum Toxin Type A Revenue million Forecast, by Application 2020 & 2033
- Table 56: Global Injectable Botulinum Toxin Type A Volume K Forecast, by Application 2020 & 2033
- Table 57: Global Injectable Botulinum Toxin Type A Revenue million Forecast, by Types 2020 & 2033
- Table 58: Global Injectable Botulinum Toxin Type A Volume K Forecast, by Types 2020 & 2033
- Table 59: Global Injectable Botulinum Toxin Type A Revenue million Forecast, by Country 2020 & 2033
- Table 60: Global Injectable Botulinum Toxin Type A Volume K Forecast, by Country 2020 & 2033
- Table 61: Turkey Injectable Botulinum Toxin Type A Revenue (million) Forecast, by Application 2020 & 2033
- Table 62: Turkey Injectable Botulinum Toxin Type A Volume (K) Forecast, by Application 2020 & 2033
- Table 63: Israel Injectable Botulinum Toxin Type A Revenue (million) Forecast, by Application 2020 & 2033
- Table 64: Israel Injectable Botulinum Toxin Type A Volume (K) Forecast, by Application 2020 & 2033
- Table 65: GCC Injectable Botulinum Toxin Type A Revenue (million) Forecast, by Application 2020 & 2033
- Table 66: GCC Injectable Botulinum Toxin Type A Volume (K) Forecast, by Application 2020 & 2033
- Table 67: North Africa Injectable Botulinum Toxin Type A Revenue (million) Forecast, by Application 2020 & 2033
- Table 68: North Africa Injectable Botulinum Toxin Type A Volume (K) Forecast, by Application 2020 & 2033
- Table 69: South Africa Injectable Botulinum Toxin Type A Revenue (million) Forecast, by Application 2020 & 2033
- Table 70: South Africa Injectable Botulinum Toxin Type A Volume (K) Forecast, by Application 2020 & 2033
- Table 71: Rest of Middle East & Africa Injectable Botulinum Toxin Type A Revenue (million) Forecast, by Application 2020 & 2033
- Table 72: Rest of Middle East & Africa Injectable Botulinum Toxin Type A Volume (K) Forecast, by Application 2020 & 2033
- Table 73: Global Injectable Botulinum Toxin Type A Revenue million Forecast, by Application 2020 & 2033
- Table 74: Global Injectable Botulinum Toxin Type A Volume K Forecast, by Application 2020 & 2033
- Table 75: Global Injectable Botulinum Toxin Type A Revenue million Forecast, by Types 2020 & 2033
- Table 76: Global Injectable Botulinum Toxin Type A Volume K Forecast, by Types 2020 & 2033
- Table 77: Global Injectable Botulinum Toxin Type A Revenue million Forecast, by Country 2020 & 2033
- Table 78: Global Injectable Botulinum Toxin Type A Volume K Forecast, by Country 2020 & 2033
- Table 79: China Injectable Botulinum Toxin Type A Revenue (million) Forecast, by Application 2020 & 2033
- Table 80: China Injectable Botulinum Toxin Type A Volume (K) Forecast, by Application 2020 & 2033
- Table 81: India Injectable Botulinum Toxin Type A Revenue (million) Forecast, by Application 2020 & 2033
- Table 82: India Injectable Botulinum Toxin Type A Volume (K) Forecast, by Application 2020 & 2033
- Table 83: Japan Injectable Botulinum Toxin Type A Revenue (million) Forecast, by Application 2020 & 2033
- Table 84: Japan Injectable Botulinum Toxin Type A Volume (K) Forecast, by Application 2020 & 2033
- Table 85: South Korea Injectable Botulinum Toxin Type A Revenue (million) Forecast, by Application 2020 & 2033
- Table 86: South Korea Injectable Botulinum Toxin Type A Volume (K) Forecast, by Application 2020 & 2033
- Table 87: ASEAN Injectable Botulinum Toxin Type A Revenue (million) Forecast, by Application 2020 & 2033
- Table 88: ASEAN Injectable Botulinum Toxin Type A Volume (K) Forecast, by Application 2020 & 2033
- Table 89: Oceania Injectable Botulinum Toxin Type A Revenue (million) Forecast, by Application 2020 & 2033
- Table 90: Oceania Injectable Botulinum Toxin Type A Volume (K) Forecast, by Application 2020 & 2033
- Table 91: Rest of Asia Pacific Injectable Botulinum Toxin Type A Revenue (million) Forecast, by Application 2020 & 2033
- Table 92: Rest of Asia Pacific Injectable Botulinum Toxin Type A Volume (K) Forecast, by Application 2020 & 2033
Frequently Asked Questions
1. What is the projected Compound Annual Growth Rate (CAGR) of the Injectable Botulinum Toxin Type A?
The projected CAGR is approximately 8.2%.
2. Which companies are prominent players in the Injectable Botulinum Toxin Type A?
Key companies in the market include AbbVie, Ipsen, Medytox, LIBP, Merz Pharmaceuticals, Hugel, Daewoong.
3. What are the main segments of the Injectable Botulinum Toxin Type A?
The market segments include Application, Types.
4. Can you provide details about the market size?
The market size is estimated to be USD 8398 million as of 2022.
5. What are some drivers contributing to market growth?
N/A
6. What are the notable trends driving market growth?
N/A
7. Are there any restraints impacting market growth?
N/A
8. Can you provide examples of recent developments in the market?
N/A
9. What pricing options are available for accessing the report?
Pricing options include single-user, multi-user, and enterprise licenses priced at USD 3950.00, USD 5925.00, and USD 7900.00 respectively.
10. Is the market size provided in terms of value or volume?
The market size is provided in terms of value, measured in million and volume, measured in K.
11. Are there any specific market keywords associated with the report?
Yes, the market keyword associated with the report is "Injectable Botulinum Toxin Type A," which aids in identifying and referencing the specific market segment covered.
12. How do I determine which pricing option suits my needs best?
The pricing options vary based on user requirements and access needs. Individual users may opt for single-user licenses, while businesses requiring broader access may choose multi-user or enterprise licenses for cost-effective access to the report.
13. Are there any additional resources or data provided in the Injectable Botulinum Toxin Type A report?
While the report offers comprehensive insights, it's advisable to review the specific contents or supplementary materials provided to ascertain if additional resources or data are available.
14. How can I stay updated on further developments or reports in the Injectable Botulinum Toxin Type A?
To stay informed about further developments, trends, and reports in the Injectable Botulinum Toxin Type A, consider subscribing to industry newsletters, following relevant companies and organizations, or regularly checking reputable industry news sources and publications.
Methodology
Step 1 - Identification of Relevant Samples Size from Population Database


Step 2 - Approaches for Defining Global Market Size (Value, Volume* & Price*)

Note*: In applicable scenarios
Step 3 - Data Sources
Primary Research
- Web Analytics
- Survey Reports
- Research Institute
- Latest Research Reports
- Opinion Leaders
Secondary Research
- Annual Reports
- White Paper
- Latest Press Release
- Industry Association
- Paid Database
- Investor Presentations

Step 4 - Data Triangulation
Involves using different sources of information in order to increase the validity of a study
These sources are likely to be stakeholders in a program - participants, other researchers, program staff, other community members, and so on.
Then we put all data in single framework & apply various statistical tools to find out the dynamic on the market.
During the analysis stage, feedback from the stakeholder groups would be compared to determine areas of agreement as well as areas of divergence