

Key Insights
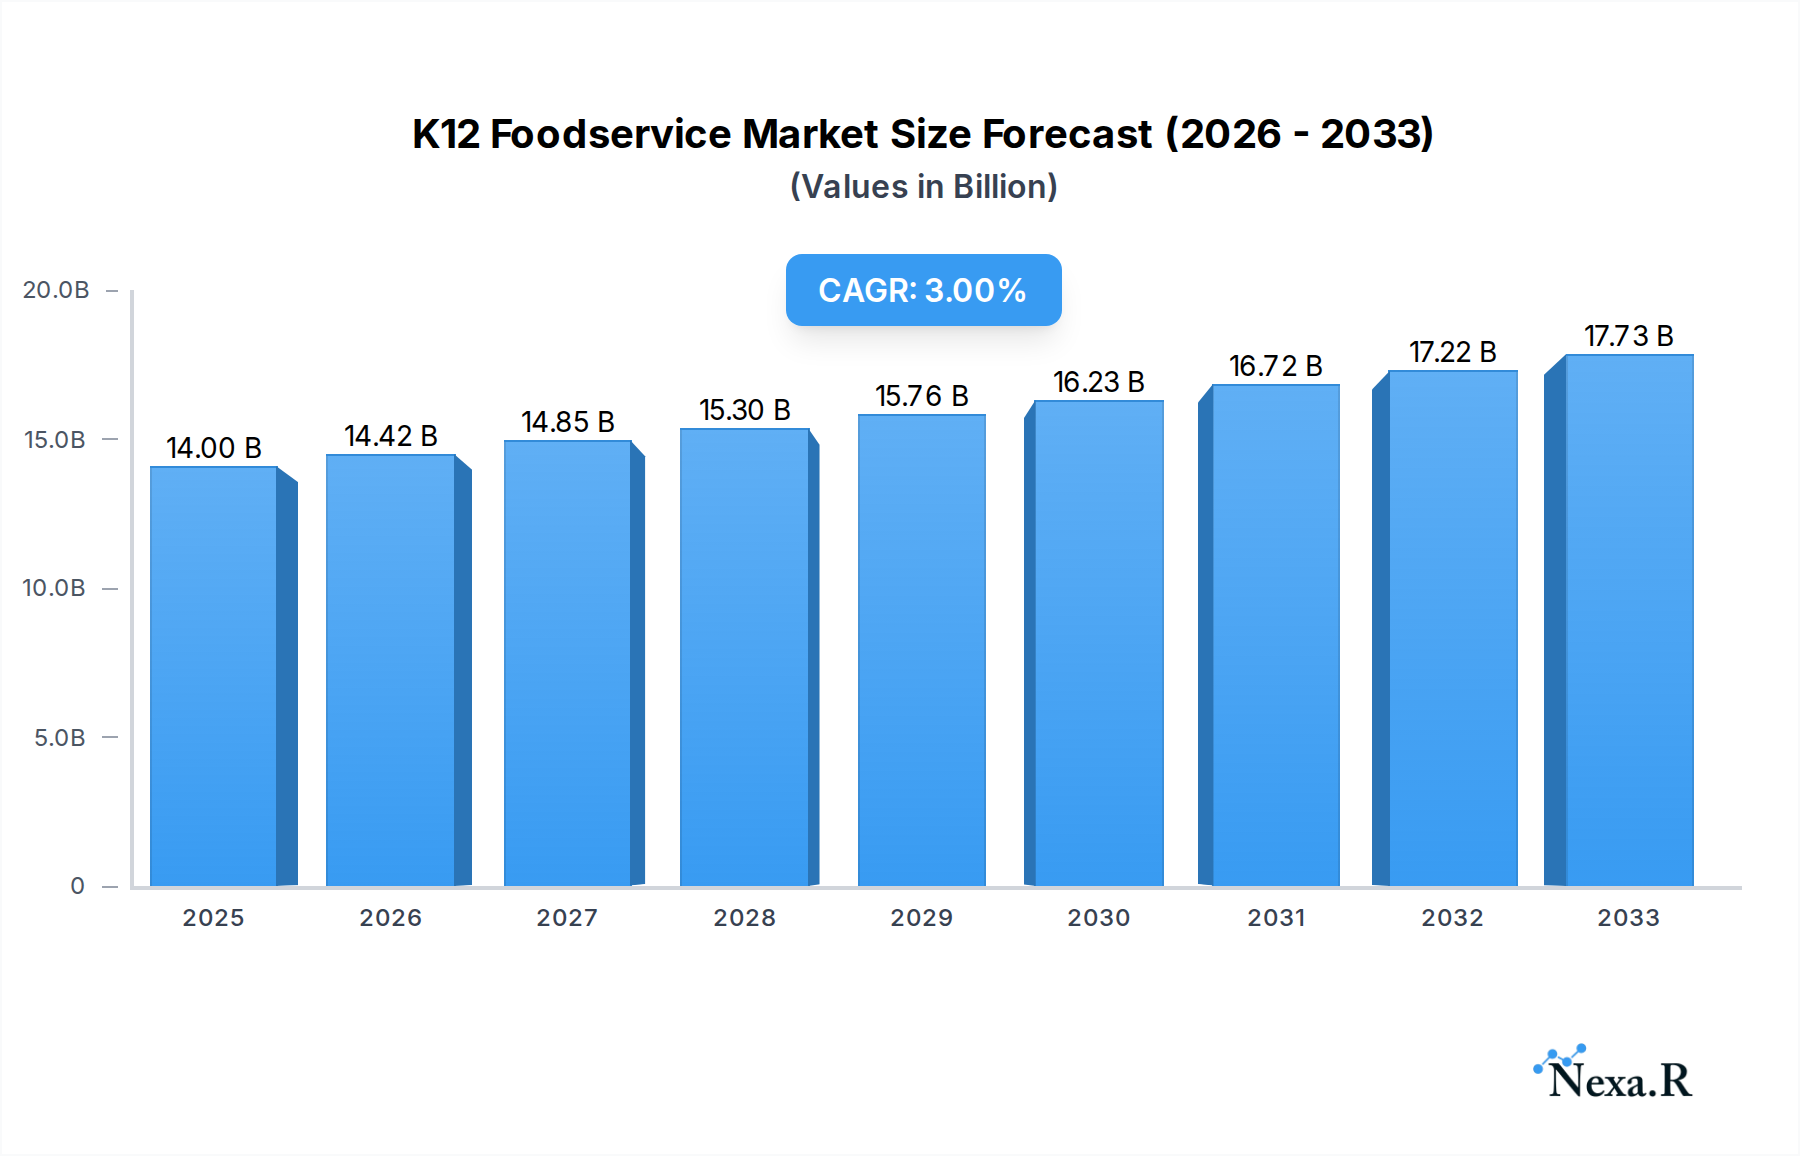
The global K12 Foodservice market is projected to reach approximately $14 billion by 2025, exhibiting a compound annual growth rate (CAGR) of around 3% during the forecast period of 2025-2033. This robust expansion is primarily driven by increasing government initiatives focused on improving child nutrition, growing awareness among parents about the importance of healthy school meals, and the rising demand for convenient and nutritious food options for students. The market is segmented by application into Kindergarten, Primary School, and Middle School, with Primary Schools currently holding the largest share due to a higher student population. In terms of types, Dinner, Dessert, and Drinks are the dominant categories, catering to the daily nutritional needs and preferences of school-going children. The foodservice sector is also witnessing a surge in demand for healthier alternatives, including plant-based options and allergy-friendly meals, reflecting evolving dietary trends and health concerns.

K12 Foodservice Market Size (In Billion)
Key players in the K12 Foodservice market, such as Land O'Lakes, General Mills, Rich Products Corporation, and Tyson Foodservice, are actively investing in product innovation, supply chain optimization, and strategic partnerships to capture a larger market share. These companies are focusing on offering a diverse range of palatable yet nutritious meals that comply with stringent school food regulations. Emerging trends include the adoption of technology for efficient meal planning and delivery, the rise of farm-to-school programs emphasizing fresh, local produce, and an increased focus on sustainability in food sourcing and packaging. However, challenges such as rising food costs, labor shortages in the foodservice industry, and the complexity of catering to diverse dietary needs and preferences across different age groups and regions can act as restraints. Despite these challenges, the long-term outlook for the K12 Foodservice market remains positive, fueled by the unwavering commitment to providing wholesome and balanced meals for the younger generation.
K12 Foodservice Company Market Share
K12 Foodservice Market Dynamics & Structure
The K12 foodservice market exhibits a moderately concentrated structure, with a few dominant players like Land O'Lakes, General Mills, and Tyson Foodservice controlling a significant portion of the landscape. Technological innovation is primarily driven by the demand for healthier, more convenient, and allergen-free meal options. Regulatory frameworks, such as the Healthy, Hunger-Free Kids Act in the US, play a crucial role in shaping nutritional standards and procurement processes. Competitive product substitutes include in-home meal preparation and the growing popularity of external food delivery services, though institutional purchasing power and established vendor relationships provide a strong defense. End-user demographics are evolving, with increasing awareness of childhood obesity and dietary needs influencing menu development. Mergers and acquisitions (M&A) are a notable trend, with companies consolidating to enhance their product portfolios, expand their reach, and achieve economies of scale. For instance, recent years have seen strategic acquisitions by major food manufacturers aimed at strengthening their presence in the school nutrition segment.
- Market Share: Leading companies hold an estimated 60-70% of the market share.
- Technological Drivers: Demand for plant-based alternatives, reduced sugar/sodium content, and improved food safety technology.
- Regulatory Impact: Strict adherence to USDA guidelines and nutritional mandates.
- M&A Activity: Driven by the pursuit of market dominance and product diversification.
- Innovation Barriers: High initial investment in R&D and long product development cycles to meet school nutrition standards.
K12 Foodservice Growth Trends & Insights
The K12 foodservice market is poised for significant growth, projected to expand from an estimated $45.7 billion in 2024 to $68.2 billion by 2033, exhibiting a Compound Annual Growth Rate (CAGR) of approximately 4.5% throughout the forecast period. This expansion is fueled by a confluence of factors including increasing student enrollment, a growing emphasis on child nutrition and well-being, and the sustained need for convenient and healthy meal solutions within educational institutions. The base year of 2025 estimates the market at $48.9 billion, setting the stage for a robust trajectory.
Adoption rates for innovative and healthier food options are on an upward trend, driven by parental pressure and governmental initiatives aimed at combating childhood obesity and promoting lifelong healthy eating habits. Technological disruptions are increasingly impacting the sector, with advancements in food processing, packaging, and distribution contributing to improved food safety, extended shelf life, and enhanced nutritional integrity. The integration of digital platforms for menu planning, ordering, and inventory management is also streamlining operations for foodservice providers within the K12 segment.
Consumer behavior shifts are a pivotal influence. Parents and educators are increasingly prioritizing transparency in ingredient sourcing, sustainability practices, and the availability of diverse dietary options, including vegetarian, vegan, and allergen-free choices. This necessitates a more dynamic and responsive approach from K12 foodservice providers, encouraging a broader product assortment and more flexible service models. The market penetration of specialized K12 foodservice solutions, catering to specific age groups and nutritional requirements, is expected to deepen as awareness and demand continue to rise. The estimated market size for 2025 stands at $48.9 billion, with projections indicating a steady climb.
Dominant Regions, Countries, or Segments in K12 Foodservice
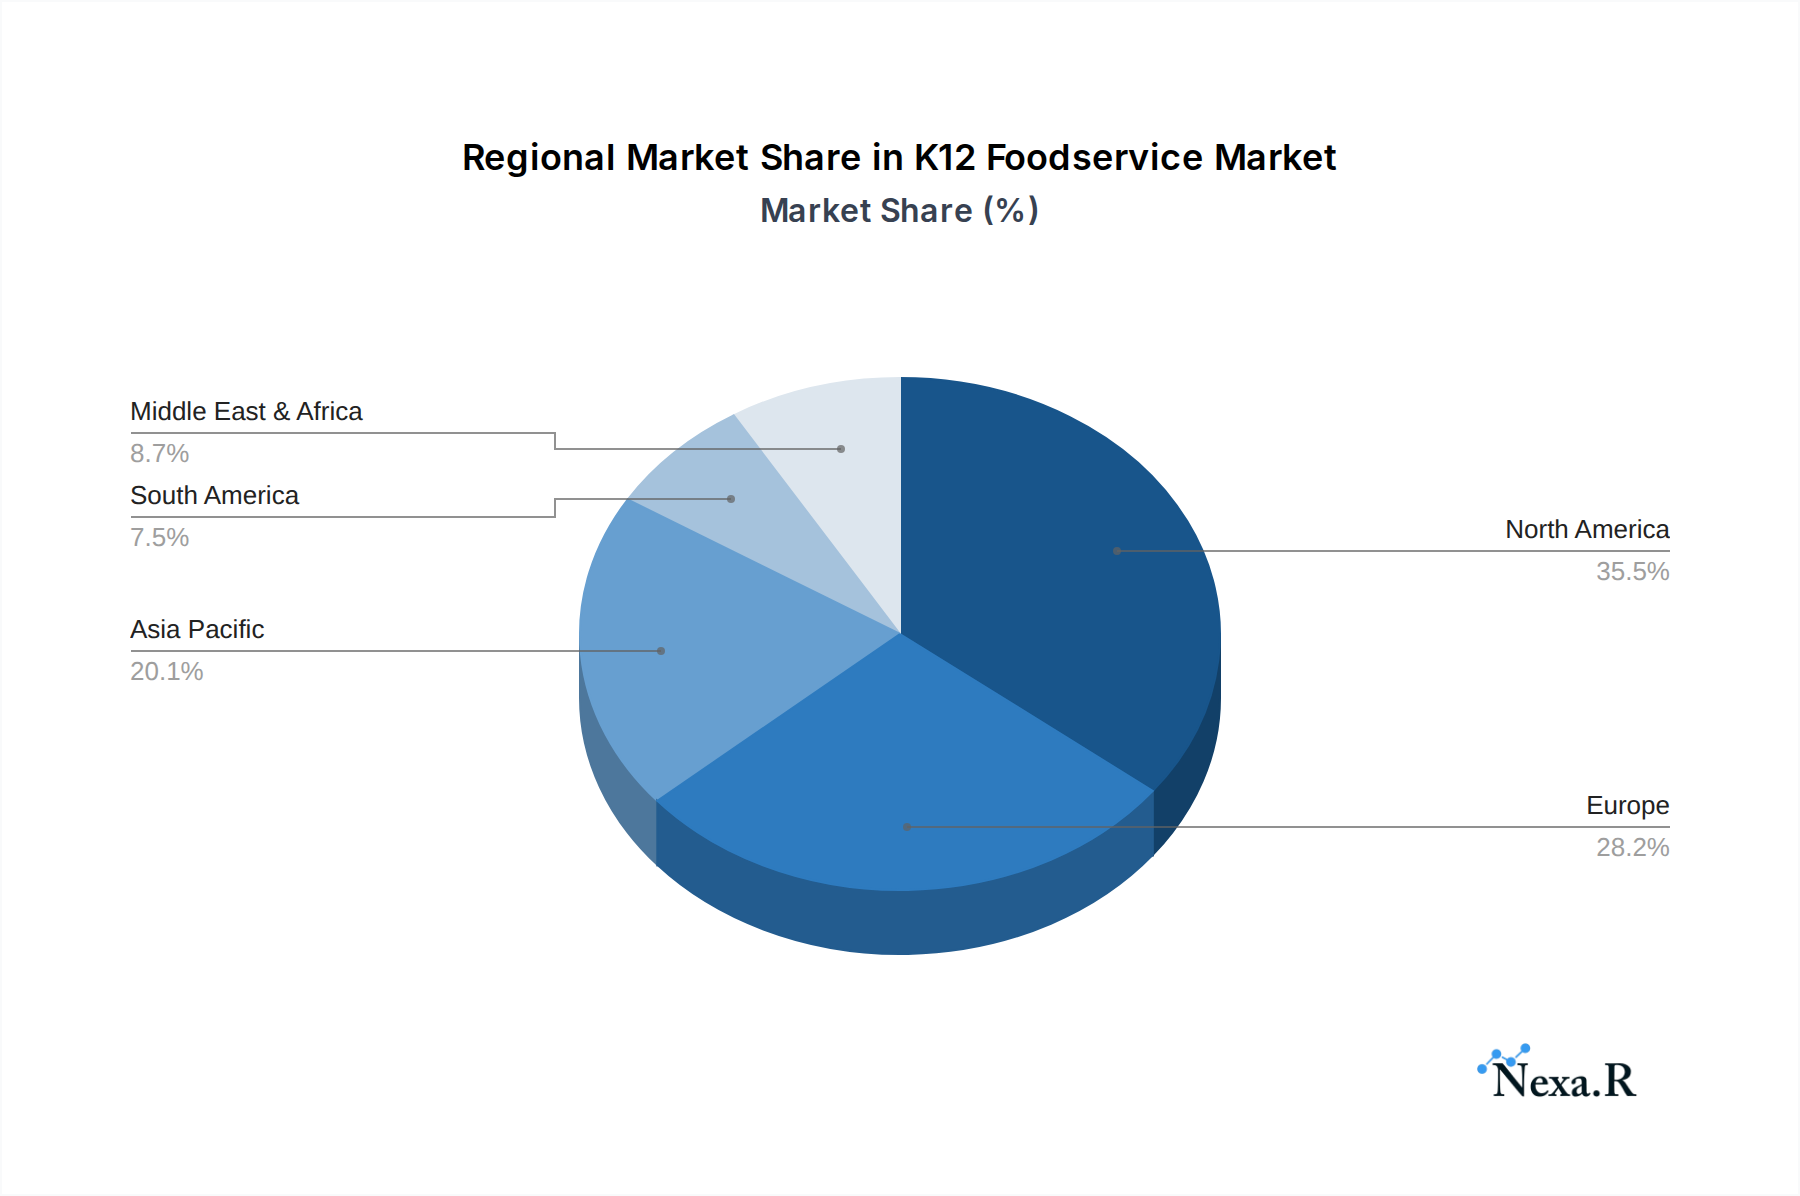
The North American region, particularly the United States, emerges as the dominant force in the global K12 foodservice market, driven by a robust regulatory environment, substantial student populations, and a heightened awareness of childhood nutrition. The Primary School application segment within this region commands significant market share, owing to the consistent demand for breakfast, lunch, and snack programs throughout the academic year. The Dinner type of meal also holds a substantial position, reflecting the growing trend of after-school programs and extended learning opportunities that necessitate evening meal provisions.
Key drivers contributing to North America's dominance include proactive government policies, such as the aforementioned Healthy, Hunger-Free Kids Act, which mandates nutritional standards and provides funding for school meal programs. Significant investment in infrastructure for school cafeterias and the widespread presence of major K12 foodservice suppliers like Land O'Lakes, General Mills, and Tyson Foodservice further solidify its leadership. The market share within the US alone is estimated to be over 65% of the global K12 foodservice market. The projected growth for the Primary School segment in North America is expected to outpace other applications due to its foundational role in student development and the consistent need for nutritional support.
Furthermore, the evolution of dietary guidelines and increasing parental demand for healthier, more diverse meal options have spurred innovation among foodservice providers in this region. The market share for 'Dinner' is also experiencing an upward trend, as more schools implement extended day programs. The economic policies supporting child welfare and education directly translate into sustained demand for K12 foodservice, making North America the undisputed leader with a substantial growth potential from 2025 to 2033.
K12 Foodservice Product Landscape
The K12 foodservice product landscape is characterized by a strong emphasis on health, convenience, and appeal to young palates. Innovations are predominantly focused on developing nutrient-dense meals that meet stringent dietary guidelines, incorporating whole grains, lean proteins, and reduced levels of sodium and sugar. Product categories such as pre-portioned lunch kits, individually packaged snacks, and ready-to-heat dinner options are gaining traction due to their ease of use for both students and foodservice staff. The performance metrics are measured by nutritional compliance, student acceptance rates, and operational efficiency. Unique selling propositions often revolve around allergen-free formulations and the integration of culturally diverse and appealing menu items, reflecting the growing diversity in student populations. Technological advancements in flash freezing and retort packaging ensure food safety and extend shelf life, contributing to reduced food waste.
Key Drivers, Barriers & Challenges in K12 Foodservice
Key Drivers: The K12 foodservice market is propelled by several critical drivers. Government initiatives and regulations mandating nutritional standards are paramount, ensuring healthier meal options for students. Growing parental awareness and demand for nutritious and safe food for their children is a significant influence. Technological advancements in food processing and preparation enhance efficiency and product quality. The increasing need for convenience and on-the-go meal solutions for busy school schedules also fuels demand.
Barriers & Challenges: Despite robust growth drivers, the sector faces significant barriers. Stringent budget constraints in educational institutions can limit investment in premium ingredients or advanced equipment. Navigating complex and evolving regulatory frameworks presents a continuous challenge. Supply chain disruptions, as evidenced by recent global events, can impact ingredient availability and cost. Intense competition from external food providers and the rising cost of food ingredients also pose considerable threats. Balancing cost-effectiveness with the demand for healthier, higher-quality food remains a perpetual challenge for K12 foodservice providers. The projected supply chain impact on raw material costs is estimated to add 8-12% to operational expenses in the near term.
Emerging Opportunities in K12 Foodservice
Emerging opportunities in the K12 foodservice industry lie in catering to specialized dietary needs and preferences. The growing demand for plant-based and vegetarian options, driven by ethical and environmental concerns, presents a significant untapped market. Innovative applications of technology, such as AI-powered menu planning for personalized nutrition and automated kitchen systems to improve efficiency, offer avenues for differentiation. Evolving consumer preferences for sustainable and locally sourced ingredients also open doors for partnerships with regional food producers. Furthermore, the expansion of after-school programs and summer feeding initiatives creates new demand streams for convenient and nutritious meal solutions beyond traditional school hours.
Growth Accelerators in the K12 Foodservice Industry
Technological breakthroughs in food preservation and nutrient fortification are significant growth accelerators, enabling the development of healthier and more appealing school meals with extended shelf lives. Strategic partnerships between foodservice providers and food manufacturers are crucial for developing innovative product lines that meet evolving nutritional standards and student preferences. Market expansion strategies, including targeting underserved school districts and developing flexible catering models for various school sizes, are also driving long-term growth. The increasing integration of digital platforms for order management, inventory control, and student feedback mechanisms further optimizes operations and enhances customer satisfaction, indirectly accelerating growth.
Key Players Shaping the K12 Foodservice Market
- Land O'Lakes
- General Mills
- Rich Products Corporation
- Simplot Foods
- Tyson Foodservice
- SCHWAN'S FOOD SERVICE
- J&J Snack Foods
- Metz Culinary
- Cargill
- Pepsico
- Dole Packaged Foods
- Bake Crafters
- Butterball
- National Food Group
Notable Milestones in K12 Foodservice Sector
- 2019: Increased focus on plant-based alternatives in school menus.
- 2020: Rapid adoption of grab-and-go and pre-packaged meal solutions due to pandemic-related disruptions.
- 2021: Heightened emphasis on food safety protocols and contactless delivery in foodservice operations.
- 2022: Growing demand for allergen-free options and clear labeling of ingredients.
- 2023: Introduction of technology for enhanced inventory management and nutritional tracking in school cafeterias.
- 2024: Expansion of summer feeding programs and continued integration of healthier menu items.
In-Depth K12 Foodservice Market Outlook
The K12 foodservice market is characterized by a positive and dynamic outlook, fueled by an unwavering commitment to enhancing child nutrition and well-being. Growth accelerators, including technological advancements in food innovation and operational efficiency, alongside strategic alliances, are set to propel the market forward. The increasing adoption of digital solutions for seamless ordering and inventory management will further streamline operations. As parental demand for transparency and healthier options intensifies, K12 foodservice providers are strategically positioned to capitalize on these trends by expanding their offerings to include a wider array of plant-based, allergen-free, and sustainably sourced food products. The continuous evolution of governmental policies and their support for school meal programs will provide a stable foundation for sustained growth throughout the forecast period, ensuring a robust future for the industry.
K12 Foodservice Segmentation
-
1. Application
- 1.1. Kindergarten
- 1.2. Primary School
- 1.3. Middle School
-
2. Types
- 2.1. Dinner
- 2.2. Dessert
- 2.3. Drinks
- 2.4. Others
K12 Foodservice Segmentation By Geography
-
1. North America
- 1.1. United States
- 1.2. Canada
- 1.3. Mexico
-
2. South America
- 2.1. Brazil
- 2.2. Argentina
- 2.3. Rest of South America
-
3. Europe
- 3.1. United Kingdom
- 3.2. Germany
- 3.3. France
- 3.4. Italy
- 3.5. Spain
- 3.6. Russia
- 3.7. Benelux
- 3.8. Nordics
- 3.9. Rest of Europe
-
4. Middle East & Africa
- 4.1. Turkey
- 4.2. Israel
- 4.3. GCC
- 4.4. North Africa
- 4.5. South Africa
- 4.6. Rest of Middle East & Africa
-
5. Asia Pacific
- 5.1. China
- 5.2. India
- 5.3. Japan
- 5.4. South Korea
- 5.5. ASEAN
- 5.6. Oceania
- 5.7. Rest of Asia Pacific
K12 Foodservice Regional Market Share
Geographic Coverage of K12 Foodservice
K12 Foodservice REPORT HIGHLIGHTS
| Aspects | Details |
|---|---|
| Study Period | 2020-2034 |
| Base Year | 2025 |
| Estimated Year | 2026 |
| Forecast Period | 2026-2034 |
| Historical Period | 2020-2025 |
| Growth Rate | CAGR of 3% from 2020-2034 |
| Segmentation |
|
Table of Contents
- 1. Introduction
- 1.1. Research Scope
- 1.2. Market Segmentation
- 1.3. Research Methodology
- 1.4. Definitions and Assumptions
- 2. Executive Summary
- 2.1. Introduction
- 3. Market Dynamics
- 3.1. Introduction
- 3.2. Market Drivers
- 3.3. Market Restrains
- 3.4. Market Trends
- 4. Market Factor Analysis
- 4.1. Porters Five Forces
- 4.2. Supply/Value Chain
- 4.3. PESTEL analysis
- 4.4. Market Entropy
- 4.5. Patent/Trademark Analysis
- 5. Global K12 Foodservice Analysis, Insights and Forecast, 2020-2032
- 5.1. Market Analysis, Insights and Forecast - by Application
- 5.1.1. Kindergarten
- 5.1.2. Primary School
- 5.1.3. Middle School
- 5.2. Market Analysis, Insights and Forecast - by Types
- 5.2.1. Dinner
- 5.2.2. Dessert
- 5.2.3. Drinks
- 5.2.4. Others
- 5.3. Market Analysis, Insights and Forecast - by Region
- 5.3.1. North America
- 5.3.2. South America
- 5.3.3. Europe
- 5.3.4. Middle East & Africa
- 5.3.5. Asia Pacific
- 5.1. Market Analysis, Insights and Forecast - by Application
- 6. North America K12 Foodservice Analysis, Insights and Forecast, 2020-2032
- 6.1. Market Analysis, Insights and Forecast - by Application
- 6.1.1. Kindergarten
- 6.1.2. Primary School
- 6.1.3. Middle School
- 6.2. Market Analysis, Insights and Forecast - by Types
- 6.2.1. Dinner
- 6.2.2. Dessert
- 6.2.3. Drinks
- 6.2.4. Others
- 6.1. Market Analysis, Insights and Forecast - by Application
- 7. South America K12 Foodservice Analysis, Insights and Forecast, 2020-2032
- 7.1. Market Analysis, Insights and Forecast - by Application
- 7.1.1. Kindergarten
- 7.1.2. Primary School
- 7.1.3. Middle School
- 7.2. Market Analysis, Insights and Forecast - by Types
- 7.2.1. Dinner
- 7.2.2. Dessert
- 7.2.3. Drinks
- 7.2.4. Others
- 7.1. Market Analysis, Insights and Forecast - by Application
- 8. Europe K12 Foodservice Analysis, Insights and Forecast, 2020-2032
- 8.1. Market Analysis, Insights and Forecast - by Application
- 8.1.1. Kindergarten
- 8.1.2. Primary School
- 8.1.3. Middle School
- 8.2. Market Analysis, Insights and Forecast - by Types
- 8.2.1. Dinner
- 8.2.2. Dessert
- 8.2.3. Drinks
- 8.2.4. Others
- 8.1. Market Analysis, Insights and Forecast - by Application
- 9. Middle East & Africa K12 Foodservice Analysis, Insights and Forecast, 2020-2032
- 9.1. Market Analysis, Insights and Forecast - by Application
- 9.1.1. Kindergarten
- 9.1.2. Primary School
- 9.1.3. Middle School
- 9.2. Market Analysis, Insights and Forecast - by Types
- 9.2.1. Dinner
- 9.2.2. Dessert
- 9.2.3. Drinks
- 9.2.4. Others
- 9.1. Market Analysis, Insights and Forecast - by Application
- 10. Asia Pacific K12 Foodservice Analysis, Insights and Forecast, 2020-2032
- 10.1. Market Analysis, Insights and Forecast - by Application
- 10.1.1. Kindergarten
- 10.1.2. Primary School
- 10.1.3. Middle School
- 10.2. Market Analysis, Insights and Forecast - by Types
- 10.2.1. Dinner
- 10.2.2. Dessert
- 10.2.3. Drinks
- 10.2.4. Others
- 10.1. Market Analysis, Insights and Forecast - by Application
- 11. Competitive Analysis
- 11.1. Global Market Share Analysis 2025
- 11.2. Company Profiles
- 11.2.1 Land O'Lakes
- 11.2.1.1. Overview
- 11.2.1.2. Products
- 11.2.1.3. SWOT Analysis
- 11.2.1.4. Recent Developments
- 11.2.1.5. Financials (Based on Availability)
- 11.2.2 General Mills
- 11.2.2.1. Overview
- 11.2.2.2. Products
- 11.2.2.3. SWOT Analysis
- 11.2.2.4. Recent Developments
- 11.2.2.5. Financials (Based on Availability)
- 11.2.3 Rich Products Corporation
- 11.2.3.1. Overview
- 11.2.3.2. Products
- 11.2.3.3. SWOT Analysis
- 11.2.3.4. Recent Developments
- 11.2.3.5. Financials (Based on Availability)
- 11.2.4 Simplot Foods
- 11.2.4.1. Overview
- 11.2.4.2. Products
- 11.2.4.3. SWOT Analysis
- 11.2.4.4. Recent Developments
- 11.2.4.5. Financials (Based on Availability)
- 11.2.5 Tyson Foodservice
- 11.2.5.1. Overview
- 11.2.5.2. Products
- 11.2.5.3. SWOT Analysis
- 11.2.5.4. Recent Developments
- 11.2.5.5. Financials (Based on Availability)
- 11.2.6 SCHWAN'S FOOD SERVICE
- 11.2.6.1. Overview
- 11.2.6.2. Products
- 11.2.6.3. SWOT Analysis
- 11.2.6.4. Recent Developments
- 11.2.6.5. Financials (Based on Availability)
- 11.2.7 J&J Snack Foods
- 11.2.7.1. Overview
- 11.2.7.2. Products
- 11.2.7.3. SWOT Analysis
- 11.2.7.4. Recent Developments
- 11.2.7.5. Financials (Based on Availability)
- 11.2.8 Metz Culinary
- 11.2.8.1. Overview
- 11.2.8.2. Products
- 11.2.8.3. SWOT Analysis
- 11.2.8.4. Recent Developments
- 11.2.8.5. Financials (Based on Availability)
- 11.2.9 Cargill
- 11.2.9.1. Overview
- 11.2.9.2. Products
- 11.2.9.3. SWOT Analysis
- 11.2.9.4. Recent Developments
- 11.2.9.5. Financials (Based on Availability)
- 11.2.10 Pepsico
- 11.2.10.1. Overview
- 11.2.10.2. Products
- 11.2.10.3. SWOT Analysis
- 11.2.10.4. Recent Developments
- 11.2.10.5. Financials (Based on Availability)
- 11.2.11 Dole Packaged Foods
- 11.2.11.1. Overview
- 11.2.11.2. Products
- 11.2.11.3. SWOT Analysis
- 11.2.11.4. Recent Developments
- 11.2.11.5. Financials (Based on Availability)
- 11.2.12 Bake Crafters
- 11.2.12.1. Overview
- 11.2.12.2. Products
- 11.2.12.3. SWOT Analysis
- 11.2.12.4. Recent Developments
- 11.2.12.5. Financials (Based on Availability)
- 11.2.13 Butterball
- 11.2.13.1. Overview
- 11.2.13.2. Products
- 11.2.13.3. SWOT Analysis
- 11.2.13.4. Recent Developments
- 11.2.13.5. Financials (Based on Availability)
- 11.2.14 National Food Group
- 11.2.14.1. Overview
- 11.2.14.2. Products
- 11.2.14.3. SWOT Analysis
- 11.2.14.4. Recent Developments
- 11.2.14.5. Financials (Based on Availability)
- 11.2.1 Land O'Lakes
List of Figures
- Figure 1: Global K12 Foodservice Revenue Breakdown (undefined, %) by Region 2025 & 2033
- Figure 2: North America K12 Foodservice Revenue (undefined), by Application 2025 & 2033
- Figure 3: North America K12 Foodservice Revenue Share (%), by Application 2025 & 2033
- Figure 4: North America K12 Foodservice Revenue (undefined), by Types 2025 & 2033
- Figure 5: North America K12 Foodservice Revenue Share (%), by Types 2025 & 2033
- Figure 6: North America K12 Foodservice Revenue (undefined), by Country 2025 & 2033
- Figure 7: North America K12 Foodservice Revenue Share (%), by Country 2025 & 2033
- Figure 8: South America K12 Foodservice Revenue (undefined), by Application 2025 & 2033
- Figure 9: South America K12 Foodservice Revenue Share (%), by Application 2025 & 2033
- Figure 10: South America K12 Foodservice Revenue (undefined), by Types 2025 & 2033
- Figure 11: South America K12 Foodservice Revenue Share (%), by Types 2025 & 2033
- Figure 12: South America K12 Foodservice Revenue (undefined), by Country 2025 & 2033
- Figure 13: South America K12 Foodservice Revenue Share (%), by Country 2025 & 2033
- Figure 14: Europe K12 Foodservice Revenue (undefined), by Application 2025 & 2033
- Figure 15: Europe K12 Foodservice Revenue Share (%), by Application 2025 & 2033
- Figure 16: Europe K12 Foodservice Revenue (undefined), by Types 2025 & 2033
- Figure 17: Europe K12 Foodservice Revenue Share (%), by Types 2025 & 2033
- Figure 18: Europe K12 Foodservice Revenue (undefined), by Country 2025 & 2033
- Figure 19: Europe K12 Foodservice Revenue Share (%), by Country 2025 & 2033
- Figure 20: Middle East & Africa K12 Foodservice Revenue (undefined), by Application 2025 & 2033
- Figure 21: Middle East & Africa K12 Foodservice Revenue Share (%), by Application 2025 & 2033
- Figure 22: Middle East & Africa K12 Foodservice Revenue (undefined), by Types 2025 & 2033
- Figure 23: Middle East & Africa K12 Foodservice Revenue Share (%), by Types 2025 & 2033
- Figure 24: Middle East & Africa K12 Foodservice Revenue (undefined), by Country 2025 & 2033
- Figure 25: Middle East & Africa K12 Foodservice Revenue Share (%), by Country 2025 & 2033
- Figure 26: Asia Pacific K12 Foodservice Revenue (undefined), by Application 2025 & 2033
- Figure 27: Asia Pacific K12 Foodservice Revenue Share (%), by Application 2025 & 2033
- Figure 28: Asia Pacific K12 Foodservice Revenue (undefined), by Types 2025 & 2033
- Figure 29: Asia Pacific K12 Foodservice Revenue Share (%), by Types 2025 & 2033
- Figure 30: Asia Pacific K12 Foodservice Revenue (undefined), by Country 2025 & 2033
- Figure 31: Asia Pacific K12 Foodservice Revenue Share (%), by Country 2025 & 2033
List of Tables
- Table 1: Global K12 Foodservice Revenue undefined Forecast, by Application 2020 & 2033
- Table 2: Global K12 Foodservice Revenue undefined Forecast, by Types 2020 & 2033
- Table 3: Global K12 Foodservice Revenue undefined Forecast, by Region 2020 & 2033
- Table 4: Global K12 Foodservice Revenue undefined Forecast, by Application 2020 & 2033
- Table 5: Global K12 Foodservice Revenue undefined Forecast, by Types 2020 & 2033
- Table 6: Global K12 Foodservice Revenue undefined Forecast, by Country 2020 & 2033
- Table 7: United States K12 Foodservice Revenue (undefined) Forecast, by Application 2020 & 2033
- Table 8: Canada K12 Foodservice Revenue (undefined) Forecast, by Application 2020 & 2033
- Table 9: Mexico K12 Foodservice Revenue (undefined) Forecast, by Application 2020 & 2033
- Table 10: Global K12 Foodservice Revenue undefined Forecast, by Application 2020 & 2033
- Table 11: Global K12 Foodservice Revenue undefined Forecast, by Types 2020 & 2033
- Table 12: Global K12 Foodservice Revenue undefined Forecast, by Country 2020 & 2033
- Table 13: Brazil K12 Foodservice Revenue (undefined) Forecast, by Application 2020 & 2033
- Table 14: Argentina K12 Foodservice Revenue (undefined) Forecast, by Application 2020 & 2033
- Table 15: Rest of South America K12 Foodservice Revenue (undefined) Forecast, by Application 2020 & 2033
- Table 16: Global K12 Foodservice Revenue undefined Forecast, by Application 2020 & 2033
- Table 17: Global K12 Foodservice Revenue undefined Forecast, by Types 2020 & 2033
- Table 18: Global K12 Foodservice Revenue undefined Forecast, by Country 2020 & 2033
- Table 19: United Kingdom K12 Foodservice Revenue (undefined) Forecast, by Application 2020 & 2033
- Table 20: Germany K12 Foodservice Revenue (undefined) Forecast, by Application 2020 & 2033
- Table 21: France K12 Foodservice Revenue (undefined) Forecast, by Application 2020 & 2033
- Table 22: Italy K12 Foodservice Revenue (undefined) Forecast, by Application 2020 & 2033
- Table 23: Spain K12 Foodservice Revenue (undefined) Forecast, by Application 2020 & 2033
- Table 24: Russia K12 Foodservice Revenue (undefined) Forecast, by Application 2020 & 2033
- Table 25: Benelux K12 Foodservice Revenue (undefined) Forecast, by Application 2020 & 2033
- Table 26: Nordics K12 Foodservice Revenue (undefined) Forecast, by Application 2020 & 2033
- Table 27: Rest of Europe K12 Foodservice Revenue (undefined) Forecast, by Application 2020 & 2033
- Table 28: Global K12 Foodservice Revenue undefined Forecast, by Application 2020 & 2033
- Table 29: Global K12 Foodservice Revenue undefined Forecast, by Types 2020 & 2033
- Table 30: Global K12 Foodservice Revenue undefined Forecast, by Country 2020 & 2033
- Table 31: Turkey K12 Foodservice Revenue (undefined) Forecast, by Application 2020 & 2033
- Table 32: Israel K12 Foodservice Revenue (undefined) Forecast, by Application 2020 & 2033
- Table 33: GCC K12 Foodservice Revenue (undefined) Forecast, by Application 2020 & 2033
- Table 34: North Africa K12 Foodservice Revenue (undefined) Forecast, by Application 2020 & 2033
- Table 35: South Africa K12 Foodservice Revenue (undefined) Forecast, by Application 2020 & 2033
- Table 36: Rest of Middle East & Africa K12 Foodservice Revenue (undefined) Forecast, by Application 2020 & 2033
- Table 37: Global K12 Foodservice Revenue undefined Forecast, by Application 2020 & 2033
- Table 38: Global K12 Foodservice Revenue undefined Forecast, by Types 2020 & 2033
- Table 39: Global K12 Foodservice Revenue undefined Forecast, by Country 2020 & 2033
- Table 40: China K12 Foodservice Revenue (undefined) Forecast, by Application 2020 & 2033
- Table 41: India K12 Foodservice Revenue (undefined) Forecast, by Application 2020 & 2033
- Table 42: Japan K12 Foodservice Revenue (undefined) Forecast, by Application 2020 & 2033
- Table 43: South Korea K12 Foodservice Revenue (undefined) Forecast, by Application 2020 & 2033
- Table 44: ASEAN K12 Foodservice Revenue (undefined) Forecast, by Application 2020 & 2033
- Table 45: Oceania K12 Foodservice Revenue (undefined) Forecast, by Application 2020 & 2033
- Table 46: Rest of Asia Pacific K12 Foodservice Revenue (undefined) Forecast, by Application 2020 & 2033
Frequently Asked Questions
1. What is the projected Compound Annual Growth Rate (CAGR) of the K12 Foodservice?
The projected CAGR is approximately 3%.
2. Which companies are prominent players in the K12 Foodservice?
Key companies in the market include Land O'Lakes, General Mills, Rich Products Corporation, Simplot Foods, Tyson Foodservice, SCHWAN'S FOOD SERVICE, J&J Snack Foods, Metz Culinary, Cargill, Pepsico, Dole Packaged Foods, Bake Crafters, Butterball, National Food Group.
3. What are the main segments of the K12 Foodservice?
The market segments include Application, Types.
4. Can you provide details about the market size?
The market size is estimated to be USD XXX N/A as of 2022.
5. What are some drivers contributing to market growth?
N/A
6. What are the notable trends driving market growth?
N/A
7. Are there any restraints impacting market growth?
N/A
8. Can you provide examples of recent developments in the market?
N/A
9. What pricing options are available for accessing the report?
Pricing options include single-user, multi-user, and enterprise licenses priced at USD 2900.00, USD 4350.00, and USD 5800.00 respectively.
10. Is the market size provided in terms of value or volume?
The market size is provided in terms of value, measured in N/A.
11. Are there any specific market keywords associated with the report?
Yes, the market keyword associated with the report is "K12 Foodservice," which aids in identifying and referencing the specific market segment covered.
12. How do I determine which pricing option suits my needs best?
The pricing options vary based on user requirements and access needs. Individual users may opt for single-user licenses, while businesses requiring broader access may choose multi-user or enterprise licenses for cost-effective access to the report.
13. Are there any additional resources or data provided in the K12 Foodservice report?
While the report offers comprehensive insights, it's advisable to review the specific contents or supplementary materials provided to ascertain if additional resources or data are available.
14. How can I stay updated on further developments or reports in the K12 Foodservice?
To stay informed about further developments, trends, and reports in the K12 Foodservice, consider subscribing to industry newsletters, following relevant companies and organizations, or regularly checking reputable industry news sources and publications.
Methodology
Step 1 - Identification of Relevant Samples Size from Population Database


Step 2 - Approaches for Defining Global Market Size (Value, Volume* & Price*)

Note*: In applicable scenarios
Step 3 - Data Sources
Primary Research
- Web Analytics
- Survey Reports
- Research Institute
- Latest Research Reports
- Opinion Leaders
Secondary Research
- Annual Reports
- White Paper
- Latest Press Release
- Industry Association
- Paid Database
- Investor Presentations

Step 4 - Data Triangulation
Involves using different sources of information in order to increase the validity of a study
These sources are likely to be stakeholders in a program - participants, other researchers, program staff, other community members, and so on.
Then we put all data in single framework & apply various statistical tools to find out the dynamic on the market.
During the analysis stage, feedback from the stakeholder groups would be compared to determine areas of agreement as well as areas of divergence