

Key Insights
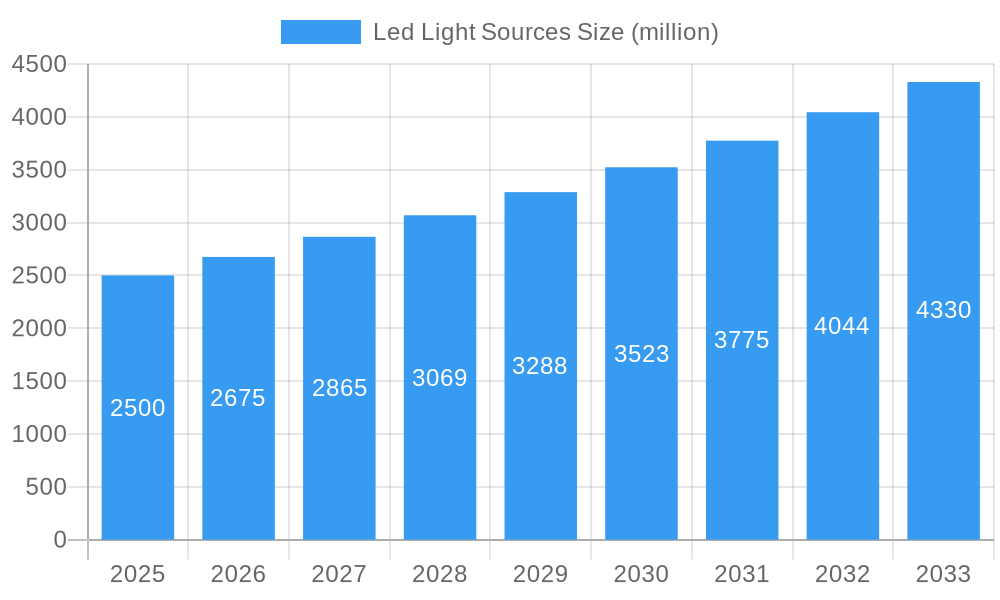
The LED light source market is experiencing robust growth, driven by increasing demand across diverse applications. The market, estimated at $2.5 billion in 2025, is projected to exhibit a Compound Annual Growth Rate (CAGR) of 7% from 2025 to 2033, reaching an estimated market value of $4.5 billion by 2033. This growth is fueled by several key factors. Firstly, the ongoing miniaturization of LED technology, coupled with advancements in efficiency and color rendering, is broadening its applications in microscopy, spectroscopy, and industrial inspection. Secondly, the cost-effectiveness and energy efficiency of LEDs compared to traditional light sources are significantly impacting market adoption. Finally, stringent environmental regulations promoting energy-efficient lighting solutions are further bolstering market expansion. Major players like Olympus, Magnaflux, and Leica Microsystems are actively driving innovation through the development of high-performance LED light sources with improved functionalities and broader compatibility.
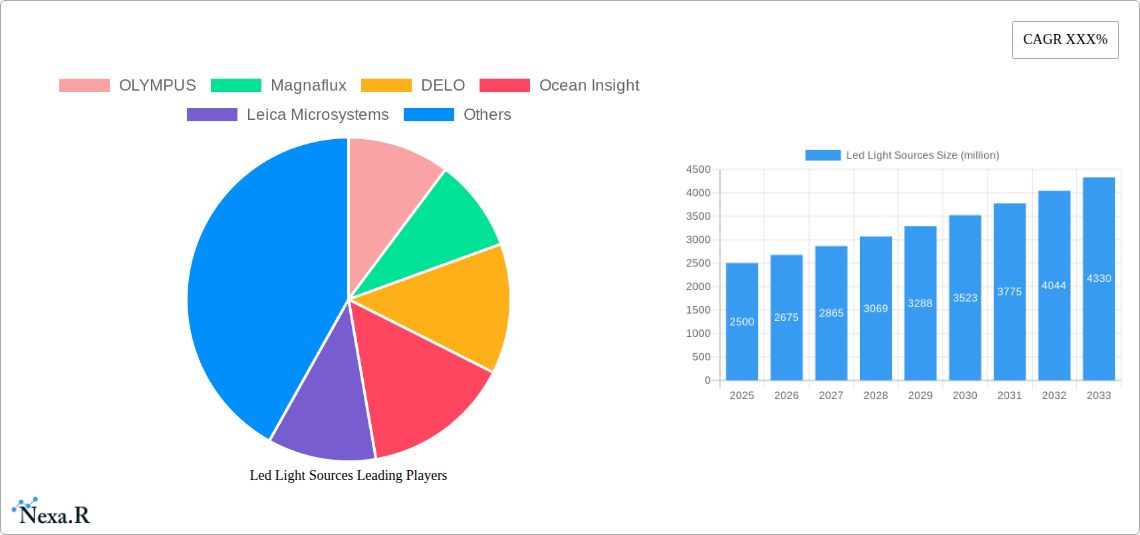
Led Light Sources Market Size (In Billion)
However, the market also faces certain challenges. The competitive landscape, marked by the presence of numerous established and emerging players, leads to intense price competition. Furthermore, the development of new, potentially disruptive technologies could impact market growth. Despite these restraints, the overall outlook for the LED light source market remains positive. Segmentation within the market is expected to evolve with increasing demand for specialized LED solutions tailored to specific applications, including high-power LEDs for industrial applications and specialized wavelengths for scientific research. Regional growth will vary, with North America and Europe maintaining significant market share due to robust technological advancements and established industrial infrastructure, but emerging economies in Asia-Pacific are anticipated to witness significant growth in the coming years.
Led Light Sources Company Market Share
Led Light Sources Market Report: 2019-2033
This comprehensive report provides an in-depth analysis of the Led Light Sources market, encompassing market dynamics, growth trends, regional dominance, product landscape, key players, and future outlook. The study period covers 2019-2033, with 2025 as the base and estimated year. The forecast period is 2025-2033, and the historical period is 2019-2024. This report is crucial for industry professionals, investors, and strategic decision-makers seeking to understand and capitalize on opportunities within this dynamic market. The report covers parent markets such as optoelectronics and child markets like microscopy and industrial inspection.
Led Light Sources Market Dynamics & Structure
The Led Light Sources market, valued at xx million units in 2025, is characterized by moderate concentration, with a few key players holding significant market share. Technological innovation, particularly in areas like miniaturization and efficiency, is a major driver. Stringent regulatory frameworks regarding energy efficiency and environmental impact are influencing market trends. Competitive substitutes, such as traditional lighting technologies, pose a challenge, but LED's superior performance and cost-effectiveness are mitigating this. End-user demographics are broad, spanning diverse sectors including microscopy, medical imaging, industrial inspection, and automotive. M&A activity has been relatively modest (xx deals in the past five years), driven primarily by strategic expansion and technology acquisition.
- Market Concentration: Moderately concentrated, with top 5 players holding xx% market share (2025).
- Technological Innovation: Focus on higher lumen output, improved color rendering, and reduced energy consumption.
- Regulatory Frameworks: Stringent energy efficiency standards in several regions are driving adoption.
- Competitive Substitutes: Traditional lighting technologies (halogen, fluorescent) pose competition, though LED's cost advantage is growing.
- End-User Demographics: Diverse applications across various industries, including life sciences, manufacturing, and automotive.
- M&A Trends: Consolidation driven by technological acquisition and market expansion.
Led Light Sources Growth Trends & Insights
The Led Light Sources market exhibits robust growth, with a projected CAGR of xx% from 2025 to 2033. This growth is fueled by increasing demand across diverse applications, particularly in the life sciences and industrial automation sectors. Technological advancements, such as the development of higher-power LEDs and improved thermal management systems, are further accelerating market expansion. Shifting consumer preferences towards energy-efficient and cost-effective lighting solutions are contributing significantly. Market penetration is expected to reach xx% by 2033. The adoption rate is particularly high in regions with stringent energy efficiency regulations and strong industrial growth. Specific applications, like micro-LED displays and advanced automotive lighting systems, are driving substantial growth.
Dominant Regions, Countries, or Segments in Led Light Sources
North America currently holds the leading position in the Led Light Sources market, driven by robust technological advancements and strong demand from various industry sectors. Europe and Asia-Pacific follow closely, displaying strong growth potential fueled by increasing investments in infrastructure and technological upgrades. The life sciences segment stands out with high adoption due to the increasing need for high-precision illumination in microscopy and medical imaging.
- Key Drivers in North America: Strong R&D investments, stringent environmental regulations, and high adoption in advanced industrial applications.
- Key Drivers in Europe: Focus on energy efficiency, rising adoption in automotive and industrial sectors, and supportive government policies.
- Key Drivers in Asia-Pacific: Rapid industrialization, increasing urbanization, and growing consumer demand for advanced lighting solutions.
- Dominant Segment: Life sciences, driven by high demand for high-precision and high-intensity LED light sources in advanced microscopy and medical imaging.
Led Light Sources Product Landscape
The Led Light Sources market offers a diverse range of products, encompassing various wavelengths, power outputs, and form factors. Key product innovations include the development of high-power LEDs with improved color rendering and efficiency, as well as miniaturized LED arrays for compact applications. Unique selling propositions are increasingly focused on customization, tailored spectral emission, and seamless integration with other systems. Advancements in LED packaging and thermal management enhance reliability and longevity.
Key Drivers, Barriers & Challenges in Led Light Sources
Key Drivers: Increasing demand for energy-efficient lighting, technological advancements in LED technology leading to higher efficiency and longer lifespan, stringent government regulations promoting energy conservation, and expanding applications across various industries.
Key Challenges: Intense competition from established players and new entrants, price fluctuations of raw materials, supply chain disruptions affecting component availability, and the need for continuous innovation to meet evolving market demands. The competition is intensifying, resulting in xx% price reduction pressure in the last two years, impacting profit margins.
Emerging Opportunities in Led Light Sources
The integration of LED light sources with other technologies, such as AI and IoT, presents promising opportunities. Expansion into new markets like smart lighting and augmented reality applications offers significant growth potential. The development of specialized LEDs for specific applications, such as UV-C disinfection and horticultural lighting, presents further avenues for growth. The increasing adoption of advanced LED technologies in the automotive sector also promises significant opportunities.
Growth Accelerators in the Led Light Sources Industry
Strategic collaborations and partnerships among technology providers and end-users are driving market growth. Technological breakthroughs in LED materials and manufacturing processes are improving product performance and reducing costs. Market expansion into emerging economies and developing countries, alongside the increasing adoption of energy-efficient lighting policies, promises to accelerate market growth further.
Key Players Shaping the Led Light Sources Market
Notable Milestones in Led Light Sources Sector
- 2021-Q4: OLYMPUS launched a new line of high-resolution LED light sources for microscopy.
- 2022-Q2: Magnaflux introduced a new LED-based inspection system for industrial applications.
- 2023-Q1: A strategic partnership was formed between DELO and Ocean Insight to develop advanced LED-based sensing solutions. (Further milestones can be added based on available data)
In-Depth Led Light Sources Market Outlook
The Led Light Sources market is poised for continued expansion, driven by technological advancements, increasing demand across various sectors, and supportive government policies. Strategic partnerships and market expansion into emerging economies will further propel growth. Opportunities abound in niche applications, specialized LED technologies, and integration with smart lighting and IoT systems. The market is expected to reach xx million units by 2033, representing significant growth potential for industry players.
Led Light Sources Segmentation
-
1. Application
- 1.1. Industrial
- 1.2. Commercial
- 1.3. Research
- 1.4. Others
-
2. Type
- 2.1. Low Intensity Light Sources
- 2.2. Medium Intensity Light Sources
- 2.3. High Intensity Light Sources
Led Light Sources Segmentation By Geography
-
1. North America
- 1.1. United States
- 1.2. Canada
- 1.3. Mexico
-
2. South America
- 2.1. Brazil
- 2.2. Argentina
- 2.3. Rest of South America
-
3. Europe
- 3.1. United Kingdom
- 3.2. Germany
- 3.3. France
- 3.4. Italy
- 3.5. Spain
- 3.6. Russia
- 3.7. Benelux
- 3.8. Nordics
- 3.9. Rest of Europe
-
4. Middle East & Africa
- 4.1. Turkey
- 4.2. Israel
- 4.3. GCC
- 4.4. North Africa
- 4.5. South Africa
- 4.6. Rest of Middle East & Africa
-
5. Asia Pacific
- 5.1. China
- 5.2. India
- 5.3. Japan
- 5.4. South Korea
- 5.5. ASEAN
- 5.6. Oceania
- 5.7. Rest of Asia Pacific

Led Light Sources Regional Market Share
Geographic Coverage of Led Light Sources
Led Light Sources REPORT HIGHLIGHTS
| Aspects | Details |
|---|---|
| Study Period | 2020-2034 |
| Base Year | 2025 |
| Estimated Year | 2026 |
| Forecast Period | 2026-2034 |
| Historical Period | 2020-2025 |
| Growth Rate | CAGR of 7.8% from 2020-2034 |
| Segmentation |
|
Table of Contents
- 1. Introduction
- 1.1. Research Scope
- 1.2. Market Segmentation
- 1.3. Research Methodology
- 1.4. Definitions and Assumptions
- 2. Executive Summary
- 2.1. Introduction
- 3. Market Dynamics
- 3.1. Introduction
- 3.2. Market Drivers
- 3.3. Market Restrains
- 3.4. Market Trends
- 4. Market Factor Analysis
- 4.1. Porters Five Forces
- 4.2. Supply/Value Chain
- 4.3. PESTEL analysis
- 4.4. Market Entropy
- 4.5. Patent/Trademark Analysis
- 5. Global Led Light Sources Analysis, Insights and Forecast, 2020-2032
- 5.1. Market Analysis, Insights and Forecast - by Application
- 5.1.1. Industrial
- 5.1.2. Commercial
- 5.1.3. Research
- 5.1.4. Others
- 5.2. Market Analysis, Insights and Forecast - by Type
- 5.2.1. Low Intensity Light Sources
- 5.2.2. Medium Intensity Light Sources
- 5.2.3. High Intensity Light Sources
- 5.3. Market Analysis, Insights and Forecast - by Region
- 5.3.1. North America
- 5.3.2. South America
- 5.3.3. Europe
- 5.3.4. Middle East & Africa
- 5.3.5. Asia Pacific
- 5.1. Market Analysis, Insights and Forecast - by Application
- 6. North America Led Light Sources Analysis, Insights and Forecast, 2020-2032
- 6.1. Market Analysis, Insights and Forecast - by Application
- 6.1.1. Industrial
- 6.1.2. Commercial
- 6.1.3. Research
- 6.1.4. Others
- 6.2. Market Analysis, Insights and Forecast - by Type
- 6.2.1. Low Intensity Light Sources
- 6.2.2. Medium Intensity Light Sources
- 6.2.3. High Intensity Light Sources
- 6.1. Market Analysis, Insights and Forecast - by Application
- 7. South America Led Light Sources Analysis, Insights and Forecast, 2020-2032
- 7.1. Market Analysis, Insights and Forecast - by Application
- 7.1.1. Industrial
- 7.1.2. Commercial
- 7.1.3. Research
- 7.1.4. Others
- 7.2. Market Analysis, Insights and Forecast - by Type
- 7.2.1. Low Intensity Light Sources
- 7.2.2. Medium Intensity Light Sources
- 7.2.3. High Intensity Light Sources
- 7.1. Market Analysis, Insights and Forecast - by Application
- 8. Europe Led Light Sources Analysis, Insights and Forecast, 2020-2032
- 8.1. Market Analysis, Insights and Forecast - by Application
- 8.1.1. Industrial
- 8.1.2. Commercial
- 8.1.3. Research
- 8.1.4. Others
- 8.2. Market Analysis, Insights and Forecast - by Type
- 8.2.1. Low Intensity Light Sources
- 8.2.2. Medium Intensity Light Sources
- 8.2.3. High Intensity Light Sources
- 8.1. Market Analysis, Insights and Forecast - by Application
- 9. Middle East & Africa Led Light Sources Analysis, Insights and Forecast, 2020-2032
- 9.1. Market Analysis, Insights and Forecast - by Application
- 9.1.1. Industrial
- 9.1.2. Commercial
- 9.1.3. Research
- 9.1.4. Others
- 9.2. Market Analysis, Insights and Forecast - by Type
- 9.2.1. Low Intensity Light Sources
- 9.2.2. Medium Intensity Light Sources
- 9.2.3. High Intensity Light Sources
- 9.1. Market Analysis, Insights and Forecast - by Application
- 10. Asia Pacific Led Light Sources Analysis, Insights and Forecast, 2020-2032
- 10.1. Market Analysis, Insights and Forecast - by Application
- 10.1.1. Industrial
- 10.1.2. Commercial
- 10.1.3. Research
- 10.1.4. Others
- 10.2. Market Analysis, Insights and Forecast - by Type
- 10.2.1. Low Intensity Light Sources
- 10.2.2. Medium Intensity Light Sources
- 10.2.3. High Intensity Light Sources
- 10.1. Market Analysis, Insights and Forecast - by Application
- 11. Competitive Analysis
- 11.1. Global Market Share Analysis 2025
- 11.2. Company Profiles
- 11.2.1 OLYMPUS
- 11.2.1.1. Overview
- 11.2.1.2. Products
- 11.2.1.3. SWOT Analysis
- 11.2.1.4. Recent Developments
- 11.2.1.5. Financials (Based on Availability)
- 11.2.2 Magnaflux
- 11.2.2.1. Overview
- 11.2.2.2. Products
- 11.2.2.3. SWOT Analysis
- 11.2.2.4. Recent Developments
- 11.2.2.5. Financials (Based on Availability)
- 11.2.3 DELO
- 11.2.3.1. Overview
- 11.2.3.2. Products
- 11.2.3.3. SWOT Analysis
- 11.2.3.4. Recent Developments
- 11.2.3.5. Financials (Based on Availability)
- 11.2.4 Ocean Insight
- 11.2.4.1. Overview
- 11.2.4.2. Products
- 11.2.4.3. SWOT Analysis
- 11.2.4.4. Recent Developments
- 11.2.4.5. Financials (Based on Availability)
- 11.2.5 Leica Microsystems
- 11.2.5.1. Overview
- 11.2.5.2. Products
- 11.2.5.3. SWOT Analysis
- 11.2.5.4. Recent Developments
- 11.2.5.5. Financials (Based on Availability)
- 11.2.6 Avantes
- 11.2.6.1. Overview
- 11.2.6.2. Products
- 11.2.6.3. SWOT Analysis
- 11.2.6.4. Recent Developments
- 11.2.6.5. Financials (Based on Availability)
- 11.2.7 Galvoptics
- 11.2.7.1. Overview
- 11.2.7.2. Products
- 11.2.7.3. SWOT Analysis
- 11.2.7.4. Recent Developments
- 11.2.7.5. Financials (Based on Availability)
- 11.2.8 WILD Group
- 11.2.8.1. Overview
- 11.2.8.2. Products
- 11.2.8.3. SWOT Analysis
- 11.2.8.4. Recent Developments
- 11.2.8.5. Financials (Based on Availability)
- 11.2.9 Jenoptik
- 11.2.9.1. Overview
- 11.2.9.2. Products
- 11.2.9.3. SWOT Analysis
- 11.2.9.4. Recent Developments
- 11.2.9.5. Financials (Based on Availability)
- 11.2.10 Zolix
- 11.2.10.1. Overview
- 11.2.10.2. Products
- 11.2.10.3. SWOT Analysis
- 11.2.10.4. Recent Developments
- 11.2.10.5. Financials (Based on Availability)
- 11.2.11 HORIBA
- 11.2.11.1. Overview
- 11.2.11.2. Products
- 11.2.11.3. SWOT Analysis
- 11.2.11.4. Recent Developments
- 11.2.11.5. Financials (Based on Availability)
- 11.2.1 OLYMPUS
List of Figures
- Figure 1: Global Led Light Sources Revenue Breakdown (undefined, %) by Region 2025 & 2033
- Figure 2: Global Led Light Sources Volume Breakdown (K, %) by Region 2025 & 2033
- Figure 3: North America Led Light Sources Revenue (undefined), by Application 2025 & 2033
- Figure 4: North America Led Light Sources Volume (K), by Application 2025 & 2033
- Figure 5: North America Led Light Sources Revenue Share (%), by Application 2025 & 2033
- Figure 6: North America Led Light Sources Volume Share (%), by Application 2025 & 2033
- Figure 7: North America Led Light Sources Revenue (undefined), by Type 2025 & 2033
- Figure 8: North America Led Light Sources Volume (K), by Type 2025 & 2033
- Figure 9: North America Led Light Sources Revenue Share (%), by Type 2025 & 2033
- Figure 10: North America Led Light Sources Volume Share (%), by Type 2025 & 2033
- Figure 11: North America Led Light Sources Revenue (undefined), by Country 2025 & 2033
- Figure 12: North America Led Light Sources Volume (K), by Country 2025 & 2033
- Figure 13: North America Led Light Sources Revenue Share (%), by Country 2025 & 2033
- Figure 14: North America Led Light Sources Volume Share (%), by Country 2025 & 2033
- Figure 15: South America Led Light Sources Revenue (undefined), by Application 2025 & 2033
- Figure 16: South America Led Light Sources Volume (K), by Application 2025 & 2033
- Figure 17: South America Led Light Sources Revenue Share (%), by Application 2025 & 2033
- Figure 18: South America Led Light Sources Volume Share (%), by Application 2025 & 2033
- Figure 19: South America Led Light Sources Revenue (undefined), by Type 2025 & 2033
- Figure 20: South America Led Light Sources Volume (K), by Type 2025 & 2033
- Figure 21: South America Led Light Sources Revenue Share (%), by Type 2025 & 2033
- Figure 22: South America Led Light Sources Volume Share (%), by Type 2025 & 2033
- Figure 23: South America Led Light Sources Revenue (undefined), by Country 2025 & 2033
- Figure 24: South America Led Light Sources Volume (K), by Country 2025 & 2033
- Figure 25: South America Led Light Sources Revenue Share (%), by Country 2025 & 2033
- Figure 26: South America Led Light Sources Volume Share (%), by Country 2025 & 2033
- Figure 27: Europe Led Light Sources Revenue (undefined), by Application 2025 & 2033
- Figure 28: Europe Led Light Sources Volume (K), by Application 2025 & 2033
- Figure 29: Europe Led Light Sources Revenue Share (%), by Application 2025 & 2033
- Figure 30: Europe Led Light Sources Volume Share (%), by Application 2025 & 2033
- Figure 31: Europe Led Light Sources Revenue (undefined), by Type 2025 & 2033
- Figure 32: Europe Led Light Sources Volume (K), by Type 2025 & 2033
- Figure 33: Europe Led Light Sources Revenue Share (%), by Type 2025 & 2033
- Figure 34: Europe Led Light Sources Volume Share (%), by Type 2025 & 2033
- Figure 35: Europe Led Light Sources Revenue (undefined), by Country 2025 & 2033
- Figure 36: Europe Led Light Sources Volume (K), by Country 2025 & 2033
- Figure 37: Europe Led Light Sources Revenue Share (%), by Country 2025 & 2033
- Figure 38: Europe Led Light Sources Volume Share (%), by Country 2025 & 2033
- Figure 39: Middle East & Africa Led Light Sources Revenue (undefined), by Application 2025 & 2033
- Figure 40: Middle East & Africa Led Light Sources Volume (K), by Application 2025 & 2033
- Figure 41: Middle East & Africa Led Light Sources Revenue Share (%), by Application 2025 & 2033
- Figure 42: Middle East & Africa Led Light Sources Volume Share (%), by Application 2025 & 2033
- Figure 43: Middle East & Africa Led Light Sources Revenue (undefined), by Type 2025 & 2033
- Figure 44: Middle East & Africa Led Light Sources Volume (K), by Type 2025 & 2033
- Figure 45: Middle East & Africa Led Light Sources Revenue Share (%), by Type 2025 & 2033
- Figure 46: Middle East & Africa Led Light Sources Volume Share (%), by Type 2025 & 2033
- Figure 47: Middle East & Africa Led Light Sources Revenue (undefined), by Country 2025 & 2033
- Figure 48: Middle East & Africa Led Light Sources Volume (K), by Country 2025 & 2033
- Figure 49: Middle East & Africa Led Light Sources Revenue Share (%), by Country 2025 & 2033
- Figure 50: Middle East & Africa Led Light Sources Volume Share (%), by Country 2025 & 2033
- Figure 51: Asia Pacific Led Light Sources Revenue (undefined), by Application 2025 & 2033
- Figure 52: Asia Pacific Led Light Sources Volume (K), by Application 2025 & 2033
- Figure 53: Asia Pacific Led Light Sources Revenue Share (%), by Application 2025 & 2033
- Figure 54: Asia Pacific Led Light Sources Volume Share (%), by Application 2025 & 2033
- Figure 55: Asia Pacific Led Light Sources Revenue (undefined), by Type 2025 & 2033
- Figure 56: Asia Pacific Led Light Sources Volume (K), by Type 2025 & 2033
- Figure 57: Asia Pacific Led Light Sources Revenue Share (%), by Type 2025 & 2033
- Figure 58: Asia Pacific Led Light Sources Volume Share (%), by Type 2025 & 2033
- Figure 59: Asia Pacific Led Light Sources Revenue (undefined), by Country 2025 & 2033
- Figure 60: Asia Pacific Led Light Sources Volume (K), by Country 2025 & 2033
- Figure 61: Asia Pacific Led Light Sources Revenue Share (%), by Country 2025 & 2033
- Figure 62: Asia Pacific Led Light Sources Volume Share (%), by Country 2025 & 2033
List of Tables
- Table 1: Global Led Light Sources Revenue undefined Forecast, by Application 2020 & 2033
- Table 2: Global Led Light Sources Volume K Forecast, by Application 2020 & 2033
- Table 3: Global Led Light Sources Revenue undefined Forecast, by Type 2020 & 2033
- Table 4: Global Led Light Sources Volume K Forecast, by Type 2020 & 2033
- Table 5: Global Led Light Sources Revenue undefined Forecast, by Region 2020 & 2033
- Table 6: Global Led Light Sources Volume K Forecast, by Region 2020 & 2033
- Table 7: Global Led Light Sources Revenue undefined Forecast, by Application 2020 & 2033
- Table 8: Global Led Light Sources Volume K Forecast, by Application 2020 & 2033
- Table 9: Global Led Light Sources Revenue undefined Forecast, by Type 2020 & 2033
- Table 10: Global Led Light Sources Volume K Forecast, by Type 2020 & 2033
- Table 11: Global Led Light Sources Revenue undefined Forecast, by Country 2020 & 2033
- Table 12: Global Led Light Sources Volume K Forecast, by Country 2020 & 2033
- Table 13: United States Led Light Sources Revenue (undefined) Forecast, by Application 2020 & 2033
- Table 14: United States Led Light Sources Volume (K) Forecast, by Application 2020 & 2033
- Table 15: Canada Led Light Sources Revenue (undefined) Forecast, by Application 2020 & 2033
- Table 16: Canada Led Light Sources Volume (K) Forecast, by Application 2020 & 2033
- Table 17: Mexico Led Light Sources Revenue (undefined) Forecast, by Application 2020 & 2033
- Table 18: Mexico Led Light Sources Volume (K) Forecast, by Application 2020 & 2033
- Table 19: Global Led Light Sources Revenue undefined Forecast, by Application 2020 & 2033
- Table 20: Global Led Light Sources Volume K Forecast, by Application 2020 & 2033
- Table 21: Global Led Light Sources Revenue undefined Forecast, by Type 2020 & 2033
- Table 22: Global Led Light Sources Volume K Forecast, by Type 2020 & 2033
- Table 23: Global Led Light Sources Revenue undefined Forecast, by Country 2020 & 2033
- Table 24: Global Led Light Sources Volume K Forecast, by Country 2020 & 2033
- Table 25: Brazil Led Light Sources Revenue (undefined) Forecast, by Application 2020 & 2033
- Table 26: Brazil Led Light Sources Volume (K) Forecast, by Application 2020 & 2033
- Table 27: Argentina Led Light Sources Revenue (undefined) Forecast, by Application 2020 & 2033
- Table 28: Argentina Led Light Sources Volume (K) Forecast, by Application 2020 & 2033
- Table 29: Rest of South America Led Light Sources Revenue (undefined) Forecast, by Application 2020 & 2033
- Table 30: Rest of South America Led Light Sources Volume (K) Forecast, by Application 2020 & 2033
- Table 31: Global Led Light Sources Revenue undefined Forecast, by Application 2020 & 2033
- Table 32: Global Led Light Sources Volume K Forecast, by Application 2020 & 2033
- Table 33: Global Led Light Sources Revenue undefined Forecast, by Type 2020 & 2033
- Table 34: Global Led Light Sources Volume K Forecast, by Type 2020 & 2033
- Table 35: Global Led Light Sources Revenue undefined Forecast, by Country 2020 & 2033
- Table 36: Global Led Light Sources Volume K Forecast, by Country 2020 & 2033
- Table 37: United Kingdom Led Light Sources Revenue (undefined) Forecast, by Application 2020 & 2033
- Table 38: United Kingdom Led Light Sources Volume (K) Forecast, by Application 2020 & 2033
- Table 39: Germany Led Light Sources Revenue (undefined) Forecast, by Application 2020 & 2033
- Table 40: Germany Led Light Sources Volume (K) Forecast, by Application 2020 & 2033
- Table 41: France Led Light Sources Revenue (undefined) Forecast, by Application 2020 & 2033
- Table 42: France Led Light Sources Volume (K) Forecast, by Application 2020 & 2033
- Table 43: Italy Led Light Sources Revenue (undefined) Forecast, by Application 2020 & 2033
- Table 44: Italy Led Light Sources Volume (K) Forecast, by Application 2020 & 2033
- Table 45: Spain Led Light Sources Revenue (undefined) Forecast, by Application 2020 & 2033
- Table 46: Spain Led Light Sources Volume (K) Forecast, by Application 2020 & 2033
- Table 47: Russia Led Light Sources Revenue (undefined) Forecast, by Application 2020 & 2033
- Table 48: Russia Led Light Sources Volume (K) Forecast, by Application 2020 & 2033
- Table 49: Benelux Led Light Sources Revenue (undefined) Forecast, by Application 2020 & 2033
- Table 50: Benelux Led Light Sources Volume (K) Forecast, by Application 2020 & 2033
- Table 51: Nordics Led Light Sources Revenue (undefined) Forecast, by Application 2020 & 2033
- Table 52: Nordics Led Light Sources Volume (K) Forecast, by Application 2020 & 2033
- Table 53: Rest of Europe Led Light Sources Revenue (undefined) Forecast, by Application 2020 & 2033
- Table 54: Rest of Europe Led Light Sources Volume (K) Forecast, by Application 2020 & 2033
- Table 55: Global Led Light Sources Revenue undefined Forecast, by Application 2020 & 2033
- Table 56: Global Led Light Sources Volume K Forecast, by Application 2020 & 2033
- Table 57: Global Led Light Sources Revenue undefined Forecast, by Type 2020 & 2033
- Table 58: Global Led Light Sources Volume K Forecast, by Type 2020 & 2033
- Table 59: Global Led Light Sources Revenue undefined Forecast, by Country 2020 & 2033
- Table 60: Global Led Light Sources Volume K Forecast, by Country 2020 & 2033
- Table 61: Turkey Led Light Sources Revenue (undefined) Forecast, by Application 2020 & 2033
- Table 62: Turkey Led Light Sources Volume (K) Forecast, by Application 2020 & 2033
- Table 63: Israel Led Light Sources Revenue (undefined) Forecast, by Application 2020 & 2033
- Table 64: Israel Led Light Sources Volume (K) Forecast, by Application 2020 & 2033
- Table 65: GCC Led Light Sources Revenue (undefined) Forecast, by Application 2020 & 2033
- Table 66: GCC Led Light Sources Volume (K) Forecast, by Application 2020 & 2033
- Table 67: North Africa Led Light Sources Revenue (undefined) Forecast, by Application 2020 & 2033
- Table 68: North Africa Led Light Sources Volume (K) Forecast, by Application 2020 & 2033
- Table 69: South Africa Led Light Sources Revenue (undefined) Forecast, by Application 2020 & 2033
- Table 70: South Africa Led Light Sources Volume (K) Forecast, by Application 2020 & 2033
- Table 71: Rest of Middle East & Africa Led Light Sources Revenue (undefined) Forecast, by Application 2020 & 2033
- Table 72: Rest of Middle East & Africa Led Light Sources Volume (K) Forecast, by Application 2020 & 2033
- Table 73: Global Led Light Sources Revenue undefined Forecast, by Application 2020 & 2033
- Table 74: Global Led Light Sources Volume K Forecast, by Application 2020 & 2033
- Table 75: Global Led Light Sources Revenue undefined Forecast, by Type 2020 & 2033
- Table 76: Global Led Light Sources Volume K Forecast, by Type 2020 & 2033
- Table 77: Global Led Light Sources Revenue undefined Forecast, by Country 2020 & 2033
- Table 78: Global Led Light Sources Volume K Forecast, by Country 2020 & 2033
- Table 79: China Led Light Sources Revenue (undefined) Forecast, by Application 2020 & 2033
- Table 80: China Led Light Sources Volume (K) Forecast, by Application 2020 & 2033
- Table 81: India Led Light Sources Revenue (undefined) Forecast, by Application 2020 & 2033
- Table 82: India Led Light Sources Volume (K) Forecast, by Application 2020 & 2033
- Table 83: Japan Led Light Sources Revenue (undefined) Forecast, by Application 2020 & 2033
- Table 84: Japan Led Light Sources Volume (K) Forecast, by Application 2020 & 2033
- Table 85: South Korea Led Light Sources Revenue (undefined) Forecast, by Application 2020 & 2033
- Table 86: South Korea Led Light Sources Volume (K) Forecast, by Application 2020 & 2033
- Table 87: ASEAN Led Light Sources Revenue (undefined) Forecast, by Application 2020 & 2033
- Table 88: ASEAN Led Light Sources Volume (K) Forecast, by Application 2020 & 2033
- Table 89: Oceania Led Light Sources Revenue (undefined) Forecast, by Application 2020 & 2033
- Table 90: Oceania Led Light Sources Volume (K) Forecast, by Application 2020 & 2033
- Table 91: Rest of Asia Pacific Led Light Sources Revenue (undefined) Forecast, by Application 2020 & 2033
- Table 92: Rest of Asia Pacific Led Light Sources Volume (K) Forecast, by Application 2020 & 2033
Frequently Asked Questions
1. What is the projected Compound Annual Growth Rate (CAGR) of the Led Light Sources?
The projected CAGR is approximately 7.8%.
2. Which companies are prominent players in the Led Light Sources?
Key companies in the market include OLYMPUS, Magnaflux, DELO, Ocean Insight, Leica Microsystems, Avantes, Galvoptics, WILD Group, Jenoptik, Zolix, HORIBA.
3. What are the main segments of the Led Light Sources?
The market segments include Application, Type.
4. Can you provide details about the market size?
The market size is estimated to be USD XXX N/A as of 2022.
5. What are some drivers contributing to market growth?
N/A
6. What are the notable trends driving market growth?
N/A
7. Are there any restraints impacting market growth?
N/A
8. Can you provide examples of recent developments in the market?
N/A
9. What pricing options are available for accessing the report?
Pricing options include single-user, multi-user, and enterprise licenses priced at USD 3950.00, USD 5925.00, and USD 7900.00 respectively.
10. Is the market size provided in terms of value or volume?
The market size is provided in terms of value, measured in N/A and volume, measured in K.
11. Are there any specific market keywords associated with the report?
Yes, the market keyword associated with the report is "Led Light Sources," which aids in identifying and referencing the specific market segment covered.
12. How do I determine which pricing option suits my needs best?
The pricing options vary based on user requirements and access needs. Individual users may opt for single-user licenses, while businesses requiring broader access may choose multi-user or enterprise licenses for cost-effective access to the report.
13. Are there any additional resources or data provided in the Led Light Sources report?
While the report offers comprehensive insights, it's advisable to review the specific contents or supplementary materials provided to ascertain if additional resources or data are available.
14. How can I stay updated on further developments or reports in the Led Light Sources?
To stay informed about further developments, trends, and reports in the Led Light Sources, consider subscribing to industry newsletters, following relevant companies and organizations, or regularly checking reputable industry news sources and publications.
Methodology
Step 1 - Identification of Relevant Samples Size from Population Database


Step 2 - Approaches for Defining Global Market Size (Value, Volume* & Price*)

Note*: In applicable scenarios
Step 3 - Data Sources
Primary Research
- Web Analytics
- Survey Reports
- Research Institute
- Latest Research Reports
- Opinion Leaders
Secondary Research
- Annual Reports
- White Paper
- Latest Press Release
- Industry Association
- Paid Database
- Investor Presentations

Step 4 - Data Triangulation
Involves using different sources of information in order to increase the validity of a study
These sources are likely to be stakeholders in a program - participants, other researchers, program staff, other community members, and so on.
Then we put all data in single framework & apply various statistical tools to find out the dynamic on the market.
During the analysis stage, feedback from the stakeholder groups would be compared to determine areas of agreement as well as areas of divergence