

Key Insights
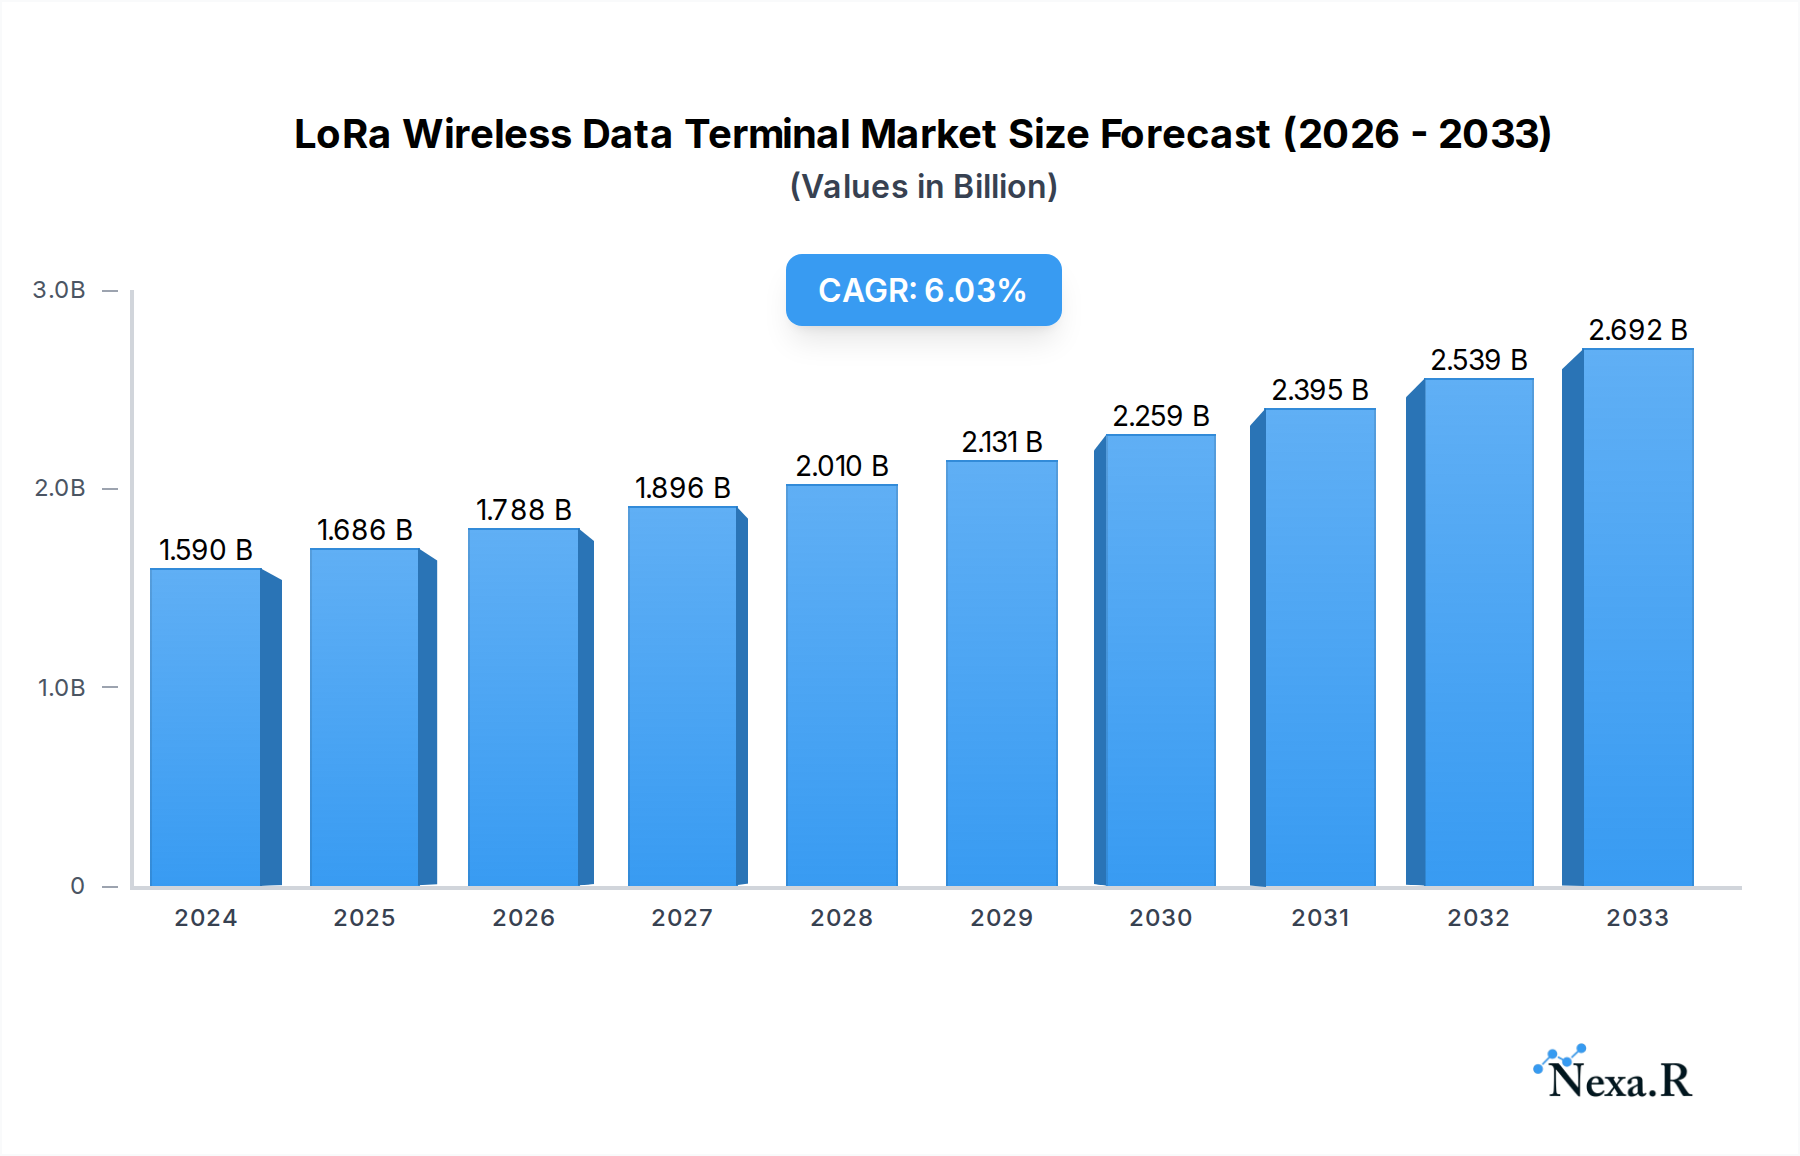
The global LoRa Wireless Data Terminal market is poised for robust expansion, currently estimated at $1.59 billion in 2024. The market is projected to witness a healthy Compound Annual Growth Rate (CAGR) of 6.1% during the forecast period of 2025-2033. This sustained growth is primarily fueled by the escalating demand for efficient and cost-effective wireless data solutions across various industries. The increasing adoption of the Internet of Things (IoT) ecosystem, characterized by a surge in connected devices, is a significant driver. LoRa technology's inherent advantages, such as long-range communication capabilities, low power consumption, and excellent penetration through obstacles, make it an ideal choice for applications requiring reliable data transmission over extended areas and in challenging environments. This positions LoRa wireless data terminals as a critical component in smart city initiatives, industrial automation, agriculture, and asset tracking. The need for real-time data collection and remote monitoring is further propelling market growth as businesses seek to optimize operations, reduce downtime, and enhance decision-making processes through actionable insights derived from connected devices.

LoRa Wireless Data Terminal Market Size (In Billion)
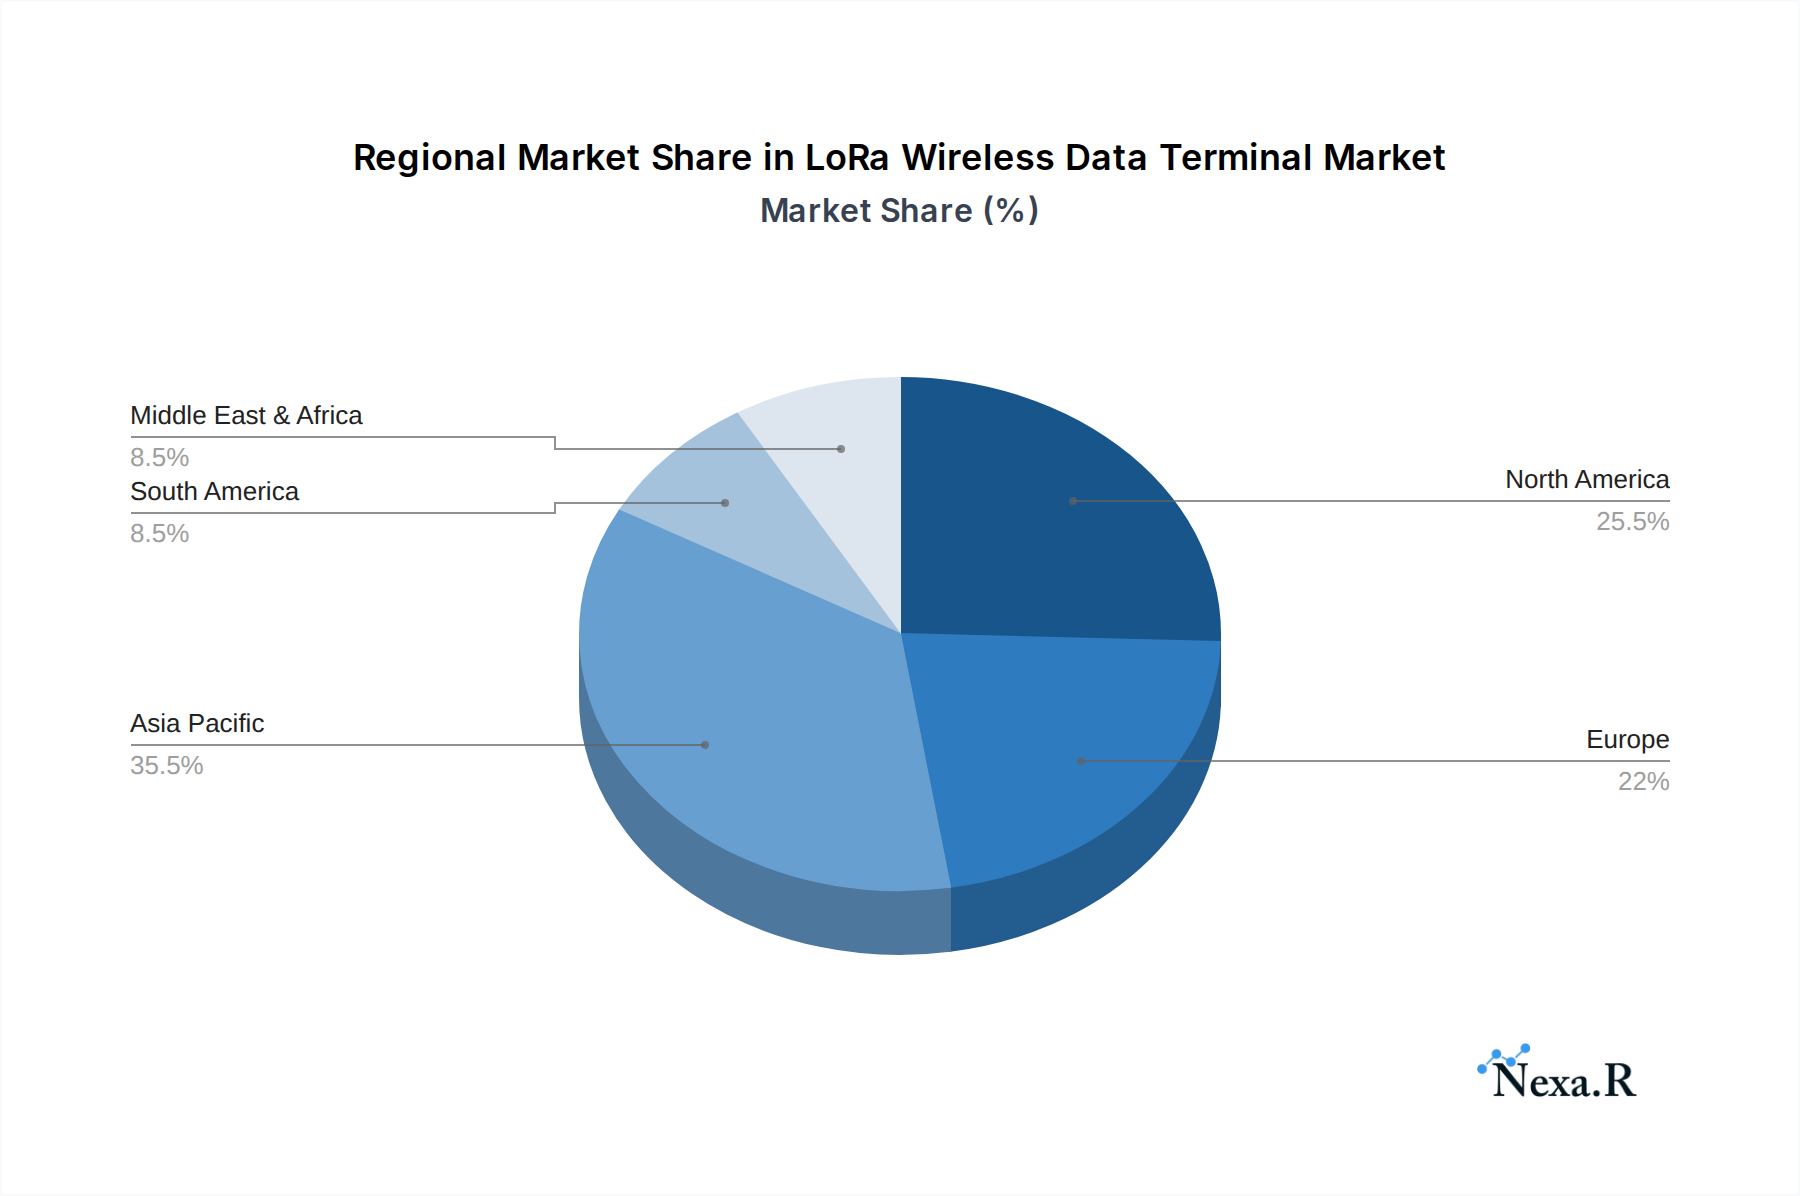
The market is segmented by application, with Remote Meter Reading and Industrial Data Collection emerging as key growth areas, benefiting from the drive towards smart grids and Industry 4.0. The "Others" segment, encompassing diverse applications like environmental monitoring and smart logistics, also presents substantial opportunities. In terms of transmission distance, terminals capable of covering distances above 8000m are anticipated to witness the highest demand, reflecting the inherent strength of LoRa technology. Geographically, Asia Pacific, led by China and India, is expected to be a dominant region due to rapid industrialization and increasing IoT deployments. North America and Europe, with their established IoT infrastructure and focus on smart city development, will also contribute significantly to market expansion. While the market exhibits strong growth potential, potential restraints such as increasing competition from other low-power wide-area network (LPWAN) technologies and the need for skilled personnel for deployment and maintenance warrant careful consideration. However, ongoing technological advancements and increasing investment in IoT infrastructure are expected to mitigate these challenges, ensuring a positive trajectory for the LoRa Wireless Data Terminal market.
LoRa Wireless Data Terminal Company Market Share
LoRa Wireless Data Terminal Market: Comprehensive Analysis and Future Outlook (2019-2033)
This in-depth report provides a detailed analysis of the global LoRa Wireless Data Terminal market, encompassing market dynamics, growth trends, regional dominance, product landscape, key drivers, challenges, opportunities, and a comprehensive outlook for the period 2019-2033. With a base year of 2025 and a forecast period extending to 2033, this report offers critical insights for industry stakeholders.
LoRa Wireless Data Terminal Market Dynamics & Structure
The LoRa Wireless Data Terminal market is characterized by moderate concentration, with a few key players holding significant market share while a growing number of smaller companies contribute to the competitive landscape. Technological innovation is a primary driver, fueled by ongoing advancements in low-power wide-area network (LPWAN) technology, enabling longer transmission ranges and enhanced data throughput. Regulatory frameworks, particularly concerning spectrum allocation and data security, play a crucial role in shaping market accessibility and deployment strategies. Competitive product substitutes, such as other LPWAN technologies (e.g., NB-IoT, Sigfox) and traditional wireless solutions, present a constant challenge, pushing for continuous improvement in LoRa terminal capabilities and cost-effectiveness. End-user demographics are shifting towards industries demanding reliable, low-cost, and long-range data transmission, including utilities, agriculture, and industrial automation. Mergers and acquisitions (M&A) are a notable trend, as larger companies seek to consolidate their market position, acquire innovative technologies, and expand their product portfolios.
- Market Concentration: Moderate, with established players and a rising number of new entrants.
- Technological Innovation Drivers: LPWAN advancements, miniaturization, enhanced security features, and lower power consumption.
- Regulatory Frameworks: Spectrum allocation policies, data privacy regulations (e.g., GDPR), and certification requirements.
- Competitive Product Substitutes: NB-IoT, Sigfox, Zigbee, Wi-Fi, cellular IoT solutions.
- End-User Demographics: Utilities (smart metering), industrial IoT, smart agriculture, environmental monitoring, logistics.
- M&A Trends: Consolidation for market share, technology acquisition, and portfolio expansion.
LoRa Wireless Data Terminal Growth Trends & Insights
The LoRa Wireless Data Terminal market is poised for robust growth, projected to expand from approximately $2.5 billion in 2025 to an estimated $8.9 billion by 2033, exhibiting a compound annual growth rate (CAGR) of 17.2% during the forecast period. This significant market size evolution is driven by increasing adoption rates across various industrial and commercial applications, particularly in the realms of remote meter reading and industrial data collection. Technological disruptions, such as advancements in LoRaWAN protocols and the integration of AI for data analytics at the edge, are further accelerating adoption. Consumer behavior shifts are evident, with a growing demand for real-time data insights and the ability to remotely monitor and control assets across vast geographical areas. The market penetration of LoRa Wireless Data Terminals is expected to climb steadily as the cost-effectiveness and reliability of LoRa technology become more widely recognized and adopted by businesses of all sizes.
- Market Size Evolution: Projected to grow from $2.5 billion (2025) to $8.9 billion (2033).
- CAGR: 17.2% (2025-2033).
- Adoption Rates: High and accelerating, driven by cost-efficiency and long-range capabilities.
- Technological Disruptions: LoRaWAN protocol enhancements, edge AI integration, improved power management.
- Consumer Behavior Shifts: Increased demand for real-time data, remote asset monitoring, and predictive maintenance.
- Market Penetration: Steadily increasing across diverse sectors.
Dominant Regions, Countries, or Segments in LoRa Wireless Data Terminal
The Application segment of Industrial Data Collection is anticipated to be the dominant force driving market growth within the LoRa Wireless Data Terminal sector. This dominance stems from the inherent need for reliable, long-range, and low-power data transmission in diverse industrial environments, ranging from manufacturing plants and oil and gas facilities to smart grids and mining operations. The Transmission Distance Above 8000m type also holds significant sway, as industries often require extensive coverage, eliminating the need for multiple gateways and reducing infrastructure costs. Economically, developed regions like North America and Europe are leading in adoption due to robust industrial bases and early integration of IoT solutions. However, the Asia-Pacific region is exhibiting the fastest growth, fueled by rapid industrialization, smart city initiatives, and supportive government policies promoting IoT adoption. Key drivers include the need for improved operational efficiency, predictive maintenance, asset tracking, and enhanced safety protocols in industrial settings.
- Dominant Application Segment: Industrial Data Collection.
- Dominant Type Segment: Transmission Distance Above 8000m.
- Leading Regions: North America, Europe (currently), Asia-Pacific (fastest growing).
- Key Drivers for Dominance:
- Industrial Data Collection: Need for operational efficiency, predictive maintenance, asset tracking, safety enhancement in factories, energy, and resources.
- Transmission Distance Above 8000m: Reduced infrastructure costs, extensive coverage, suitability for remote and challenging environments.
- Asia-Pacific Growth: Rapid industrialization, smart city development, government initiatives, increasing IoT investments.
- North America/Europe Growth: Mature industrial base, advanced IoT infrastructure, stringent regulatory requirements for efficiency and safety.
- Market Share: Industrial Data Collection segment is estimated to hold over 35% of the market share in 2025. Transmission Distance Above 8000m is expected to account for approximately 30% of the market.
LoRa Wireless Data Terminal Product Landscape
The LoRa Wireless Data Terminal product landscape is characterized by a focus on ruggedness, enhanced security, and improved power efficiency. Manufacturers are developing terminals capable of withstanding harsh environmental conditions, making them ideal for outdoor and industrial deployments. Innovations include integrated sensors for real-time data capture, advanced encryption for secure data transmission, and extended battery life to minimize maintenance requirements. The performance metrics are increasingly emphasizing higher data rates, lower latency, and greater network capacity, enabling more sophisticated IoT applications. Unique selling propositions often lie in the combination of long-range communication capabilities with compact form factors and flexible deployment options.
Key Drivers, Barriers & Challenges in LoRa Wireless Data Terminal
Key Drivers:
- Cost-Effectiveness: LoRa technology offers a significantly lower cost of deployment and operation compared to traditional cellular or Wi-Fi solutions, especially for large-scale, low-data-rate applications.
- Long-Range Communication: The inherent ability of LoRa to transmit data over several kilometers is a critical advantage for remote monitoring and data collection in expansive areas.
- Low Power Consumption: LoRa terminals consume minimal power, enabling battery-powered devices to operate for years without replacement, reducing maintenance overhead.
- Growing IoT Adoption: The pervasive growth of the Internet of Things across various industries is creating a substantial demand for reliable and efficient wireless communication solutions.
- Smart City Initiatives: Government-led smart city projects are increasingly relying on LPWAN technologies like LoRa for applications such as smart metering, waste management, and environmental monitoring.
Barriers & Challenges:
- Limited Bandwidth: While suitable for many IoT applications, LoRa's bandwidth is limited, making it unsuitable for high-data-rate applications like video streaming.
- Interference: In densely populated areas or industrial environments, interference from other wireless devices can impact network performance and data reliability.
- Scalability Concerns: While LoRaWAN networks can be scaled, managing very large networks with millions of devices can present operational and management challenges.
- Security Vulnerabilities: Although encryption is employed, ensuring end-to-end security across complex IoT networks remains a critical concern.
- Competition from Other LPWAN Technologies: NB-IoT and Sigfox offer competing solutions with different advantages and disadvantages, creating a competitive market landscape.
- Supply Chain Disruptions: Global supply chain issues can impact the availability and cost of critical components for LoRa terminal manufacturing.
Emerging Opportunities in LoRa Wireless Data Terminal
Emerging opportunities in the LoRa Wireless Data Terminal market lie in the expansion of smart agriculture, where real-time soil monitoring, irrigation control, and livestock tracking can significantly improve yields and resource management. The increasing focus on environmental monitoring, including air and water quality, pollution tracking, and wildlife conservation, presents a significant untapped market. Furthermore, the development of smart building solutions beyond basic energy management, encompassing predictive maintenance of HVAC systems, intelligent lighting, and occupancy sensing, offers substantial growth potential. The integration of LoRa with blockchain technology for enhanced data security and traceability in supply chain management is another promising avenue.
Growth Accelerators in the LoRa Wireless Data Terminal Industry
Growth accelerators in the LoRa Wireless Data Terminal industry are primarily driven by technological breakthroughs such as the evolution of LoRaWAN standards to support increased data rates and lower latency, making it suitable for more sophisticated applications. Strategic partnerships between LoRa module manufacturers, gateway providers, and application developers are crucial for creating integrated end-to-end solutions. Market expansion strategies targeting developing economies, where the cost-effectiveness of LoRa is particularly attractive for infrastructure development, are also key growth catalysts. The increasing adoption of LoRa by major industrial players for large-scale deployments and the continuous innovation in chip-level integration, reducing the cost and size of terminals, will further propel market growth.
Key Players Shaping the LoRa Wireless Data Terminal Market
- Bausch Datacom
- Circuit Design, Inc.
- Ruixin Electronic
- Heyuan Intelligence Technology
- Xiamen Top-iot Technology
- Xiangwei Measurement and Control Technology
- Wuhan Turbo Technologies
- Four-Faith
- Jinan USR IOT Technology
Notable Milestones in LoRa Wireless Data Terminal Sector
- 2019: Increased adoption of LoRaWAN in smart city pilots globally, showcasing its viability for municipal applications.
- 2020: Release of LoRaWAN 1.0.4 standard, bringing enhancements to security and device management.
- 2021: Significant growth in industrial IoT deployments leveraging LoRa for remote asset monitoring and control.
- 2022: Emergence of more ruggedized and industrial-grade LoRa Wireless Data Terminals designed for extreme environments.
- 2023: Increased investment in LoRa chip development, leading to smaller, more power-efficient, and cost-effective modules.
- 2024: Growing trend of LoRa integration with edge computing capabilities for localized data processing.
In-Depth LoRa Wireless Data Terminal Market Outlook
The LoRa Wireless Data Terminal market is set for substantial expansion, propelled by its inherent advantages in cost, range, and power efficiency, making it a cornerstone for the burgeoning Internet of Things ecosystem. The increasing demand for intelligent applications in industrial automation, smart utilities, and environmental monitoring will continue to fuel market penetration. Strategic collaborations and ongoing technological advancements, particularly in enhancing data handling capabilities and network security, will further solidify LoRa's position. As emerging economies increasingly adopt IoT solutions for infrastructure development and efficiency gains, the global reach and impact of LoRa Wireless Data Terminals are expected to grow exponentially, presenting significant strategic opportunities for stakeholders across the value chain.
LoRa Wireless Data Terminal Segmentation
-
1. Application
- 1.1. Remote Meter Reading
- 1.2. Industrial Data Collection
- 1.3. Wireless Data Communication
- 1.4. Others
-
2. Types
- 2.1. Transmission Distance Below 6000m
- 2.2. Transmission Distance 6000-8000m
- 2.3. Transmission Distance Above 8000m
LoRa Wireless Data Terminal Segmentation By Geography
-
1. North America
- 1.1. United States
- 1.2. Canada
- 1.3. Mexico
-
2. South America
- 2.1. Brazil
- 2.2. Argentina
- 2.3. Rest of South America
-
3. Europe
- 3.1. United Kingdom
- 3.2. Germany
- 3.3. France
- 3.4. Italy
- 3.5. Spain
- 3.6. Russia
- 3.7. Benelux
- 3.8. Nordics
- 3.9. Rest of Europe
-
4. Middle East & Africa
- 4.1. Turkey
- 4.2. Israel
- 4.3. GCC
- 4.4. North Africa
- 4.5. South Africa
- 4.6. Rest of Middle East & Africa
-
5. Asia Pacific
- 5.1. China
- 5.2. India
- 5.3. Japan
- 5.4. South Korea
- 5.5. ASEAN
- 5.6. Oceania
- 5.7. Rest of Asia Pacific
LoRa Wireless Data Terminal Regional Market Share
Geographic Coverage of LoRa Wireless Data Terminal
LoRa Wireless Data Terminal REPORT HIGHLIGHTS
| Aspects | Details |
|---|---|
| Study Period | 2020-2034 |
| Base Year | 2025 |
| Estimated Year | 2026 |
| Forecast Period | 2026-2034 |
| Historical Period | 2020-2025 |
| Growth Rate | CAGR of 6.1% from 2020-2034 |
| Segmentation |
|
Table of Contents
- 1. Introduction
- 1.1. Research Scope
- 1.2. Market Segmentation
- 1.3. Research Methodology
- 1.4. Definitions and Assumptions
- 2. Executive Summary
- 2.1. Introduction
- 3. Market Dynamics
- 3.1. Introduction
- 3.2. Market Drivers
- 3.3. Market Restrains
- 3.4. Market Trends
- 4. Market Factor Analysis
- 4.1. Porters Five Forces
- 4.2. Supply/Value Chain
- 4.3. PESTEL analysis
- 4.4. Market Entropy
- 4.5. Patent/Trademark Analysis
- 5. Global LoRa Wireless Data Terminal Analysis, Insights and Forecast, 2020-2032
- 5.1. Market Analysis, Insights and Forecast - by Application
- 5.1.1. Remote Meter Reading
- 5.1.2. Industrial Data Collection
- 5.1.3. Wireless Data Communication
- 5.1.4. Others
- 5.2. Market Analysis, Insights and Forecast - by Types
- 5.2.1. Transmission Distance Below 6000m
- 5.2.2. Transmission Distance 6000-8000m
- 5.2.3. Transmission Distance Above 8000m
- 5.3. Market Analysis, Insights and Forecast - by Region
- 5.3.1. North America
- 5.3.2. South America
- 5.3.3. Europe
- 5.3.4. Middle East & Africa
- 5.3.5. Asia Pacific
- 5.1. Market Analysis, Insights and Forecast - by Application
- 6. North America LoRa Wireless Data Terminal Analysis, Insights and Forecast, 2020-2032
- 6.1. Market Analysis, Insights and Forecast - by Application
- 6.1.1. Remote Meter Reading
- 6.1.2. Industrial Data Collection
- 6.1.3. Wireless Data Communication
- 6.1.4. Others
- 6.2. Market Analysis, Insights and Forecast - by Types
- 6.2.1. Transmission Distance Below 6000m
- 6.2.2. Transmission Distance 6000-8000m
- 6.2.3. Transmission Distance Above 8000m
- 6.1. Market Analysis, Insights and Forecast - by Application
- 7. South America LoRa Wireless Data Terminal Analysis, Insights and Forecast, 2020-2032
- 7.1. Market Analysis, Insights and Forecast - by Application
- 7.1.1. Remote Meter Reading
- 7.1.2. Industrial Data Collection
- 7.1.3. Wireless Data Communication
- 7.1.4. Others
- 7.2. Market Analysis, Insights and Forecast - by Types
- 7.2.1. Transmission Distance Below 6000m
- 7.2.2. Transmission Distance 6000-8000m
- 7.2.3. Transmission Distance Above 8000m
- 7.1. Market Analysis, Insights and Forecast - by Application
- 8. Europe LoRa Wireless Data Terminal Analysis, Insights and Forecast, 2020-2032
- 8.1. Market Analysis, Insights and Forecast - by Application
- 8.1.1. Remote Meter Reading
- 8.1.2. Industrial Data Collection
- 8.1.3. Wireless Data Communication
- 8.1.4. Others
- 8.2. Market Analysis, Insights and Forecast - by Types
- 8.2.1. Transmission Distance Below 6000m
- 8.2.2. Transmission Distance 6000-8000m
- 8.2.3. Transmission Distance Above 8000m
- 8.1. Market Analysis, Insights and Forecast - by Application
- 9. Middle East & Africa LoRa Wireless Data Terminal Analysis, Insights and Forecast, 2020-2032
- 9.1. Market Analysis, Insights and Forecast - by Application
- 9.1.1. Remote Meter Reading
- 9.1.2. Industrial Data Collection
- 9.1.3. Wireless Data Communication
- 9.1.4. Others
- 9.2. Market Analysis, Insights and Forecast - by Types
- 9.2.1. Transmission Distance Below 6000m
- 9.2.2. Transmission Distance 6000-8000m
- 9.2.3. Transmission Distance Above 8000m
- 9.1. Market Analysis, Insights and Forecast - by Application
- 10. Asia Pacific LoRa Wireless Data Terminal Analysis, Insights and Forecast, 2020-2032
- 10.1. Market Analysis, Insights and Forecast - by Application
- 10.1.1. Remote Meter Reading
- 10.1.2. Industrial Data Collection
- 10.1.3. Wireless Data Communication
- 10.1.4. Others
- 10.2. Market Analysis, Insights and Forecast - by Types
- 10.2.1. Transmission Distance Below 6000m
- 10.2.2. Transmission Distance 6000-8000m
- 10.2.3. Transmission Distance Above 8000m
- 10.1. Market Analysis, Insights and Forecast - by Application
- 11. Competitive Analysis
- 11.1. Global Market Share Analysis 2025
- 11.2. Company Profiles
- 11.2.1 Bausch Datacom
- 11.2.1.1. Overview
- 11.2.1.2. Products
- 11.2.1.3. SWOT Analysis
- 11.2.1.4. Recent Developments
- 11.2.1.5. Financials (Based on Availability)
- 11.2.2 Circuit Design
- 11.2.2.1. Overview
- 11.2.2.2. Products
- 11.2.2.3. SWOT Analysis
- 11.2.2.4. Recent Developments
- 11.2.2.5. Financials (Based on Availability)
- 11.2.3 Inc.
- 11.2.3.1. Overview
- 11.2.3.2. Products
- 11.2.3.3. SWOT Analysis
- 11.2.3.4. Recent Developments
- 11.2.3.5. Financials (Based on Availability)
- 11.2.4 Ruixin Electronic
- 11.2.4.1. Overview
- 11.2.4.2. Products
- 11.2.4.3. SWOT Analysis
- 11.2.4.4. Recent Developments
- 11.2.4.5. Financials (Based on Availability)
- 11.2.5 Heyuan Intelligence Technology
- 11.2.5.1. Overview
- 11.2.5.2. Products
- 11.2.5.3. SWOT Analysis
- 11.2.5.4. Recent Developments
- 11.2.5.5. Financials (Based on Availability)
- 11.2.6 Xiamen Top-iot Technology
- 11.2.6.1. Overview
- 11.2.6.2. Products
- 11.2.6.3. SWOT Analysis
- 11.2.6.4. Recent Developments
- 11.2.6.5. Financials (Based on Availability)
- 11.2.7 Xiangwei Measurement and Control Technology
- 11.2.7.1. Overview
- 11.2.7.2. Products
- 11.2.7.3. SWOT Analysis
- 11.2.7.4. Recent Developments
- 11.2.7.5. Financials (Based on Availability)
- 11.2.8 Wuhan Turbo Technologies
- 11.2.8.1. Overview
- 11.2.8.2. Products
- 11.2.8.3. SWOT Analysis
- 11.2.8.4. Recent Developments
- 11.2.8.5. Financials (Based on Availability)
- 11.2.9 Four-Faith
- 11.2.9.1. Overview
- 11.2.9.2. Products
- 11.2.9.3. SWOT Analysis
- 11.2.9.4. Recent Developments
- 11.2.9.5. Financials (Based on Availability)
- 11.2.10 Jinan USR IOT Technology
- 11.2.10.1. Overview
- 11.2.10.2. Products
- 11.2.10.3. SWOT Analysis
- 11.2.10.4. Recent Developments
- 11.2.10.5. Financials (Based on Availability)
- 11.2.1 Bausch Datacom
List of Figures
- Figure 1: Global LoRa Wireless Data Terminal Revenue Breakdown (undefined, %) by Region 2025 & 2033
- Figure 2: North America LoRa Wireless Data Terminal Revenue (undefined), by Application 2025 & 2033
- Figure 3: North America LoRa Wireless Data Terminal Revenue Share (%), by Application 2025 & 2033
- Figure 4: North America LoRa Wireless Data Terminal Revenue (undefined), by Types 2025 & 2033
- Figure 5: North America LoRa Wireless Data Terminal Revenue Share (%), by Types 2025 & 2033
- Figure 6: North America LoRa Wireless Data Terminal Revenue (undefined), by Country 2025 & 2033
- Figure 7: North America LoRa Wireless Data Terminal Revenue Share (%), by Country 2025 & 2033
- Figure 8: South America LoRa Wireless Data Terminal Revenue (undefined), by Application 2025 & 2033
- Figure 9: South America LoRa Wireless Data Terminal Revenue Share (%), by Application 2025 & 2033
- Figure 10: South America LoRa Wireless Data Terminal Revenue (undefined), by Types 2025 & 2033
- Figure 11: South America LoRa Wireless Data Terminal Revenue Share (%), by Types 2025 & 2033
- Figure 12: South America LoRa Wireless Data Terminal Revenue (undefined), by Country 2025 & 2033
- Figure 13: South America LoRa Wireless Data Terminal Revenue Share (%), by Country 2025 & 2033
- Figure 14: Europe LoRa Wireless Data Terminal Revenue (undefined), by Application 2025 & 2033
- Figure 15: Europe LoRa Wireless Data Terminal Revenue Share (%), by Application 2025 & 2033
- Figure 16: Europe LoRa Wireless Data Terminal Revenue (undefined), by Types 2025 & 2033
- Figure 17: Europe LoRa Wireless Data Terminal Revenue Share (%), by Types 2025 & 2033
- Figure 18: Europe LoRa Wireless Data Terminal Revenue (undefined), by Country 2025 & 2033
- Figure 19: Europe LoRa Wireless Data Terminal Revenue Share (%), by Country 2025 & 2033
- Figure 20: Middle East & Africa LoRa Wireless Data Terminal Revenue (undefined), by Application 2025 & 2033
- Figure 21: Middle East & Africa LoRa Wireless Data Terminal Revenue Share (%), by Application 2025 & 2033
- Figure 22: Middle East & Africa LoRa Wireless Data Terminal Revenue (undefined), by Types 2025 & 2033
- Figure 23: Middle East & Africa LoRa Wireless Data Terminal Revenue Share (%), by Types 2025 & 2033
- Figure 24: Middle East & Africa LoRa Wireless Data Terminal Revenue (undefined), by Country 2025 & 2033
- Figure 25: Middle East & Africa LoRa Wireless Data Terminal Revenue Share (%), by Country 2025 & 2033
- Figure 26: Asia Pacific LoRa Wireless Data Terminal Revenue (undefined), by Application 2025 & 2033
- Figure 27: Asia Pacific LoRa Wireless Data Terminal Revenue Share (%), by Application 2025 & 2033
- Figure 28: Asia Pacific LoRa Wireless Data Terminal Revenue (undefined), by Types 2025 & 2033
- Figure 29: Asia Pacific LoRa Wireless Data Terminal Revenue Share (%), by Types 2025 & 2033
- Figure 30: Asia Pacific LoRa Wireless Data Terminal Revenue (undefined), by Country 2025 & 2033
- Figure 31: Asia Pacific LoRa Wireless Data Terminal Revenue Share (%), by Country 2025 & 2033
List of Tables
- Table 1: Global LoRa Wireless Data Terminal Revenue undefined Forecast, by Application 2020 & 2033
- Table 2: Global LoRa Wireless Data Terminal Revenue undefined Forecast, by Types 2020 & 2033
- Table 3: Global LoRa Wireless Data Terminal Revenue undefined Forecast, by Region 2020 & 2033
- Table 4: Global LoRa Wireless Data Terminal Revenue undefined Forecast, by Application 2020 & 2033
- Table 5: Global LoRa Wireless Data Terminal Revenue undefined Forecast, by Types 2020 & 2033
- Table 6: Global LoRa Wireless Data Terminal Revenue undefined Forecast, by Country 2020 & 2033
- Table 7: United States LoRa Wireless Data Terminal Revenue (undefined) Forecast, by Application 2020 & 2033
- Table 8: Canada LoRa Wireless Data Terminal Revenue (undefined) Forecast, by Application 2020 & 2033
- Table 9: Mexico LoRa Wireless Data Terminal Revenue (undefined) Forecast, by Application 2020 & 2033
- Table 10: Global LoRa Wireless Data Terminal Revenue undefined Forecast, by Application 2020 & 2033
- Table 11: Global LoRa Wireless Data Terminal Revenue undefined Forecast, by Types 2020 & 2033
- Table 12: Global LoRa Wireless Data Terminal Revenue undefined Forecast, by Country 2020 & 2033
- Table 13: Brazil LoRa Wireless Data Terminal Revenue (undefined) Forecast, by Application 2020 & 2033
- Table 14: Argentina LoRa Wireless Data Terminal Revenue (undefined) Forecast, by Application 2020 & 2033
- Table 15: Rest of South America LoRa Wireless Data Terminal Revenue (undefined) Forecast, by Application 2020 & 2033
- Table 16: Global LoRa Wireless Data Terminal Revenue undefined Forecast, by Application 2020 & 2033
- Table 17: Global LoRa Wireless Data Terminal Revenue undefined Forecast, by Types 2020 & 2033
- Table 18: Global LoRa Wireless Data Terminal Revenue undefined Forecast, by Country 2020 & 2033
- Table 19: United Kingdom LoRa Wireless Data Terminal Revenue (undefined) Forecast, by Application 2020 & 2033
- Table 20: Germany LoRa Wireless Data Terminal Revenue (undefined) Forecast, by Application 2020 & 2033
- Table 21: France LoRa Wireless Data Terminal Revenue (undefined) Forecast, by Application 2020 & 2033
- Table 22: Italy LoRa Wireless Data Terminal Revenue (undefined) Forecast, by Application 2020 & 2033
- Table 23: Spain LoRa Wireless Data Terminal Revenue (undefined) Forecast, by Application 2020 & 2033
- Table 24: Russia LoRa Wireless Data Terminal Revenue (undefined) Forecast, by Application 2020 & 2033
- Table 25: Benelux LoRa Wireless Data Terminal Revenue (undefined) Forecast, by Application 2020 & 2033
- Table 26: Nordics LoRa Wireless Data Terminal Revenue (undefined) Forecast, by Application 2020 & 2033
- Table 27: Rest of Europe LoRa Wireless Data Terminal Revenue (undefined) Forecast, by Application 2020 & 2033
- Table 28: Global LoRa Wireless Data Terminal Revenue undefined Forecast, by Application 2020 & 2033
- Table 29: Global LoRa Wireless Data Terminal Revenue undefined Forecast, by Types 2020 & 2033
- Table 30: Global LoRa Wireless Data Terminal Revenue undefined Forecast, by Country 2020 & 2033
- Table 31: Turkey LoRa Wireless Data Terminal Revenue (undefined) Forecast, by Application 2020 & 2033
- Table 32: Israel LoRa Wireless Data Terminal Revenue (undefined) Forecast, by Application 2020 & 2033
- Table 33: GCC LoRa Wireless Data Terminal Revenue (undefined) Forecast, by Application 2020 & 2033
- Table 34: North Africa LoRa Wireless Data Terminal Revenue (undefined) Forecast, by Application 2020 & 2033
- Table 35: South Africa LoRa Wireless Data Terminal Revenue (undefined) Forecast, by Application 2020 & 2033
- Table 36: Rest of Middle East & Africa LoRa Wireless Data Terminal Revenue (undefined) Forecast, by Application 2020 & 2033
- Table 37: Global LoRa Wireless Data Terminal Revenue undefined Forecast, by Application 2020 & 2033
- Table 38: Global LoRa Wireless Data Terminal Revenue undefined Forecast, by Types 2020 & 2033
- Table 39: Global LoRa Wireless Data Terminal Revenue undefined Forecast, by Country 2020 & 2033
- Table 40: China LoRa Wireless Data Terminal Revenue (undefined) Forecast, by Application 2020 & 2033
- Table 41: India LoRa Wireless Data Terminal Revenue (undefined) Forecast, by Application 2020 & 2033
- Table 42: Japan LoRa Wireless Data Terminal Revenue (undefined) Forecast, by Application 2020 & 2033
- Table 43: South Korea LoRa Wireless Data Terminal Revenue (undefined) Forecast, by Application 2020 & 2033
- Table 44: ASEAN LoRa Wireless Data Terminal Revenue (undefined) Forecast, by Application 2020 & 2033
- Table 45: Oceania LoRa Wireless Data Terminal Revenue (undefined) Forecast, by Application 2020 & 2033
- Table 46: Rest of Asia Pacific LoRa Wireless Data Terminal Revenue (undefined) Forecast, by Application 2020 & 2033
Frequently Asked Questions
1. What is the projected Compound Annual Growth Rate (CAGR) of the LoRa Wireless Data Terminal?
The projected CAGR is approximately 6.1%.
2. Which companies are prominent players in the LoRa Wireless Data Terminal?
Key companies in the market include Bausch Datacom, Circuit Design, Inc., Ruixin Electronic, Heyuan Intelligence Technology, Xiamen Top-iot Technology, Xiangwei Measurement and Control Technology, Wuhan Turbo Technologies, Four-Faith, Jinan USR IOT Technology.
3. What are the main segments of the LoRa Wireless Data Terminal?
The market segments include Application, Types.
4. Can you provide details about the market size?
The market size is estimated to be USD XXX N/A as of 2022.
5. What are some drivers contributing to market growth?
N/A
6. What are the notable trends driving market growth?
N/A
7. Are there any restraints impacting market growth?
N/A
8. Can you provide examples of recent developments in the market?
N/A
9. What pricing options are available for accessing the report?
Pricing options include single-user, multi-user, and enterprise licenses priced at USD 4900.00, USD 7350.00, and USD 9800.00 respectively.
10. Is the market size provided in terms of value or volume?
The market size is provided in terms of value, measured in N/A.
11. Are there any specific market keywords associated with the report?
Yes, the market keyword associated with the report is "LoRa Wireless Data Terminal," which aids in identifying and referencing the specific market segment covered.
12. How do I determine which pricing option suits my needs best?
The pricing options vary based on user requirements and access needs. Individual users may opt for single-user licenses, while businesses requiring broader access may choose multi-user or enterprise licenses for cost-effective access to the report.
13. Are there any additional resources or data provided in the LoRa Wireless Data Terminal report?
While the report offers comprehensive insights, it's advisable to review the specific contents or supplementary materials provided to ascertain if additional resources or data are available.
14. How can I stay updated on further developments or reports in the LoRa Wireless Data Terminal?
To stay informed about further developments, trends, and reports in the LoRa Wireless Data Terminal, consider subscribing to industry newsletters, following relevant companies and organizations, or regularly checking reputable industry news sources and publications.
Methodology
Step 1 - Identification of Relevant Samples Size from Population Database


Step 2 - Approaches for Defining Global Market Size (Value, Volume* & Price*)

Note*: In applicable scenarios
Step 3 - Data Sources
Primary Research
- Web Analytics
- Survey Reports
- Research Institute
- Latest Research Reports
- Opinion Leaders
Secondary Research
- Annual Reports
- White Paper
- Latest Press Release
- Industry Association
- Paid Database
- Investor Presentations

Step 4 - Data Triangulation
Involves using different sources of information in order to increase the validity of a study
These sources are likely to be stakeholders in a program - participants, other researchers, program staff, other community members, and so on.
Then we put all data in single framework & apply various statistical tools to find out the dynamic on the market.
During the analysis stage, feedback from the stakeholder groups would be compared to determine areas of agreement as well as areas of divergence