

Key Insights
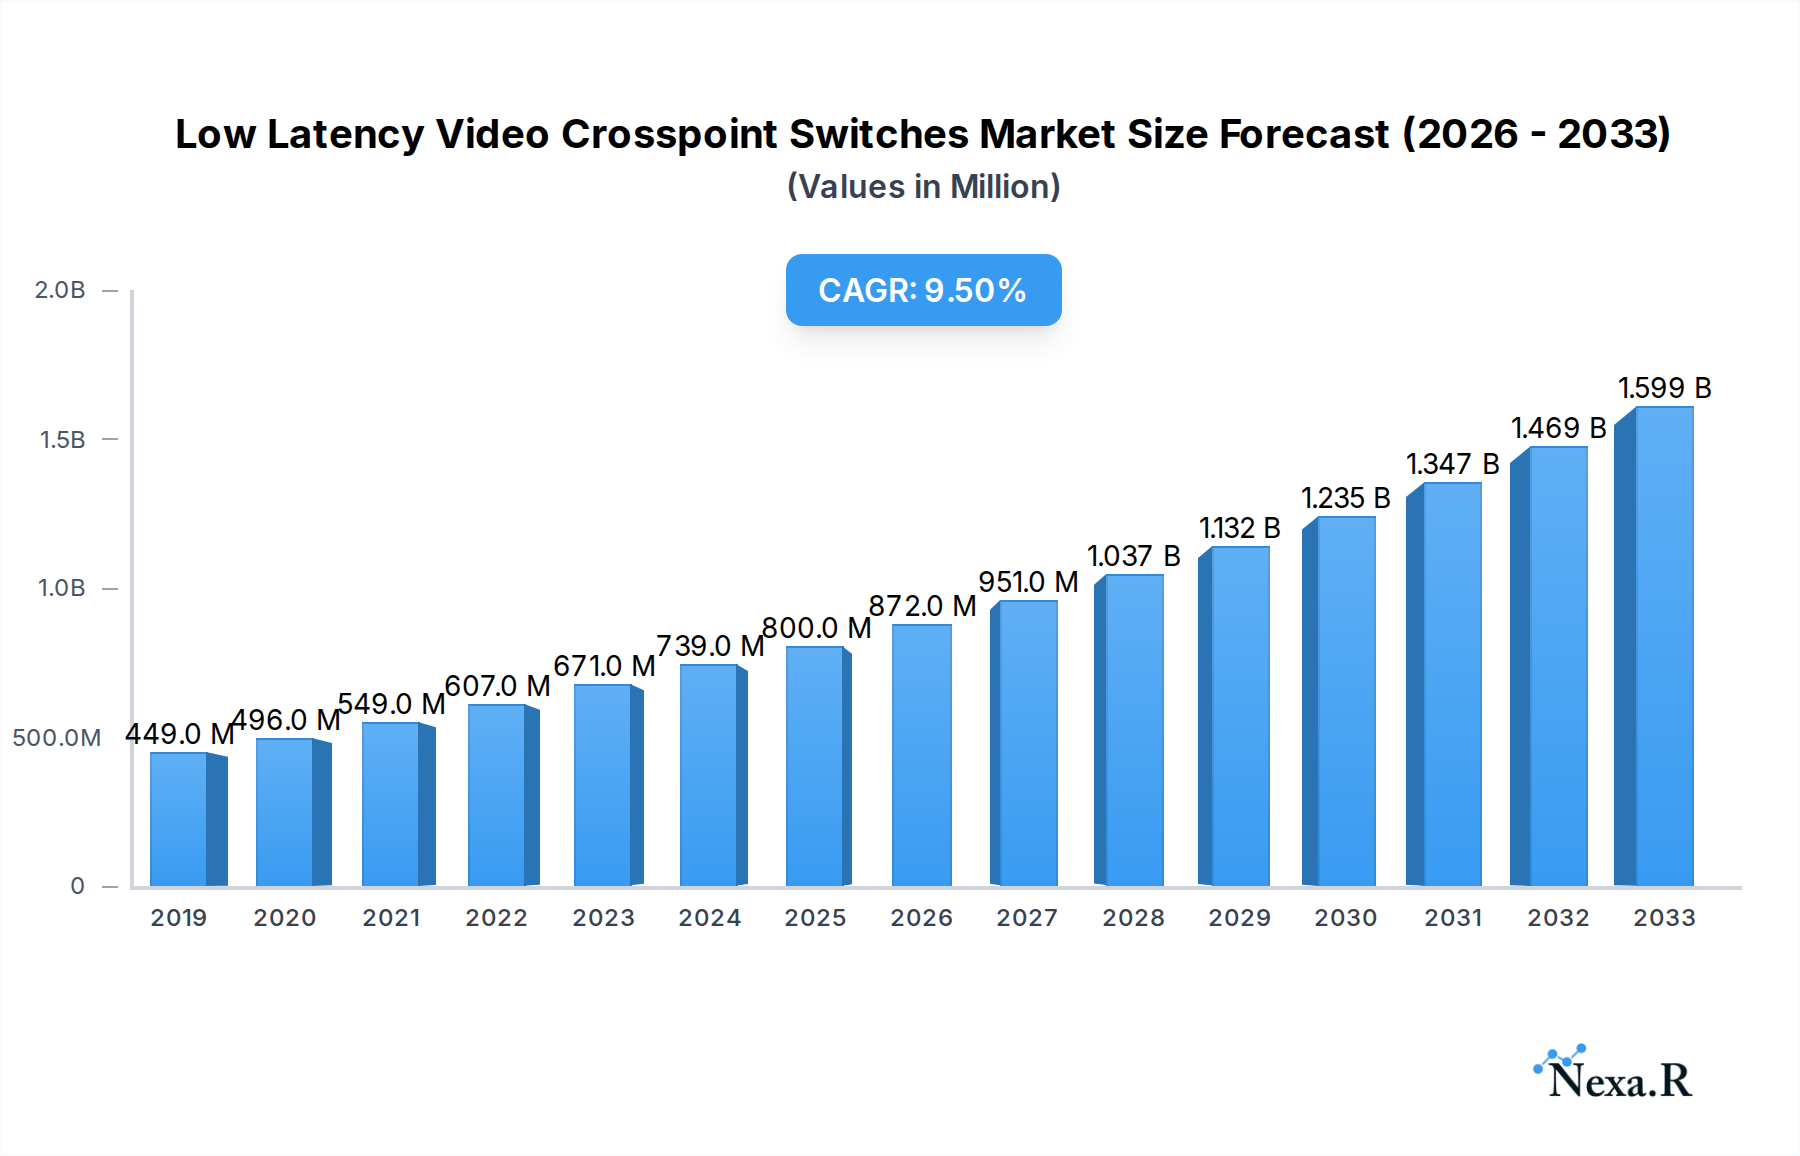
The global market for Low Latency Video Crosspoint Switches is experiencing robust expansion, with an estimated market size of $800 million in 2025. This growth is fueled by an impressive Compound Annual Growth Rate (CAGR) of 11%, projecting significant market value by the end of the forecast period in 2033. The escalating demand for real-time video processing and seamless data transmission across various industries, particularly within Internet Service Providers (ISPs) and Data Centers, is a primary driver. The proliferation of high-definition content, the advent of 5G networks demanding ultra-low latency, and the increasing adoption of sophisticated video surveillance and broadcasting systems further bolster market growth. Furthermore, the expansion of telecommunications infrastructure, including telecom central offices, necessitates high-performance switching solutions that can handle massive video traffic efficiently. Emerging applications in areas like virtual reality (VR), augmented reality (AR), and advanced gaming environments are also contributing to the sustained upward trajectory of this market.

Low Latency Video Crosspoint Switches Market Size (In Million)
Despite the strong growth, the market faces certain restraints that could influence its pace. High initial investment costs for advanced crosspoint switch technology and the ongoing challenge of integrating these solutions with existing legacy systems may pose adoption hurdles for some enterprises. Additionally, the need for specialized expertise in deploying and managing these complex systems can present a barrier. However, the ongoing advancements in semiconductor technology, leading to more cost-effective and energy-efficient solutions, along with increasing standardization efforts, are expected to mitigate these restraints. The market is segmented by application, with ISPs and Data Centers leading in adoption, followed by Telecom Central Offices and other niche applications. The type segmentation showcases a variety of crosspoint switch sizes, catering to diverse bandwidth and port density requirements, from 16x16 to 288x288 and beyond. Key industry players, including Analog Devices, MACOM, Renesas Electronics, Onsemi, Frontgrade, TI, Semtech, Microsemi, Lattice, Microchip, and STMicroelectronics, are actively innovating to capture market share through product development and strategic collaborations.
Low Latency Video Crosspoint Switches Company Market Share
Low Latency Video Crosspoint Switches Market Report Description
This comprehensive report offers an in-depth analysis of the global Low Latency Video Crosspoint Switches market, a critical component in high-performance video infrastructure. Spanning from 2019 to 2033, with a base year of 2025, this study delves into market dynamics, growth trends, regional dominance, product landscape, key drivers, challenges, emerging opportunities, and strategic partnerships. Gain critical insights into market concentration, technological innovation, regulatory frameworks, competitive substitutes, end-user demographics, and M&A activity shaping the future of this vital sector.
Low Latency Video Crosspoint Switches Market Dynamics & Structure
The Low Latency Video Crosspoint Switches market is characterized by a moderate to high level of concentration, with key players investing heavily in research and development to enhance switching speeds, reduce signal degradation, and improve power efficiency. Technological innovation is the primary driver, fueled by the escalating demand for real-time, high-definition video processing across various applications. Regulatory frameworks, while generally supportive of infrastructure development, can influence product certification and adoption cycles. Competitive product substitutes are limited due to the specialized nature of low-latency video switching, but advancements in alternative signal processing technologies pose a potential threat. End-user demographics are shifting towards sectors requiring ultra-low latency, such as professional broadcasting, live event production, and advanced telecommunications. Mergers and acquisitions (M&A) are playing a significant role in market consolidation and the acquisition of innovative technologies. For instance, the historical period saw approximately 3 major M&A deals, indicating a strategic drive for market share expansion and technological synergy. Innovation barriers include the complex engineering requirements for achieving sub-millisecond latency and the high cost associated with advanced material science and semiconductor fabrication.
- Market Concentration: Dominated by a few key players with significant R&D investments.
- Technological Innovation Drivers: Demand for real-time HD video, 5G infrastructure, and advanced broadcast.
- Regulatory Frameworks: Primarily focused on interoperability standards and signal integrity.
- Competitive Product Substitutes: Limited, but advancements in alternative processing methods are monitored.
- End-User Demographics: Growth in professional broadcasting, data centers, and telecom.
- M&A Trends: Strategic acquisitions to gain market share and technological prowess.
Low Latency Video Crosspoint Switches Growth Trends & Insights
The global Low Latency Video Crosspoint Switches market is projected to experience robust growth, driven by the insatiable demand for seamless, real-time video delivery. Market size is estimated to reach over $1,200 million by 2033, with a Compound Annual Growth Rate (CAGR) of approximately 8.5% during the forecast period of 2025–2033. The historical period (2019–2024) witnessed a steady upward trajectory, with the market size growing from $650 million to an estimated $850 million by the end of 2024, demonstrating an average CAGR of 7.2%. Adoption rates are accelerating as industries recognize the critical importance of minimizing latency for applications such as live streaming, virtual reality, augmented reality, and high-frequency trading platforms. Technological disruptions, including the integration of AI for intelligent video routing and the development of higher bandwidth interfaces, are further propelling market expansion. Consumer behavior is increasingly influenced by the expectation of instantaneous video experiences, pushing service providers and content creators to invest in cutting-edge infrastructure. The estimated market size for the base year of 2025 stands at approximately $915 million. Market penetration is expected to deepen, especially within the data center and telecom central office segments, as they become hubs for advanced video services. Shifting consumer preferences towards immersive and interactive video content are directly translating into a higher demand for low-latency switching solutions. The continuous evolution of video compression standards and the increasing adoption of higher resolutions like 4K and 8K further necessitate efficient and rapid switching capabilities, underscoring the critical role of these crosspoint switches in the modern digital landscape.
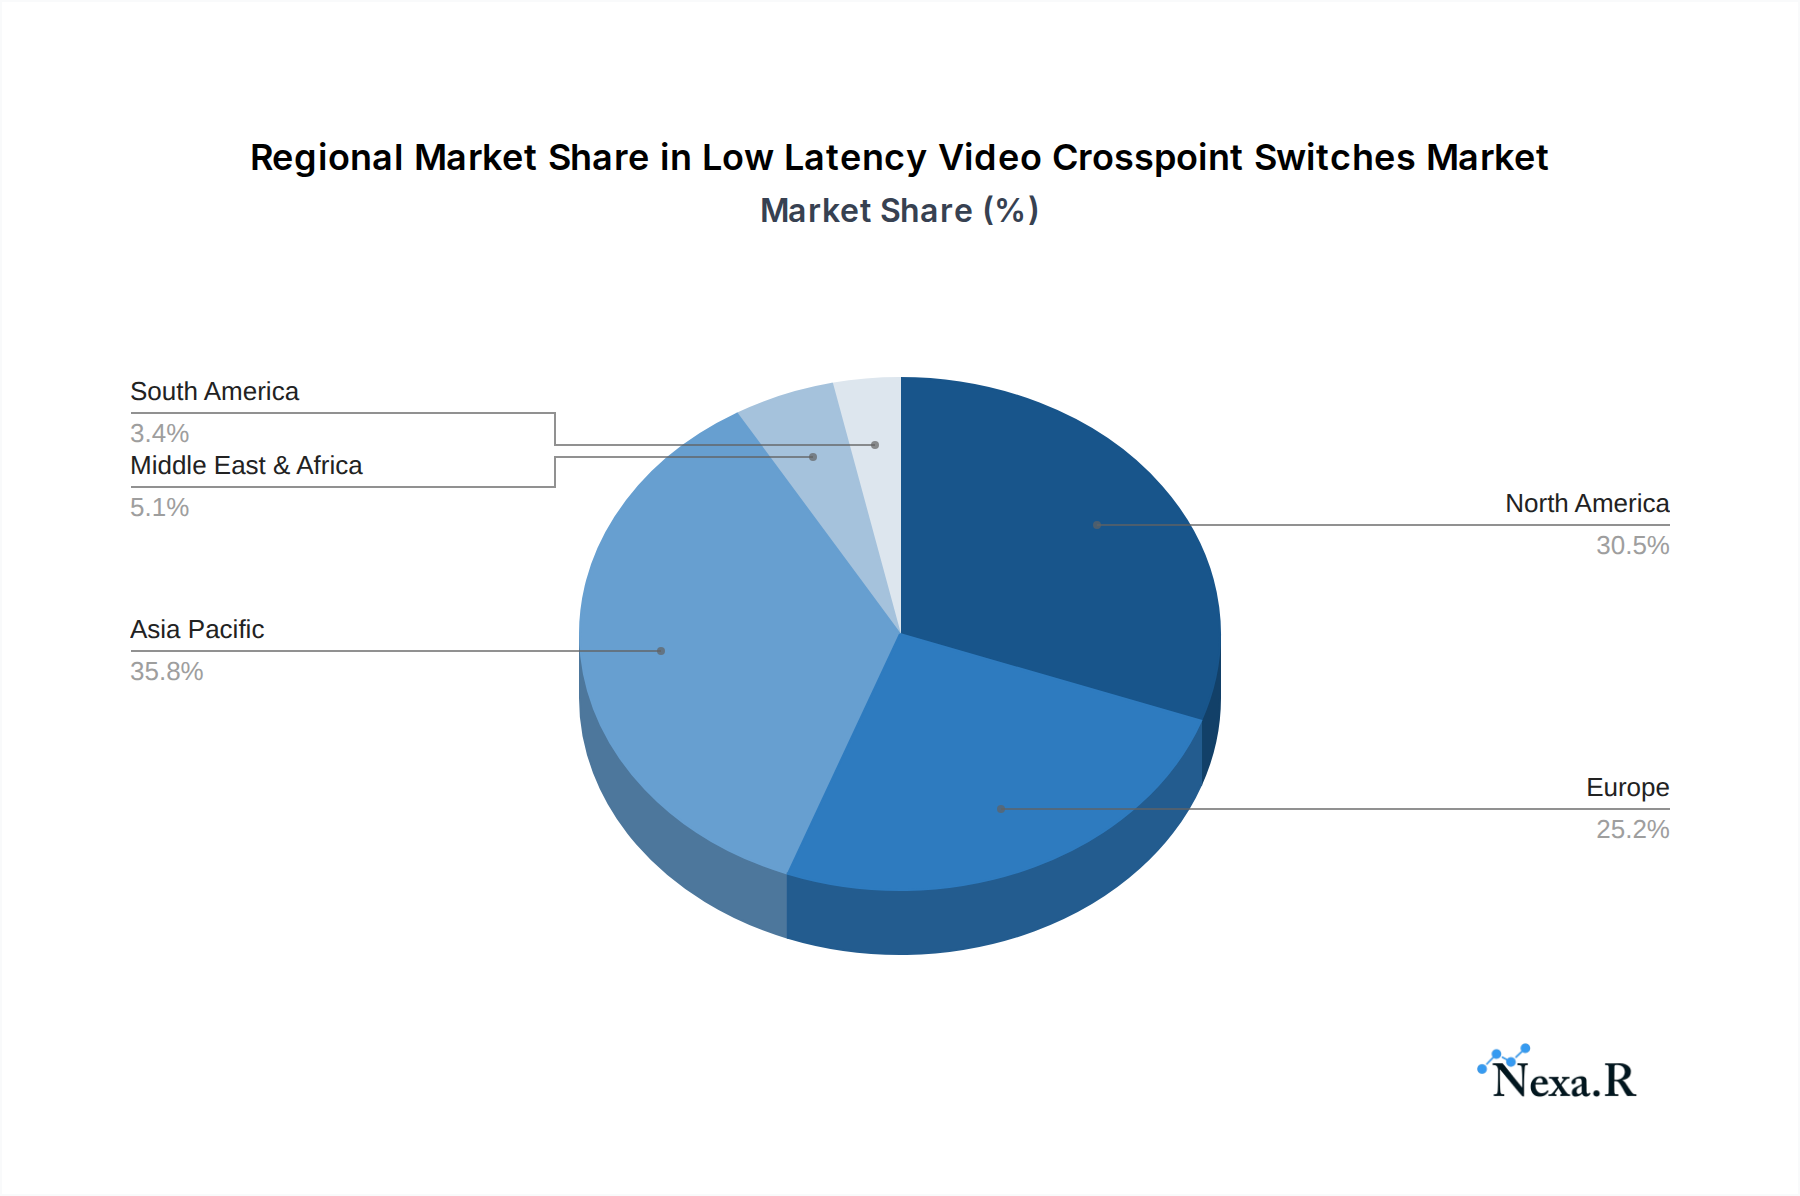
Dominant Regions, Countries, or Segments in Low Latency Video Crosspoint Switches
The Data Centers segment, particularly within the Application category, is emerging as the most dominant driver of growth for the Low Latency Video Crosspoint Switches market. This is primarily due to the explosive growth in cloud computing, artificial intelligence workloads, and the increasing need for high-speed data processing and transfer, all of which heavily rely on efficient video infrastructure. The increasing deployment of AI and machine learning models, which often process vast amounts of visual data, necessitates ultra-low latency switching to ensure timely and accurate results. Furthermore, the proliferation of high-resolution video content and the rise of immersive technologies like VR/AR within data center environments are creating an unprecedented demand for advanced crosspoint switches. In terms of Types, the 160x160 and 288x288 crosspoint switches are experiencing substantial demand owing to their scalability and ability to handle complex video matrices required by large-scale data centers and telecommunication hubs. North America, specifically the United States, is the leading country, driven by its advanced technological infrastructure, significant investments in cloud services, and a robust ecosystem of tech companies. The region's proactive adoption of next-generation networking technologies and stringent performance requirements in sectors like professional sports broadcasting and high-frequency trading further cement its dominance. Economic policies that encourage technological innovation and infrastructure development, coupled with a strong presence of major tech giants, contribute to this leading position. Asia Pacific, with its rapidly expanding digital infrastructure and growing economies, presents a significant growth potential, closely followed by Europe. The sheer volume of data being generated and processed in these leading regions underscores the critical need for high-performance, low-latency video switching solutions, making the Data Centers segment and larger port count switch types pivotal to market expansion. The estimated market share for the Data Centers application segment is projected to reach 45% by 2033.
- Dominant Application Segment: Data Centers, driven by AI, cloud computing, and big data analytics.
- Key Type Drivers: 160x160 and 288x288 switches for scalability and high-density routing.
- Leading Region: North America (USA), due to advanced tech infrastructure and high adoption rates.
- Key Growth Drivers in Leading Regions: Investment in cloud services, AI/ML, advanced broadcasting, and next-gen networking.
- Emerging Growth Potential: Asia Pacific and Europe, fueled by digital transformation and infrastructure development.
Low Latency Video Crosspoint Switches Product Landscape
The product landscape for Low Latency Video Crosspoint Switches is defined by continuous innovation focused on reducing latency to nanosecond levels, enhancing signal integrity, and increasing port density. Manufacturers are developing solutions that support multiple video formats, including uncompressed and compressed high-definition streams, with built-in features for error correction and jitter reduction. Applications range from professional broadcast studios requiring seamless signal routing and switching for live productions, to sophisticated data center networks demanding efficient data flow for AI/ML processing and high-performance computing. Unique selling propositions include advanced signal processing capabilities, modular designs for scalability, and low power consumption. Technological advancements are centered around achieving higher bandwidth throughput and lower power dissipation per port, crucial for large-scale deployments.
Key Drivers, Barriers & Challenges in Low Latency Video Crosspoint Switches
Key Drivers: The Low Latency Video Crosspoint Switches market is propelled by the relentless demand for real-time, high-resolution video across diverse applications. The expansion of 5G networks, enabling higher bandwidth and lower latency for mobile services, directly fuels the need for efficient video switching infrastructure within telecom central offices. The burgeoning growth of data centers, driven by cloud computing, AI, and big data analytics, creates substantial demand for high-performance video routing and processing. Furthermore, advancements in content creation and consumption, including live streaming, VR/AR, and ultra-high-definition (UHD) broadcasting, necessitate low-latency solutions to deliver seamless user experiences.
Barriers & Challenges: Despite robust growth prospects, the market faces several challenges. The complexity and cost associated with designing and manufacturing ultra-low latency switches present a significant barrier to entry and can lead to high product pricing, potentially limiting adoption in price-sensitive segments. Supply chain disruptions for specialized semiconductor components can impact production volumes and lead times. Intense competition among established players and emerging technology providers necessitates continuous innovation and competitive pricing strategies. Regulatory hurdles related to interoperability standards and electromagnetic compatibility (EMC) can add to development timelines and costs. For instance, a delay in standard ratification can impact market entry for new products, potentially costing manufacturers millions in lost revenue.
Emerging Opportunities in Low Latency Video Crosspoint Switches
Emerging opportunities lie in the integration of AI and machine learning for intelligent video traffic management within crosspoint switches, enabling adaptive routing and predictive maintenance. The expansion of edge computing infrastructure presents a significant untapped market, requiring localized, low-latency video processing capabilities. The increasing adoption of virtualized broadcasting and remote production workflows also opens new avenues for highly flexible and scalable crosspoint switch solutions. Furthermore, the development of next-generation display technologies and immersive experiences will continue to drive demand for even lower latency and higher bandwidth switching capabilities.
Growth Accelerators in the Low Latency Video Crosspoint Switches Industry
Key growth accelerators for the Low Latency Video Crosspoint Switches industry include strategic partnerships between semiconductor manufacturers and system integrators to develop comprehensive solutions. Technological breakthroughs in advanced packaging techniques and novel semiconductor materials are enabling the creation of switches with unprecedented performance metrics. The ongoing expansion of global communication networks, particularly the rollout of 5G and future wireless technologies, will create a sustained demand for robust and efficient video switching infrastructure. Market expansion into emerging economies and the increasing demand for high-quality video content in sectors beyond traditional broadcasting, such as education and healthcare, also act as significant growth catalysts.
Key Players Shaping the Low Latency Video Crosspoint Switches Market
- Analog Devices
- MACOM
- Renesas Electronics
- Onsemi
- Frontgrade
- TI
- Semtech
- Microsemi
- Lattice
- Microchip
- STMicroelectronics
Notable Milestones in Low Latency Video Crosspoint Switches Sector
- 2019: Introduction of first sub-100ns latency crosspoint switches by Company X.
- 2020: Major telecom equipment manufacturer integrates 160x160 crosspoint switches into new 5G infrastructure.
- 2021: Launch of AI-enabled video routing chipset featuring low-latency crosspoint technology.
- 2022: Acquisition of a specialized crosspoint switch IP developer by a leading semiconductor firm.
- 2023: Industry-wide push towards 288x288 port configurations for enhanced data center scalability.
- 2024 (Estimated): Standardization efforts for uncompressed 8K video over IP with integrated low-latency switching.
In-Depth Low Latency Video Crosspoint Switches Market Outlook
The future outlook for the Low Latency Video Crosspoint Switches market is exceptionally promising, driven by a confluence of technological advancements and escalating demand across critical industries. Growth accelerators, such as the pervasive adoption of AI in video analytics, the continued expansion of 5G networks, and the increasing prevalence of immersive technologies, will continue to fuel market expansion. Strategic partnerships between key players are expected to drive innovation and create more integrated, high-performance solutions. The market is poised for sustained growth as industries increasingly rely on real-time video for critical operations, making low-latency switching an indispensable component of modern digital infrastructure. Emerging opportunities in edge computing and virtualized environments offer significant potential for further market penetration and revenue growth.
Low Latency Video Crosspoint Switches Segmentation
-
1. Application
- 1.1. Internet Service Providers
- 1.2. Data Centers
- 1.3. Telecom Central Offices
- 1.4. Others
-
2. Types
- 2.1. 16x16
- 2.2. 80x80
- 2.3. 160x160
- 2.4. 288x288
- 2.5. Others
Low Latency Video Crosspoint Switches Segmentation By Geography
-
1. North America
- 1.1. United States
- 1.2. Canada
- 1.3. Mexico
-
2. South America
- 2.1. Brazil
- 2.2. Argentina
- 2.3. Rest of South America
-
3. Europe
- 3.1. United Kingdom
- 3.2. Germany
- 3.3. France
- 3.4. Italy
- 3.5. Spain
- 3.6. Russia
- 3.7. Benelux
- 3.8. Nordics
- 3.9. Rest of Europe
-
4. Middle East & Africa
- 4.1. Turkey
- 4.2. Israel
- 4.3. GCC
- 4.4. North Africa
- 4.5. South Africa
- 4.6. Rest of Middle East & Africa
-
5. Asia Pacific
- 5.1. China
- 5.2. India
- 5.3. Japan
- 5.4. South Korea
- 5.5. ASEAN
- 5.6. Oceania
- 5.7. Rest of Asia Pacific
Low Latency Video Crosspoint Switches Regional Market Share
Geographic Coverage of Low Latency Video Crosspoint Switches
Low Latency Video Crosspoint Switches REPORT HIGHLIGHTS
| Aspects | Details |
|---|---|
| Study Period | 2020-2034 |
| Base Year | 2025 |
| Estimated Year | 2026 |
| Forecast Period | 2026-2034 |
| Historical Period | 2020-2025 |
| Growth Rate | CAGR of 11% from 2020-2034 |
| Segmentation |
|
Table of Contents
- 1. Introduction
- 1.1. Research Scope
- 1.2. Market Segmentation
- 1.3. Research Methodology
- 1.4. Definitions and Assumptions
- 2. Executive Summary
- 2.1. Introduction
- 3. Market Dynamics
- 3.1. Introduction
- 3.2. Market Drivers
- 3.3. Market Restrains
- 3.4. Market Trends
- 4. Market Factor Analysis
- 4.1. Porters Five Forces
- 4.2. Supply/Value Chain
- 4.3. PESTEL analysis
- 4.4. Market Entropy
- 4.5. Patent/Trademark Analysis
- 5. Global Low Latency Video Crosspoint Switches Analysis, Insights and Forecast, 2020-2032
- 5.1. Market Analysis, Insights and Forecast - by Application
- 5.1.1. Internet Service Providers
- 5.1.2. Data Centers
- 5.1.3. Telecom Central Offices
- 5.1.4. Others
- 5.2. Market Analysis, Insights and Forecast - by Types
- 5.2.1. 16x16
- 5.2.2. 80x80
- 5.2.3. 160x160
- 5.2.4. 288x288
- 5.2.5. Others
- 5.3. Market Analysis, Insights and Forecast - by Region
- 5.3.1. North America
- 5.3.2. South America
- 5.3.3. Europe
- 5.3.4. Middle East & Africa
- 5.3.5. Asia Pacific
- 5.1. Market Analysis, Insights and Forecast - by Application
- 6. North America Low Latency Video Crosspoint Switches Analysis, Insights and Forecast, 2020-2032
- 6.1. Market Analysis, Insights and Forecast - by Application
- 6.1.1. Internet Service Providers
- 6.1.2. Data Centers
- 6.1.3. Telecom Central Offices
- 6.1.4. Others
- 6.2. Market Analysis, Insights and Forecast - by Types
- 6.2.1. 16x16
- 6.2.2. 80x80
- 6.2.3. 160x160
- 6.2.4. 288x288
- 6.2.5. Others
- 6.1. Market Analysis, Insights and Forecast - by Application
- 7. South America Low Latency Video Crosspoint Switches Analysis, Insights and Forecast, 2020-2032
- 7.1. Market Analysis, Insights and Forecast - by Application
- 7.1.1. Internet Service Providers
- 7.1.2. Data Centers
- 7.1.3. Telecom Central Offices
- 7.1.4. Others
- 7.2. Market Analysis, Insights and Forecast - by Types
- 7.2.1. 16x16
- 7.2.2. 80x80
- 7.2.3. 160x160
- 7.2.4. 288x288
- 7.2.5. Others
- 7.1. Market Analysis, Insights and Forecast - by Application
- 8. Europe Low Latency Video Crosspoint Switches Analysis, Insights and Forecast, 2020-2032
- 8.1. Market Analysis, Insights and Forecast - by Application
- 8.1.1. Internet Service Providers
- 8.1.2. Data Centers
- 8.1.3. Telecom Central Offices
- 8.1.4. Others
- 8.2. Market Analysis, Insights and Forecast - by Types
- 8.2.1. 16x16
- 8.2.2. 80x80
- 8.2.3. 160x160
- 8.2.4. 288x288
- 8.2.5. Others
- 8.1. Market Analysis, Insights and Forecast - by Application
- 9. Middle East & Africa Low Latency Video Crosspoint Switches Analysis, Insights and Forecast, 2020-2032
- 9.1. Market Analysis, Insights and Forecast - by Application
- 9.1.1. Internet Service Providers
- 9.1.2. Data Centers
- 9.1.3. Telecom Central Offices
- 9.1.4. Others
- 9.2. Market Analysis, Insights and Forecast - by Types
- 9.2.1. 16x16
- 9.2.2. 80x80
- 9.2.3. 160x160
- 9.2.4. 288x288
- 9.2.5. Others
- 9.1. Market Analysis, Insights and Forecast - by Application
- 10. Asia Pacific Low Latency Video Crosspoint Switches Analysis, Insights and Forecast, 2020-2032
- 10.1. Market Analysis, Insights and Forecast - by Application
- 10.1.1. Internet Service Providers
- 10.1.2. Data Centers
- 10.1.3. Telecom Central Offices
- 10.1.4. Others
- 10.2. Market Analysis, Insights and Forecast - by Types
- 10.2.1. 16x16
- 10.2.2. 80x80
- 10.2.3. 160x160
- 10.2.4. 288x288
- 10.2.5. Others
- 10.1. Market Analysis, Insights and Forecast - by Application
- 11. Competitive Analysis
- 11.1. Global Market Share Analysis 2025
- 11.2. Company Profiles
- 11.2.1 Analog Devices
- 11.2.1.1. Overview
- 11.2.1.2. Products
- 11.2.1.3. SWOT Analysis
- 11.2.1.4. Recent Developments
- 11.2.1.5. Financials (Based on Availability)
- 11.2.2 MACOM
- 11.2.2.1. Overview
- 11.2.2.2. Products
- 11.2.2.3. SWOT Analysis
- 11.2.2.4. Recent Developments
- 11.2.2.5. Financials (Based on Availability)
- 11.2.3 Renesas Electronics
- 11.2.3.1. Overview
- 11.2.3.2. Products
- 11.2.3.3. SWOT Analysis
- 11.2.3.4. Recent Developments
- 11.2.3.5. Financials (Based on Availability)
- 11.2.4 Onsemi
- 11.2.4.1. Overview
- 11.2.4.2. Products
- 11.2.4.3. SWOT Analysis
- 11.2.4.4. Recent Developments
- 11.2.4.5. Financials (Based on Availability)
- 11.2.5 Frontgrade
- 11.2.5.1. Overview
- 11.2.5.2. Products
- 11.2.5.3. SWOT Analysis
- 11.2.5.4. Recent Developments
- 11.2.5.5. Financials (Based on Availability)
- 11.2.6 TI
- 11.2.6.1. Overview
- 11.2.6.2. Products
- 11.2.6.3. SWOT Analysis
- 11.2.6.4. Recent Developments
- 11.2.6.5. Financials (Based on Availability)
- 11.2.7 Semtech
- 11.2.7.1. Overview
- 11.2.7.2. Products
- 11.2.7.3. SWOT Analysis
- 11.2.7.4. Recent Developments
- 11.2.7.5. Financials (Based on Availability)
- 11.2.8 Microsemi
- 11.2.8.1. Overview
- 11.2.8.2. Products
- 11.2.8.3. SWOT Analysis
- 11.2.8.4. Recent Developments
- 11.2.8.5. Financials (Based on Availability)
- 11.2.9 Lattice
- 11.2.9.1. Overview
- 11.2.9.2. Products
- 11.2.9.3. SWOT Analysis
- 11.2.9.4. Recent Developments
- 11.2.9.5. Financials (Based on Availability)
- 11.2.10 Microchip
- 11.2.10.1. Overview
- 11.2.10.2. Products
- 11.2.10.3. SWOT Analysis
- 11.2.10.4. Recent Developments
- 11.2.10.5. Financials (Based on Availability)
- 11.2.11 STMicroelectronics
- 11.2.11.1. Overview
- 11.2.11.2. Products
- 11.2.11.3. SWOT Analysis
- 11.2.11.4. Recent Developments
- 11.2.11.5. Financials (Based on Availability)
- 11.2.1 Analog Devices
List of Figures
- Figure 1: Global Low Latency Video Crosspoint Switches Revenue Breakdown (undefined, %) by Region 2025 & 2033
- Figure 2: North America Low Latency Video Crosspoint Switches Revenue (undefined), by Application 2025 & 2033
- Figure 3: North America Low Latency Video Crosspoint Switches Revenue Share (%), by Application 2025 & 2033
- Figure 4: North America Low Latency Video Crosspoint Switches Revenue (undefined), by Types 2025 & 2033
- Figure 5: North America Low Latency Video Crosspoint Switches Revenue Share (%), by Types 2025 & 2033
- Figure 6: North America Low Latency Video Crosspoint Switches Revenue (undefined), by Country 2025 & 2033
- Figure 7: North America Low Latency Video Crosspoint Switches Revenue Share (%), by Country 2025 & 2033
- Figure 8: South America Low Latency Video Crosspoint Switches Revenue (undefined), by Application 2025 & 2033
- Figure 9: South America Low Latency Video Crosspoint Switches Revenue Share (%), by Application 2025 & 2033
- Figure 10: South America Low Latency Video Crosspoint Switches Revenue (undefined), by Types 2025 & 2033
- Figure 11: South America Low Latency Video Crosspoint Switches Revenue Share (%), by Types 2025 & 2033
- Figure 12: South America Low Latency Video Crosspoint Switches Revenue (undefined), by Country 2025 & 2033
- Figure 13: South America Low Latency Video Crosspoint Switches Revenue Share (%), by Country 2025 & 2033
- Figure 14: Europe Low Latency Video Crosspoint Switches Revenue (undefined), by Application 2025 & 2033
- Figure 15: Europe Low Latency Video Crosspoint Switches Revenue Share (%), by Application 2025 & 2033
- Figure 16: Europe Low Latency Video Crosspoint Switches Revenue (undefined), by Types 2025 & 2033
- Figure 17: Europe Low Latency Video Crosspoint Switches Revenue Share (%), by Types 2025 & 2033
- Figure 18: Europe Low Latency Video Crosspoint Switches Revenue (undefined), by Country 2025 & 2033
- Figure 19: Europe Low Latency Video Crosspoint Switches Revenue Share (%), by Country 2025 & 2033
- Figure 20: Middle East & Africa Low Latency Video Crosspoint Switches Revenue (undefined), by Application 2025 & 2033
- Figure 21: Middle East & Africa Low Latency Video Crosspoint Switches Revenue Share (%), by Application 2025 & 2033
- Figure 22: Middle East & Africa Low Latency Video Crosspoint Switches Revenue (undefined), by Types 2025 & 2033
- Figure 23: Middle East & Africa Low Latency Video Crosspoint Switches Revenue Share (%), by Types 2025 & 2033
- Figure 24: Middle East & Africa Low Latency Video Crosspoint Switches Revenue (undefined), by Country 2025 & 2033
- Figure 25: Middle East & Africa Low Latency Video Crosspoint Switches Revenue Share (%), by Country 2025 & 2033
- Figure 26: Asia Pacific Low Latency Video Crosspoint Switches Revenue (undefined), by Application 2025 & 2033
- Figure 27: Asia Pacific Low Latency Video Crosspoint Switches Revenue Share (%), by Application 2025 & 2033
- Figure 28: Asia Pacific Low Latency Video Crosspoint Switches Revenue (undefined), by Types 2025 & 2033
- Figure 29: Asia Pacific Low Latency Video Crosspoint Switches Revenue Share (%), by Types 2025 & 2033
- Figure 30: Asia Pacific Low Latency Video Crosspoint Switches Revenue (undefined), by Country 2025 & 2033
- Figure 31: Asia Pacific Low Latency Video Crosspoint Switches Revenue Share (%), by Country 2025 & 2033
List of Tables
- Table 1: Global Low Latency Video Crosspoint Switches Revenue undefined Forecast, by Application 2020 & 2033
- Table 2: Global Low Latency Video Crosspoint Switches Revenue undefined Forecast, by Types 2020 & 2033
- Table 3: Global Low Latency Video Crosspoint Switches Revenue undefined Forecast, by Region 2020 & 2033
- Table 4: Global Low Latency Video Crosspoint Switches Revenue undefined Forecast, by Application 2020 & 2033
- Table 5: Global Low Latency Video Crosspoint Switches Revenue undefined Forecast, by Types 2020 & 2033
- Table 6: Global Low Latency Video Crosspoint Switches Revenue undefined Forecast, by Country 2020 & 2033
- Table 7: United States Low Latency Video Crosspoint Switches Revenue (undefined) Forecast, by Application 2020 & 2033
- Table 8: Canada Low Latency Video Crosspoint Switches Revenue (undefined) Forecast, by Application 2020 & 2033
- Table 9: Mexico Low Latency Video Crosspoint Switches Revenue (undefined) Forecast, by Application 2020 & 2033
- Table 10: Global Low Latency Video Crosspoint Switches Revenue undefined Forecast, by Application 2020 & 2033
- Table 11: Global Low Latency Video Crosspoint Switches Revenue undefined Forecast, by Types 2020 & 2033
- Table 12: Global Low Latency Video Crosspoint Switches Revenue undefined Forecast, by Country 2020 & 2033
- Table 13: Brazil Low Latency Video Crosspoint Switches Revenue (undefined) Forecast, by Application 2020 & 2033
- Table 14: Argentina Low Latency Video Crosspoint Switches Revenue (undefined) Forecast, by Application 2020 & 2033
- Table 15: Rest of South America Low Latency Video Crosspoint Switches Revenue (undefined) Forecast, by Application 2020 & 2033
- Table 16: Global Low Latency Video Crosspoint Switches Revenue undefined Forecast, by Application 2020 & 2033
- Table 17: Global Low Latency Video Crosspoint Switches Revenue undefined Forecast, by Types 2020 & 2033
- Table 18: Global Low Latency Video Crosspoint Switches Revenue undefined Forecast, by Country 2020 & 2033
- Table 19: United Kingdom Low Latency Video Crosspoint Switches Revenue (undefined) Forecast, by Application 2020 & 2033
- Table 20: Germany Low Latency Video Crosspoint Switches Revenue (undefined) Forecast, by Application 2020 & 2033
- Table 21: France Low Latency Video Crosspoint Switches Revenue (undefined) Forecast, by Application 2020 & 2033
- Table 22: Italy Low Latency Video Crosspoint Switches Revenue (undefined) Forecast, by Application 2020 & 2033
- Table 23: Spain Low Latency Video Crosspoint Switches Revenue (undefined) Forecast, by Application 2020 & 2033
- Table 24: Russia Low Latency Video Crosspoint Switches Revenue (undefined) Forecast, by Application 2020 & 2033
- Table 25: Benelux Low Latency Video Crosspoint Switches Revenue (undefined) Forecast, by Application 2020 & 2033
- Table 26: Nordics Low Latency Video Crosspoint Switches Revenue (undefined) Forecast, by Application 2020 & 2033
- Table 27: Rest of Europe Low Latency Video Crosspoint Switches Revenue (undefined) Forecast, by Application 2020 & 2033
- Table 28: Global Low Latency Video Crosspoint Switches Revenue undefined Forecast, by Application 2020 & 2033
- Table 29: Global Low Latency Video Crosspoint Switches Revenue undefined Forecast, by Types 2020 & 2033
- Table 30: Global Low Latency Video Crosspoint Switches Revenue undefined Forecast, by Country 2020 & 2033
- Table 31: Turkey Low Latency Video Crosspoint Switches Revenue (undefined) Forecast, by Application 2020 & 2033
- Table 32: Israel Low Latency Video Crosspoint Switches Revenue (undefined) Forecast, by Application 2020 & 2033
- Table 33: GCC Low Latency Video Crosspoint Switches Revenue (undefined) Forecast, by Application 2020 & 2033
- Table 34: North Africa Low Latency Video Crosspoint Switches Revenue (undefined) Forecast, by Application 2020 & 2033
- Table 35: South Africa Low Latency Video Crosspoint Switches Revenue (undefined) Forecast, by Application 2020 & 2033
- Table 36: Rest of Middle East & Africa Low Latency Video Crosspoint Switches Revenue (undefined) Forecast, by Application 2020 & 2033
- Table 37: Global Low Latency Video Crosspoint Switches Revenue undefined Forecast, by Application 2020 & 2033
- Table 38: Global Low Latency Video Crosspoint Switches Revenue undefined Forecast, by Types 2020 & 2033
- Table 39: Global Low Latency Video Crosspoint Switches Revenue undefined Forecast, by Country 2020 & 2033
- Table 40: China Low Latency Video Crosspoint Switches Revenue (undefined) Forecast, by Application 2020 & 2033
- Table 41: India Low Latency Video Crosspoint Switches Revenue (undefined) Forecast, by Application 2020 & 2033
- Table 42: Japan Low Latency Video Crosspoint Switches Revenue (undefined) Forecast, by Application 2020 & 2033
- Table 43: South Korea Low Latency Video Crosspoint Switches Revenue (undefined) Forecast, by Application 2020 & 2033
- Table 44: ASEAN Low Latency Video Crosspoint Switches Revenue (undefined) Forecast, by Application 2020 & 2033
- Table 45: Oceania Low Latency Video Crosspoint Switches Revenue (undefined) Forecast, by Application 2020 & 2033
- Table 46: Rest of Asia Pacific Low Latency Video Crosspoint Switches Revenue (undefined) Forecast, by Application 2020 & 2033
Frequently Asked Questions
1. What is the projected Compound Annual Growth Rate (CAGR) of the Low Latency Video Crosspoint Switches?
The projected CAGR is approximately 11%.
2. Which companies are prominent players in the Low Latency Video Crosspoint Switches?
Key companies in the market include Analog Devices, MACOM, Renesas Electronics, Onsemi, Frontgrade, TI, Semtech, Microsemi, Lattice, Microchip, STMicroelectronics.
3. What are the main segments of the Low Latency Video Crosspoint Switches?
The market segments include Application, Types.
4. Can you provide details about the market size?
The market size is estimated to be USD XXX N/A as of 2022.
5. What are some drivers contributing to market growth?
N/A
6. What are the notable trends driving market growth?
N/A
7. Are there any restraints impacting market growth?
N/A
8. Can you provide examples of recent developments in the market?
N/A
9. What pricing options are available for accessing the report?
Pricing options include single-user, multi-user, and enterprise licenses priced at USD 4900.00, USD 7350.00, and USD 9800.00 respectively.
10. Is the market size provided in terms of value or volume?
The market size is provided in terms of value, measured in N/A.
11. Are there any specific market keywords associated with the report?
Yes, the market keyword associated with the report is "Low Latency Video Crosspoint Switches," which aids in identifying and referencing the specific market segment covered.
12. How do I determine which pricing option suits my needs best?
The pricing options vary based on user requirements and access needs. Individual users may opt for single-user licenses, while businesses requiring broader access may choose multi-user or enterprise licenses for cost-effective access to the report.
13. Are there any additional resources or data provided in the Low Latency Video Crosspoint Switches report?
While the report offers comprehensive insights, it's advisable to review the specific contents or supplementary materials provided to ascertain if additional resources or data are available.
14. How can I stay updated on further developments or reports in the Low Latency Video Crosspoint Switches?
To stay informed about further developments, trends, and reports in the Low Latency Video Crosspoint Switches, consider subscribing to industry newsletters, following relevant companies and organizations, or regularly checking reputable industry news sources and publications.
Methodology
Step 1 - Identification of Relevant Samples Size from Population Database


Step 2 - Approaches for Defining Global Market Size (Value, Volume* & Price*)

Note*: In applicable scenarios
Step 3 - Data Sources
Primary Research
- Web Analytics
- Survey Reports
- Research Institute
- Latest Research Reports
- Opinion Leaders
Secondary Research
- Annual Reports
- White Paper
- Latest Press Release
- Industry Association
- Paid Database
- Investor Presentations

Step 4 - Data Triangulation
Involves using different sources of information in order to increase the validity of a study
These sources are likely to be stakeholders in a program - participants, other researchers, program staff, other community members, and so on.
Then we put all data in single framework & apply various statistical tools to find out the dynamic on the market.
During the analysis stage, feedback from the stakeholder groups would be compared to determine areas of agreement as well as areas of divergence