

Key Insights
The global Marine Asset Management Services market is poised for robust expansion, projected to reach a substantial USD 2.16 billion in 2025. This growth is fueled by an anticipated Compound Annual Growth Rate (CAGR) of 4.4% over the forecast period of 2025-2033. The increasing complexity of maritime operations, coupled with stringent regulatory compliance requirements, necessitates sophisticated asset management solutions to optimize efficiency, reduce operational costs, and ensure the longevity and safety of marine assets. Key drivers include the growing demand for sustainable maritime practices, advancements in digital technologies like IoT and AI for predictive maintenance, and the expansion of offshore industries such as oil and gas, renewable energy, and aquaculture. These factors are collectively pushing organizations to adopt comprehensive marine asset management services to gain a competitive edge.
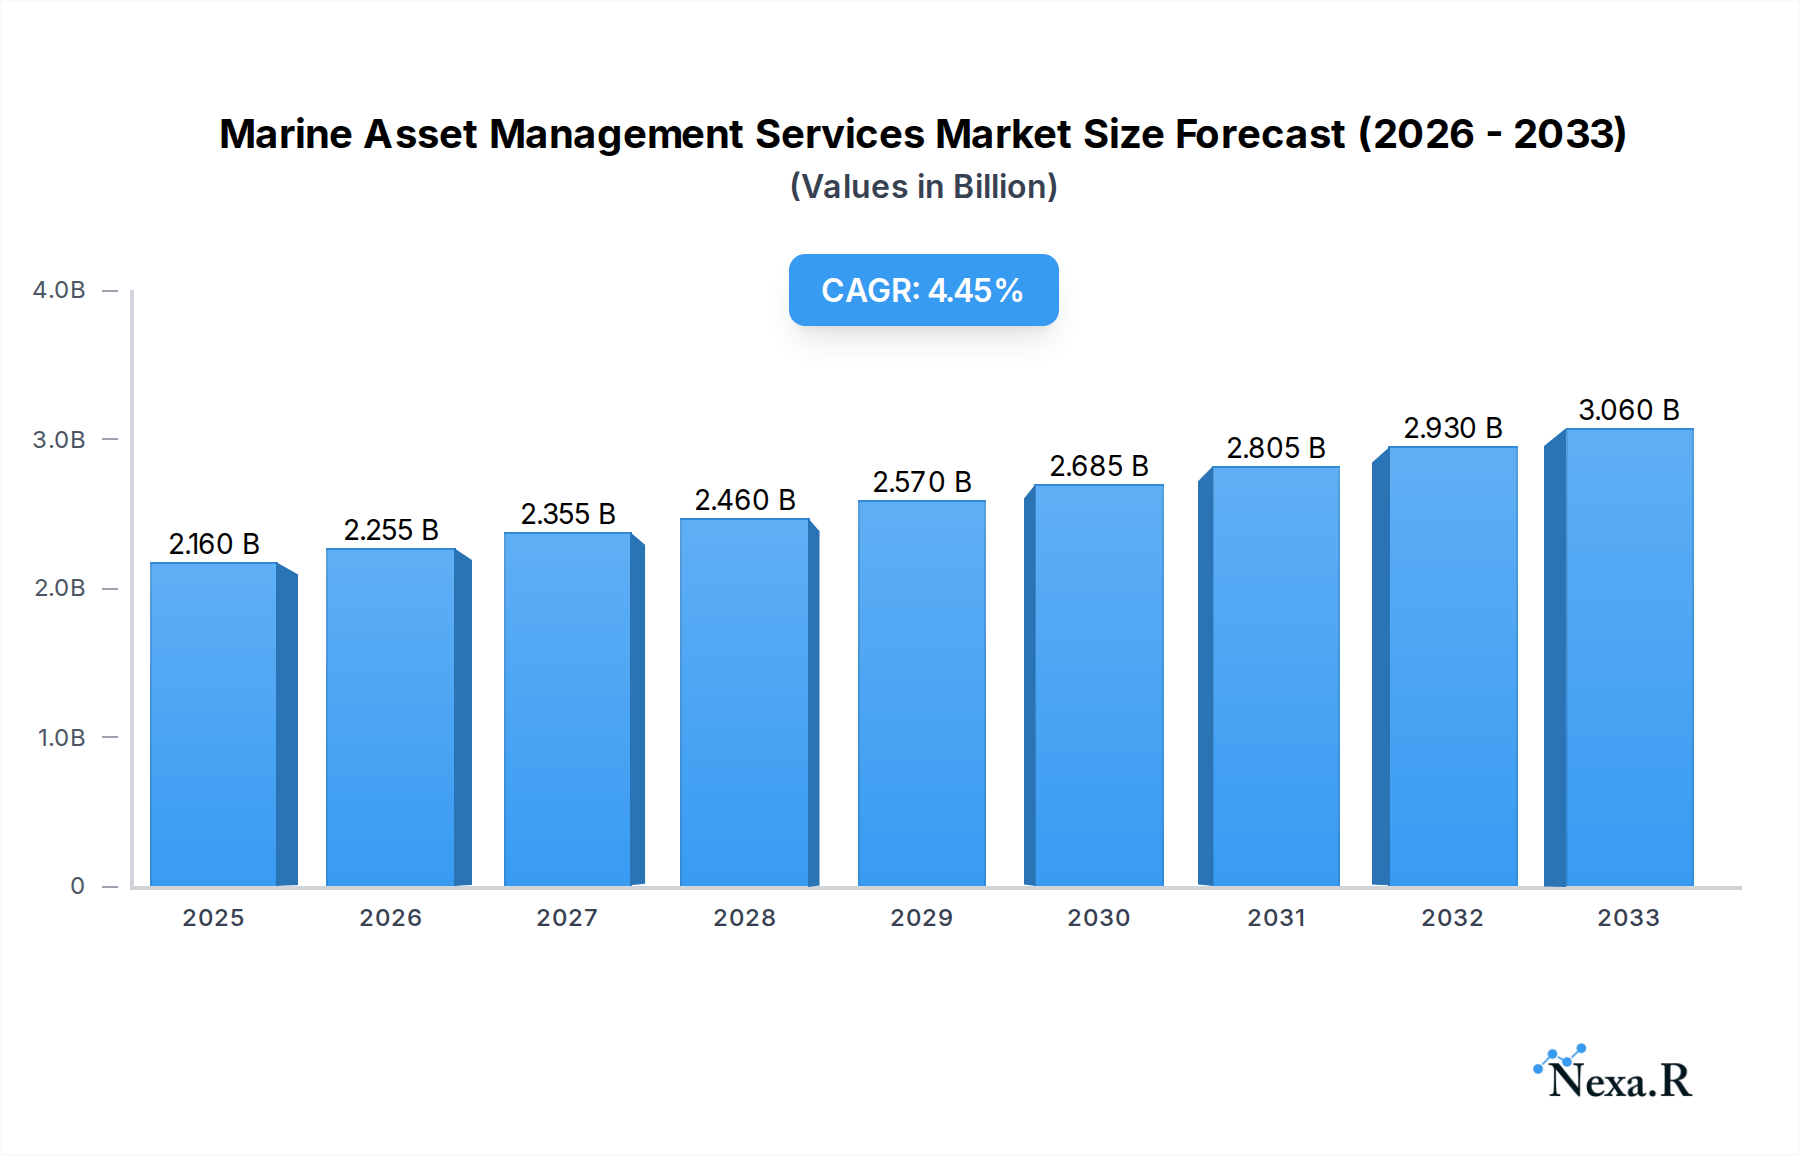
Marine Asset Management Services Market Size (In Billion)
The market landscape is characterized by a clear segmentation based on application and type. Small and Medium-sized Enterprises (SMEs) are increasingly recognizing the value proposition of professional marine asset management, moving beyond ad-hoc solutions. Simultaneously, large enterprises continue to drive demand with their extensive fleets and complex operational needs. In terms of service type, cloud-based solutions are gaining significant traction due to their scalability, accessibility, and cost-effectiveness, while web-based platforms offer flexible deployment options. Restraints such as high initial investment costs for advanced technologies and a shortage of skilled professionals in certain regions may temper growth, but the overarching trend points towards a dynamic and expanding market. Companies like Tokio Marine Investment Management, Babcock International Group PLC, and Fugro are among the key players actively shaping this evolving industry.

Marine Asset Management Services Company Market Share
This in-depth report provides a critical analysis of the global Marine Asset Management Services market, covering its historical trajectory, current dynamics, projected growth, and future opportunities. Covering the Study Period 2019–2033, with a Base Year of 2025 and a Forecast Period of 2025–2033, this report leverages extensive data and expert insights to deliver actionable intelligence for industry stakeholders. We explore the evolving landscape for both SMEs and Large Enterprises, and the burgeoning adoption of Cloud Based and Web Based solutions.
Marine Asset Management Services Market Dynamics & Structure
The global Marine Asset Management Services market exhibits a moderately concentrated structure, with key players like Tokio Marine Investment Management, Babcock International Group PLC, and Offshore Marine Asset Management (OMAM) Pte Ltd holding significant sway. Technological innovation is a primary driver, fueled by advancements in IoT, AI, and predictive analytics for enhanced vessel monitoring, maintenance optimization, and risk mitigation. Regulatory frameworks, particularly those focused on environmental compliance (e.g., IMO 2020) and safety standards, are increasingly shaping service offerings and driving demand. Competitive product substitutes, while present in siloed maintenance solutions, are being consolidated under integrated asset management platforms. End-user demographics are shifting, with a growing demand for digital-first, data-driven solutions across both SMEs and Large Enterprises. Mergers and acquisitions (M&A) are a notable trend, with recent deal volumes indicating a consolidation of specialized service providers to offer comprehensive solutions. For instance, the acquisition of smaller tech firms by larger marine service conglomerates aims to integrate cutting-edge capabilities.
- Market Concentration: Moderately concentrated, with major players focusing on integrated service portfolios.
- Technological Innovation Drivers: IoT sensors, AI-powered analytics for predictive maintenance, blockchain for supply chain transparency.
- Regulatory Frameworks: IMO emissions standards, safety certifications (e.g., ISM Code), ballast water management regulations.
- Competitive Product Substitutes: Standalone maintenance software, manual tracking systems, specialized surveying tools.
- End-User Demographics: Increasing demand from offshore energy, commercial shipping, and defense sectors.
- M&A Trends: Consolidation to create end-to-end service providers, strategic acquisitions of innovative technology firms. Estimated M&A deal value in the child market of maritime technology is projected to reach $15 billion by 2025.
Marine Asset Management Services Growth Trends & Insights
The global Marine Asset Management Services market is poised for substantial growth, driven by an increasing imperative for operational efficiency, cost optimization, and enhanced safety and compliance within the maritime industry. The market size, valued at approximately $20 billion in the base year of 2025, is projected to expand at a robust Compound Annual Growth Rate (CAGR) of 8.5% over the forecast period. This expansion is underpinned by the rising adoption of digital technologies, moving beyond traditional reactive maintenance to proactive and predictive strategies. The increasing complexity of marine assets, coupled with stringent environmental regulations, necessitates sophisticated management systems that can optimize performance, minimize downtime, and ensure regulatory adherence. Consumer behavior is also evolving, with ship owners and operators increasingly seeking integrated platforms that offer real-time data insights, remote monitoring capabilities, and a consolidated view of their asset portfolio. The shift towards Cloud Based solutions is particularly significant, offering scalability, accessibility, and advanced analytics at a reduced cost of ownership for many operators. The parent market for overall maritime services is estimated to reach $1.5 trillion by 2025, with marine asset management services representing a critical and growing segment. This growth is further propelled by the rising global trade volumes and the increasing reliance on maritime transport for global supply chains.
Dominant Regions, Countries, or Segments in Marine Asset Management Services
The Cloud Based segment within Marine Asset Management Services is emerging as a dominant force, driven by its inherent scalability, accessibility, and cost-effectiveness, particularly for SMEs and large enterprises alike. The agility offered by cloud solutions allows businesses to adapt quickly to changing operational demands and integrate various data streams from diverse marine assets. For SMEs, cloud-based platforms provide access to sophisticated asset management tools previously only accessible to larger corporations, democratizing advanced capabilities and fostering growth. For Large Enterprises, cloud solutions enable centralized oversight of extensive fleets, optimizing resource allocation and streamlining maintenance schedules across geographically dispersed operations.
Key drivers for the dominance of cloud-based solutions include:
- Economic Policies: Government incentives for digitalization and adoption of green technologies are indirectly boosting cloud service adoption by reducing initial investment barriers.
- Infrastructure: Proliferation of reliable internet connectivity in key maritime hubs globally facilitates seamless data transmission and access to cloud platforms.
- Technological Advancements: Continuous improvements in cloud computing, cybersecurity, and data analytics enhance the reliability and functionality of cloud-based marine asset management.
- Cost-Effectiveness: Reduced upfront hardware costs and predictable subscription models make cloud solutions attractive, especially for SMEs. The global cloud computing market is projected to reach $800 billion by 2025, with specialized industry verticals like marine asset management contributing significantly.
The market share for cloud-based solutions in marine asset management is estimated to reach 60% by 2028, a substantial increase from its historical share. This segment's growth potential is further amplified by the increasing volume of data generated by connected vessels and the demand for advanced analytics to derive actionable insights. The ability to remotely manage and monitor assets, perform predictive maintenance, and ensure compliance with evolving regulations are all key factors contributing to the rapid adoption of cloud-based marine asset management services.
Marine Asset Management Services Product Landscape
The Marine Asset Management Services product landscape is characterized by innovative solutions that integrate advanced technologies to enhance operational efficiency and asset longevity. Key innovations include AI-powered predictive maintenance modules that analyze real-time sensor data to forecast equipment failures, minimizing costly downtime. Digital twins are emerging as powerful tools, creating virtual replicas of physical assets for simulation, performance monitoring, and scenario planning. Furthermore, the integration of IoT sensors across vessel components allows for comprehensive condition monitoring, from engine performance to hull integrity. Performance metrics are increasingly focused on uptime maximization, fuel efficiency optimization, and reduced maintenance expenditure. Unique selling propositions often revolve around bespoke integration capabilities with existing vessel systems and comprehensive lifecycle management.
Key Drivers, Barriers & Challenges in Marine Asset Management Services
Key Drivers:
- Technological Advancements: The continuous evolution of IoT, AI, and Big Data analytics is enabling more sophisticated asset monitoring, predictive maintenance, and performance optimization.
- Cost Optimization Pressures: Shipowners and operators are actively seeking solutions to reduce operational expenditures, including fuel consumption and maintenance costs.
- Regulatory Compliance: Increasingly stringent environmental and safety regulations worldwide are driving the need for robust asset management systems to ensure adherence.
- Demand for Efficiency and Safety: The maritime industry's inherent need for high operational efficiency and uncompromising safety standards fuels the adoption of advanced management services.
Key Barriers & Challenges:
- High Initial Investment: The upfront cost of implementing comprehensive digital asset management systems can be a deterrent, especially for smaller operators.
- Cybersecurity Risks: The increasing connectivity of marine assets raises concerns about data breaches and cyberattacks, requiring robust security measures.
- Integration Complexity: Integrating new asset management software with legacy systems on vessels can be technically challenging and time-consuming.
- Skilled Workforce Shortage: A lack of adequately trained personnel to manage and interpret data from advanced asset management systems poses a significant hurdle. The estimated cost of supply chain disruptions due to asset failures can range from $5 billion to $10 billion annually across the global maritime sector.
Emerging Opportunities in Marine Asset Management Services
Emerging opportunities in the Marine Asset Management Services sector are largely driven by the burgeoning demand for sustainable maritime operations and the increasing adoption of autonomous and smart vessel technologies. The development of specialized solutions for offshore renewable energy assets, such as wind farms and tidal energy converters, presents a significant untapped market. Furthermore, the integration of blockchain technology for enhanced transparency and traceability in the maritime supply chain offers new avenues for service providers. The growing emphasis on remote monitoring and control capabilities, facilitated by advancements in satellite communication and 5G technology, opens up possibilities for remote diagnostics and intervention services.
Growth Accelerators in the Marine Asset Management Services Industry
Several key growth accelerators are propelling the Marine Asset Management Services industry forward. Technological breakthroughs, particularly in the realm of AI for predictive analytics and machine learning for anomaly detection, are transforming maintenance strategies from reactive to proactive. Strategic partnerships between technology providers, shipyards, and vessel operators are crucial for developing tailored solutions and accelerating market penetration. Furthermore, expansion into emerging maritime economies and the increasing focus on lifecycle management for new builds and retrofits are significant growth catalysts. The development of comprehensive digital platforms that encompass not only maintenance but also compliance, crew management, and financial reporting will further accelerate growth.
Key Players Shaping the Marine Asset Management Services Market
- Tokio Marine Investment Management
- Babcock International Group PLC
- Offshore Marine Asset Management (OMAM) Pte Ltd
- Fugro
- Oceanic Marine Management
- Marine Asset Management Inc
- Northern Marine Group
- Seamac Marine
- SKF
- Norship
Notable Milestones in Marine Asset Management Services Sector
- 2019: Increased adoption of IoT sensors for real-time vessel performance monitoring.
- 2020: Implementation of stricter environmental regulations (e.g., IMO 2020) driving demand for compliance-focused asset management.
- 2021: Significant growth in cloud-based marine asset management solutions.
- 2022: Rise of AI-powered predictive maintenance tools gaining traction.
- 2023: Key acquisitions of specialized maritime technology firms by larger conglomerates.
- 2024: Increased investment in cybersecurity solutions for connected marine assets.
- 2025 (Est.): Projected market value of $20 billion.
- 2026-2033 (Forecast): Continued robust CAGR of 8.5%.
In-Depth Marine Asset Management Services Market Outlook
The outlook for the Marine Asset Management Services market is exceptionally bright, driven by an ongoing digital transformation within the maritime industry. The continuous pursuit of operational excellence, coupled with evolving environmental mandates and the increasing complexity of marine assets, ensures sustained demand for advanced management solutions. Growth accelerators such as technological innovation in AI and IoT, strategic industry collaborations, and expansion into nascent maritime markets will collectively drive market expansion. The market is well-positioned for continued growth, with a significant focus on sustainability, efficiency, and safety shaping future service offerings and creating substantial opportunities for market participants.
Marine Asset Management Services Segmentation
-
1. Application
- 1.1. SMEs
- 1.2. Large Enterprises
-
2. Types
- 2.1. Cloud Based
- 2.2. Web Based
Marine Asset Management Services Segmentation By Geography
-
1. North America
- 1.1. United States
- 1.2. Canada
- 1.3. Mexico
-
2. South America
- 2.1. Brazil
- 2.2. Argentina
- 2.3. Rest of South America
-
3. Europe
- 3.1. United Kingdom
- 3.2. Germany
- 3.3. France
- 3.4. Italy
- 3.5. Spain
- 3.6. Russia
- 3.7. Benelux
- 3.8. Nordics
- 3.9. Rest of Europe
-
4. Middle East & Africa
- 4.1. Turkey
- 4.2. Israel
- 4.3. GCC
- 4.4. North Africa
- 4.5. South Africa
- 4.6. Rest of Middle East & Africa
-
5. Asia Pacific
- 5.1. China
- 5.2. India
- 5.3. Japan
- 5.4. South Korea
- 5.5. ASEAN
- 5.6. Oceania
- 5.7. Rest of Asia Pacific
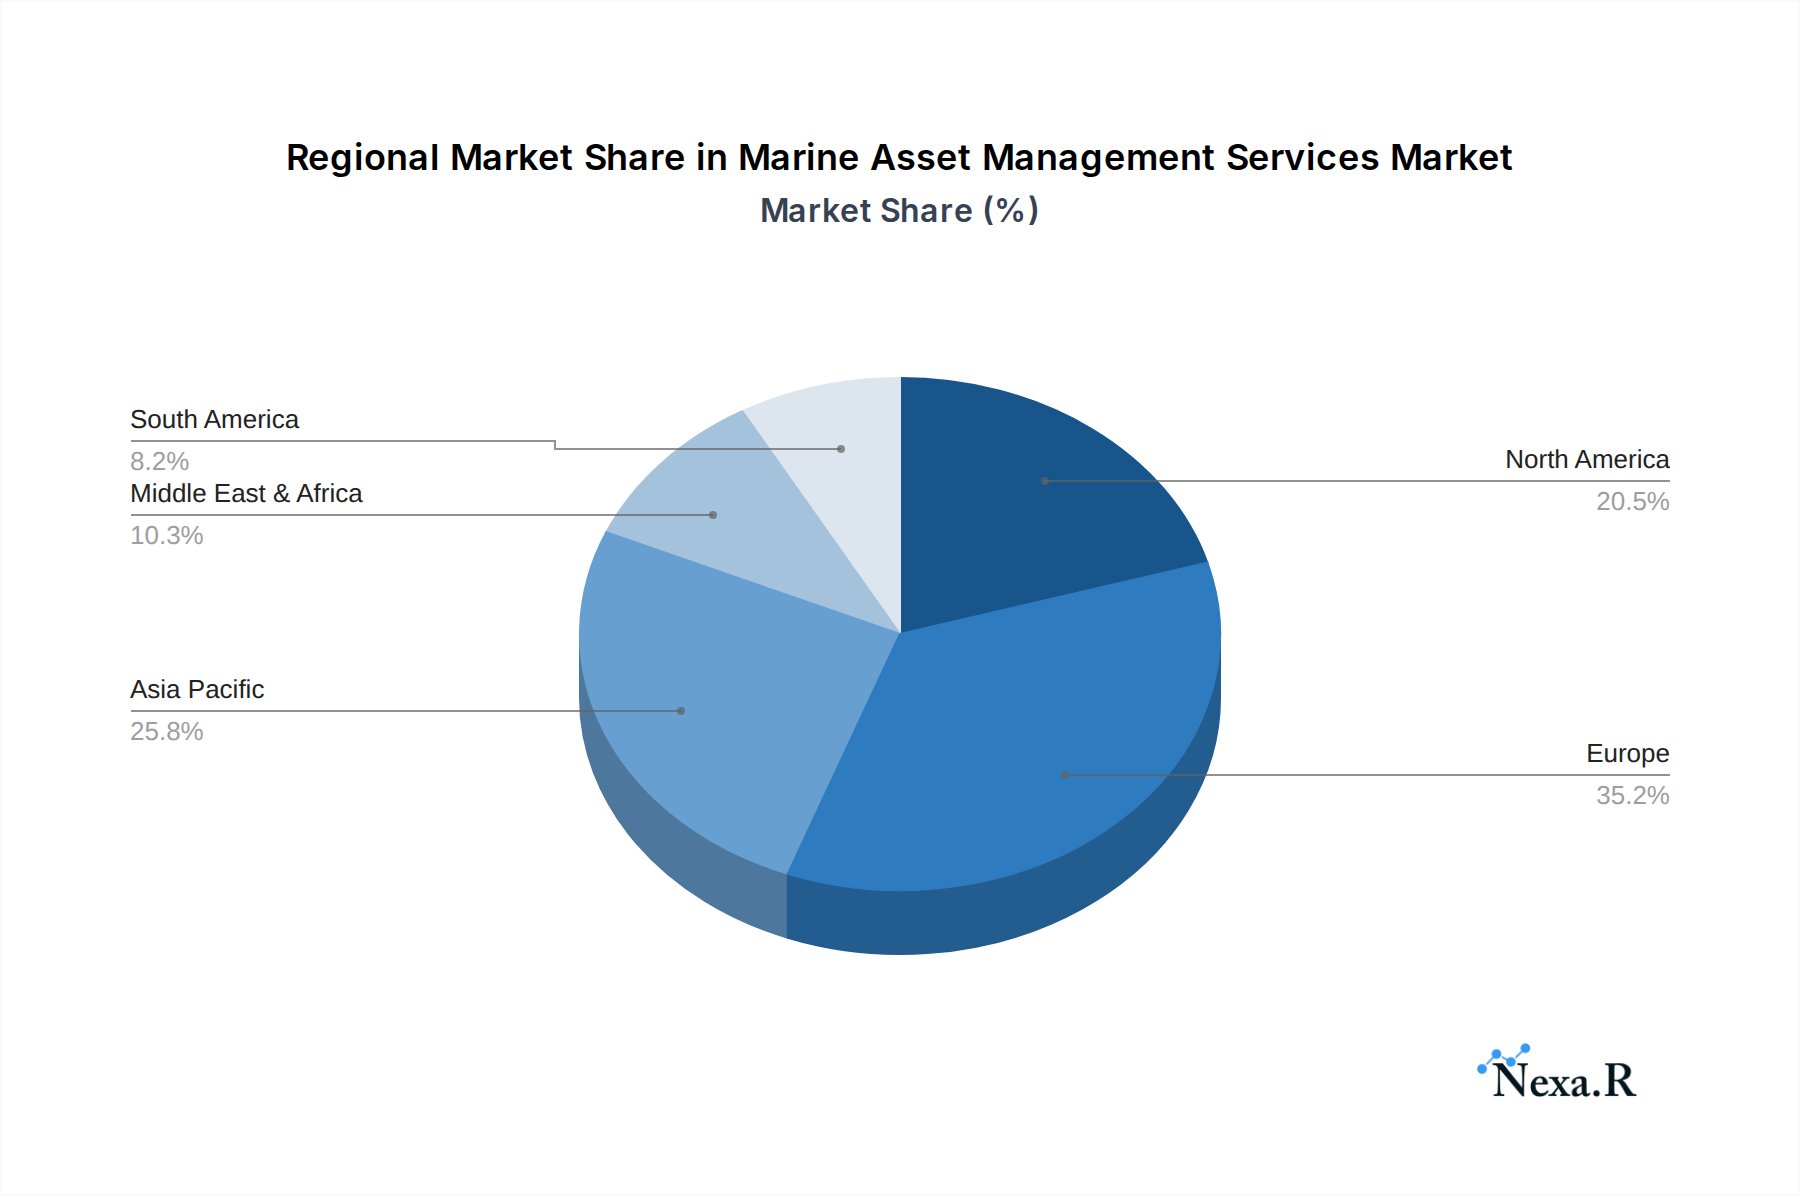
Marine Asset Management Services Regional Market Share
Geographic Coverage of Marine Asset Management Services
Marine Asset Management Services REPORT HIGHLIGHTS
| Aspects | Details |
|---|---|
| Study Period | 2020-2034 |
| Base Year | 2025 |
| Estimated Year | 2026 |
| Forecast Period | 2026-2034 |
| Historical Period | 2020-2025 |
| Growth Rate | CAGR of 4.4% from 2020-2034 |
| Segmentation |
|
Table of Contents
- 1. Introduction
- 1.1. Research Scope
- 1.2. Market Segmentation
- 1.3. Research Methodology
- 1.4. Definitions and Assumptions
- 2. Executive Summary
- 2.1. Introduction
- 3. Market Dynamics
- 3.1. Introduction
- 3.2. Market Drivers
- 3.3. Market Restrains
- 3.4. Market Trends
- 4. Market Factor Analysis
- 4.1. Porters Five Forces
- 4.2. Supply/Value Chain
- 4.3. PESTEL analysis
- 4.4. Market Entropy
- 4.5. Patent/Trademark Analysis
- 5. Global Marine Asset Management Services Analysis, Insights and Forecast, 2020-2032
- 5.1. Market Analysis, Insights and Forecast - by Application
- 5.1.1. SMEs
- 5.1.2. Large Enterprises
- 5.2. Market Analysis, Insights and Forecast - by Types
- 5.2.1. Cloud Based
- 5.2.2. Web Based
- 5.3. Market Analysis, Insights and Forecast - by Region
- 5.3.1. North America
- 5.3.2. South America
- 5.3.3. Europe
- 5.3.4. Middle East & Africa
- 5.3.5. Asia Pacific
- 5.1. Market Analysis, Insights and Forecast - by Application
- 6. North America Marine Asset Management Services Analysis, Insights and Forecast, 2020-2032
- 6.1. Market Analysis, Insights and Forecast - by Application
- 6.1.1. SMEs
- 6.1.2. Large Enterprises
- 6.2. Market Analysis, Insights and Forecast - by Types
- 6.2.1. Cloud Based
- 6.2.2. Web Based
- 6.1. Market Analysis, Insights and Forecast - by Application
- 7. South America Marine Asset Management Services Analysis, Insights and Forecast, 2020-2032
- 7.1. Market Analysis, Insights and Forecast - by Application
- 7.1.1. SMEs
- 7.1.2. Large Enterprises
- 7.2. Market Analysis, Insights and Forecast - by Types
- 7.2.1. Cloud Based
- 7.2.2. Web Based
- 7.1. Market Analysis, Insights and Forecast - by Application
- 8. Europe Marine Asset Management Services Analysis, Insights and Forecast, 2020-2032
- 8.1. Market Analysis, Insights and Forecast - by Application
- 8.1.1. SMEs
- 8.1.2. Large Enterprises
- 8.2. Market Analysis, Insights and Forecast - by Types
- 8.2.1. Cloud Based
- 8.2.2. Web Based
- 8.1. Market Analysis, Insights and Forecast - by Application
- 9. Middle East & Africa Marine Asset Management Services Analysis, Insights and Forecast, 2020-2032
- 9.1. Market Analysis, Insights and Forecast - by Application
- 9.1.1. SMEs
- 9.1.2. Large Enterprises
- 9.2. Market Analysis, Insights and Forecast - by Types
- 9.2.1. Cloud Based
- 9.2.2. Web Based
- 9.1. Market Analysis, Insights and Forecast - by Application
- 10. Asia Pacific Marine Asset Management Services Analysis, Insights and Forecast, 2020-2032
- 10.1. Market Analysis, Insights and Forecast - by Application
- 10.1.1. SMEs
- 10.1.2. Large Enterprises
- 10.2. Market Analysis, Insights and Forecast - by Types
- 10.2.1. Cloud Based
- 10.2.2. Web Based
- 10.1. Market Analysis, Insights and Forecast - by Application
- 11. Competitive Analysis
- 11.1. Global Market Share Analysis 2025
- 11.2. Company Profiles
- 11.2.1 Tokio Marine Investment Management
- 11.2.1.1. Overview
- 11.2.1.2. Products
- 11.2.1.3. SWOT Analysis
- 11.2.1.4. Recent Developments
- 11.2.1.5. Financials (Based on Availability)
- 11.2.2 Babcock International Group PLC
- 11.2.2.1. Overview
- 11.2.2.2. Products
- 11.2.2.3. SWOT Analysis
- 11.2.2.4. Recent Developments
- 11.2.2.5. Financials (Based on Availability)
- 11.2.3 Offshore Marine Asset Management (OMAM) Pte Ltd
- 11.2.3.1. Overview
- 11.2.3.2. Products
- 11.2.3.3. SWOT Analysis
- 11.2.3.4. Recent Developments
- 11.2.3.5. Financials (Based on Availability)
- 11.2.4 Fugro
- 11.2.4.1. Overview
- 11.2.4.2. Products
- 11.2.4.3. SWOT Analysis
- 11.2.4.4. Recent Developments
- 11.2.4.5. Financials (Based on Availability)
- 11.2.5 Oceanic Marine Management
- 11.2.5.1. Overview
- 11.2.5.2. Products
- 11.2.5.3. SWOT Analysis
- 11.2.5.4. Recent Developments
- 11.2.5.5. Financials (Based on Availability)
- 11.2.6 Marine Asset Management Inc
- 11.2.6.1. Overview
- 11.2.6.2. Products
- 11.2.6.3. SWOT Analysis
- 11.2.6.4. Recent Developments
- 11.2.6.5. Financials (Based on Availability)
- 11.2.7 Northern Marine Group
- 11.2.7.1. Overview
- 11.2.7.2. Products
- 11.2.7.3. SWOT Analysis
- 11.2.7.4. Recent Developments
- 11.2.7.5. Financials (Based on Availability)
- 11.2.8 Seamac Marine
- 11.2.8.1. Overview
- 11.2.8.2. Products
- 11.2.8.3. SWOT Analysis
- 11.2.8.4. Recent Developments
- 11.2.8.5. Financials (Based on Availability)
- 11.2.9 SKF
- 11.2.9.1. Overview
- 11.2.9.2. Products
- 11.2.9.3. SWOT Analysis
- 11.2.9.4. Recent Developments
- 11.2.9.5. Financials (Based on Availability)
- 11.2.10 Norship
- 11.2.10.1. Overview
- 11.2.10.2. Products
- 11.2.10.3. SWOT Analysis
- 11.2.10.4. Recent Developments
- 11.2.10.5. Financials (Based on Availability)
- 11.2.1 Tokio Marine Investment Management
List of Figures
- Figure 1: Global Marine Asset Management Services Revenue Breakdown (undefined, %) by Region 2025 & 2033
- Figure 2: North America Marine Asset Management Services Revenue (undefined), by Application 2025 & 2033
- Figure 3: North America Marine Asset Management Services Revenue Share (%), by Application 2025 & 2033
- Figure 4: North America Marine Asset Management Services Revenue (undefined), by Types 2025 & 2033
- Figure 5: North America Marine Asset Management Services Revenue Share (%), by Types 2025 & 2033
- Figure 6: North America Marine Asset Management Services Revenue (undefined), by Country 2025 & 2033
- Figure 7: North America Marine Asset Management Services Revenue Share (%), by Country 2025 & 2033
- Figure 8: South America Marine Asset Management Services Revenue (undefined), by Application 2025 & 2033
- Figure 9: South America Marine Asset Management Services Revenue Share (%), by Application 2025 & 2033
- Figure 10: South America Marine Asset Management Services Revenue (undefined), by Types 2025 & 2033
- Figure 11: South America Marine Asset Management Services Revenue Share (%), by Types 2025 & 2033
- Figure 12: South America Marine Asset Management Services Revenue (undefined), by Country 2025 & 2033
- Figure 13: South America Marine Asset Management Services Revenue Share (%), by Country 2025 & 2033
- Figure 14: Europe Marine Asset Management Services Revenue (undefined), by Application 2025 & 2033
- Figure 15: Europe Marine Asset Management Services Revenue Share (%), by Application 2025 & 2033
- Figure 16: Europe Marine Asset Management Services Revenue (undefined), by Types 2025 & 2033
- Figure 17: Europe Marine Asset Management Services Revenue Share (%), by Types 2025 & 2033
- Figure 18: Europe Marine Asset Management Services Revenue (undefined), by Country 2025 & 2033
- Figure 19: Europe Marine Asset Management Services Revenue Share (%), by Country 2025 & 2033
- Figure 20: Middle East & Africa Marine Asset Management Services Revenue (undefined), by Application 2025 & 2033
- Figure 21: Middle East & Africa Marine Asset Management Services Revenue Share (%), by Application 2025 & 2033
- Figure 22: Middle East & Africa Marine Asset Management Services Revenue (undefined), by Types 2025 & 2033
- Figure 23: Middle East & Africa Marine Asset Management Services Revenue Share (%), by Types 2025 & 2033
- Figure 24: Middle East & Africa Marine Asset Management Services Revenue (undefined), by Country 2025 & 2033
- Figure 25: Middle East & Africa Marine Asset Management Services Revenue Share (%), by Country 2025 & 2033
- Figure 26: Asia Pacific Marine Asset Management Services Revenue (undefined), by Application 2025 & 2033
- Figure 27: Asia Pacific Marine Asset Management Services Revenue Share (%), by Application 2025 & 2033
- Figure 28: Asia Pacific Marine Asset Management Services Revenue (undefined), by Types 2025 & 2033
- Figure 29: Asia Pacific Marine Asset Management Services Revenue Share (%), by Types 2025 & 2033
- Figure 30: Asia Pacific Marine Asset Management Services Revenue (undefined), by Country 2025 & 2033
- Figure 31: Asia Pacific Marine Asset Management Services Revenue Share (%), by Country 2025 & 2033
List of Tables
- Table 1: Global Marine Asset Management Services Revenue undefined Forecast, by Application 2020 & 2033
- Table 2: Global Marine Asset Management Services Revenue undefined Forecast, by Types 2020 & 2033
- Table 3: Global Marine Asset Management Services Revenue undefined Forecast, by Region 2020 & 2033
- Table 4: Global Marine Asset Management Services Revenue undefined Forecast, by Application 2020 & 2033
- Table 5: Global Marine Asset Management Services Revenue undefined Forecast, by Types 2020 & 2033
- Table 6: Global Marine Asset Management Services Revenue undefined Forecast, by Country 2020 & 2033
- Table 7: United States Marine Asset Management Services Revenue (undefined) Forecast, by Application 2020 & 2033
- Table 8: Canada Marine Asset Management Services Revenue (undefined) Forecast, by Application 2020 & 2033
- Table 9: Mexico Marine Asset Management Services Revenue (undefined) Forecast, by Application 2020 & 2033
- Table 10: Global Marine Asset Management Services Revenue undefined Forecast, by Application 2020 & 2033
- Table 11: Global Marine Asset Management Services Revenue undefined Forecast, by Types 2020 & 2033
- Table 12: Global Marine Asset Management Services Revenue undefined Forecast, by Country 2020 & 2033
- Table 13: Brazil Marine Asset Management Services Revenue (undefined) Forecast, by Application 2020 & 2033
- Table 14: Argentina Marine Asset Management Services Revenue (undefined) Forecast, by Application 2020 & 2033
- Table 15: Rest of South America Marine Asset Management Services Revenue (undefined) Forecast, by Application 2020 & 2033
- Table 16: Global Marine Asset Management Services Revenue undefined Forecast, by Application 2020 & 2033
- Table 17: Global Marine Asset Management Services Revenue undefined Forecast, by Types 2020 & 2033
- Table 18: Global Marine Asset Management Services Revenue undefined Forecast, by Country 2020 & 2033
- Table 19: United Kingdom Marine Asset Management Services Revenue (undefined) Forecast, by Application 2020 & 2033
- Table 20: Germany Marine Asset Management Services Revenue (undefined) Forecast, by Application 2020 & 2033
- Table 21: France Marine Asset Management Services Revenue (undefined) Forecast, by Application 2020 & 2033
- Table 22: Italy Marine Asset Management Services Revenue (undefined) Forecast, by Application 2020 & 2033
- Table 23: Spain Marine Asset Management Services Revenue (undefined) Forecast, by Application 2020 & 2033
- Table 24: Russia Marine Asset Management Services Revenue (undefined) Forecast, by Application 2020 & 2033
- Table 25: Benelux Marine Asset Management Services Revenue (undefined) Forecast, by Application 2020 & 2033
- Table 26: Nordics Marine Asset Management Services Revenue (undefined) Forecast, by Application 2020 & 2033
- Table 27: Rest of Europe Marine Asset Management Services Revenue (undefined) Forecast, by Application 2020 & 2033
- Table 28: Global Marine Asset Management Services Revenue undefined Forecast, by Application 2020 & 2033
- Table 29: Global Marine Asset Management Services Revenue undefined Forecast, by Types 2020 & 2033
- Table 30: Global Marine Asset Management Services Revenue undefined Forecast, by Country 2020 & 2033
- Table 31: Turkey Marine Asset Management Services Revenue (undefined) Forecast, by Application 2020 & 2033
- Table 32: Israel Marine Asset Management Services Revenue (undefined) Forecast, by Application 2020 & 2033
- Table 33: GCC Marine Asset Management Services Revenue (undefined) Forecast, by Application 2020 & 2033
- Table 34: North Africa Marine Asset Management Services Revenue (undefined) Forecast, by Application 2020 & 2033
- Table 35: South Africa Marine Asset Management Services Revenue (undefined) Forecast, by Application 2020 & 2033
- Table 36: Rest of Middle East & Africa Marine Asset Management Services Revenue (undefined) Forecast, by Application 2020 & 2033
- Table 37: Global Marine Asset Management Services Revenue undefined Forecast, by Application 2020 & 2033
- Table 38: Global Marine Asset Management Services Revenue undefined Forecast, by Types 2020 & 2033
- Table 39: Global Marine Asset Management Services Revenue undefined Forecast, by Country 2020 & 2033
- Table 40: China Marine Asset Management Services Revenue (undefined) Forecast, by Application 2020 & 2033
- Table 41: India Marine Asset Management Services Revenue (undefined) Forecast, by Application 2020 & 2033
- Table 42: Japan Marine Asset Management Services Revenue (undefined) Forecast, by Application 2020 & 2033
- Table 43: South Korea Marine Asset Management Services Revenue (undefined) Forecast, by Application 2020 & 2033
- Table 44: ASEAN Marine Asset Management Services Revenue (undefined) Forecast, by Application 2020 & 2033
- Table 45: Oceania Marine Asset Management Services Revenue (undefined) Forecast, by Application 2020 & 2033
- Table 46: Rest of Asia Pacific Marine Asset Management Services Revenue (undefined) Forecast, by Application 2020 & 2033
Frequently Asked Questions
1. What is the projected Compound Annual Growth Rate (CAGR) of the Marine Asset Management Services?
The projected CAGR is approximately 4.4%.
2. Which companies are prominent players in the Marine Asset Management Services?
Key companies in the market include Tokio Marine Investment Management, Babcock International Group PLC, Offshore Marine Asset Management (OMAM) Pte Ltd, Fugro, Oceanic Marine Management, Marine Asset Management Inc, Northern Marine Group, Seamac Marine, SKF, Norship.
3. What are the main segments of the Marine Asset Management Services?
The market segments include Application, Types.
4. Can you provide details about the market size?
The market size is estimated to be USD XXX N/A as of 2022.
5. What are some drivers contributing to market growth?
N/A
6. What are the notable trends driving market growth?
N/A
7. Are there any restraints impacting market growth?
N/A
8. Can you provide examples of recent developments in the market?
N/A
9. What pricing options are available for accessing the report?
Pricing options include single-user, multi-user, and enterprise licenses priced at USD 2900.00, USD 4350.00, and USD 5800.00 respectively.
10. Is the market size provided in terms of value or volume?
The market size is provided in terms of value, measured in N/A.
11. Are there any specific market keywords associated with the report?
Yes, the market keyword associated with the report is "Marine Asset Management Services," which aids in identifying and referencing the specific market segment covered.
12. How do I determine which pricing option suits my needs best?
The pricing options vary based on user requirements and access needs. Individual users may opt for single-user licenses, while businesses requiring broader access may choose multi-user or enterprise licenses for cost-effective access to the report.
13. Are there any additional resources or data provided in the Marine Asset Management Services report?
While the report offers comprehensive insights, it's advisable to review the specific contents or supplementary materials provided to ascertain if additional resources or data are available.
14. How can I stay updated on further developments or reports in the Marine Asset Management Services?
To stay informed about further developments, trends, and reports in the Marine Asset Management Services, consider subscribing to industry newsletters, following relevant companies and organizations, or regularly checking reputable industry news sources and publications.
Methodology
Step 1 - Identification of Relevant Samples Size from Population Database


Step 2 - Approaches for Defining Global Market Size (Value, Volume* & Price*)

Note*: In applicable scenarios
Step 3 - Data Sources
Primary Research
- Web Analytics
- Survey Reports
- Research Institute
- Latest Research Reports
- Opinion Leaders
Secondary Research
- Annual Reports
- White Paper
- Latest Press Release
- Industry Association
- Paid Database
- Investor Presentations

Step 4 - Data Triangulation
Involves using different sources of information in order to increase the validity of a study
These sources are likely to be stakeholders in a program - participants, other researchers, program staff, other community members, and so on.
Then we put all data in single framework & apply various statistical tools to find out the dynamic on the market.
During the analysis stage, feedback from the stakeholder groups would be compared to determine areas of agreement as well as areas of divergence