

Key Insights
The global metal grain refiner market is experiencing robust growth, driven by increasing demand from the automotive, aerospace, and construction industries. These sectors require high-performance metals with enhanced properties like improved strength, ductility, and weldability, all of which are achievable through the use of grain refiners. The market's expansion is further fueled by advancements in refining technologies, leading to more efficient and cost-effective processes. While fluctuations in raw material prices and economic downturns can pose challenges, the long-term outlook remains positive, supported by consistent growth in infrastructure development and the burgeoning adoption of lightweight materials for fuel efficiency. We project a Compound Annual Growth Rate (CAGR) of approximately 6% between 2025 and 2033, resulting in a substantial market expansion over the forecast period. Major players like Norsk Hydro ASA, Rio Tinto Group, and Alcoa Corporation are actively investing in research and development to enhance their product offerings and solidify their market positions, contributing to the overall market dynamism.
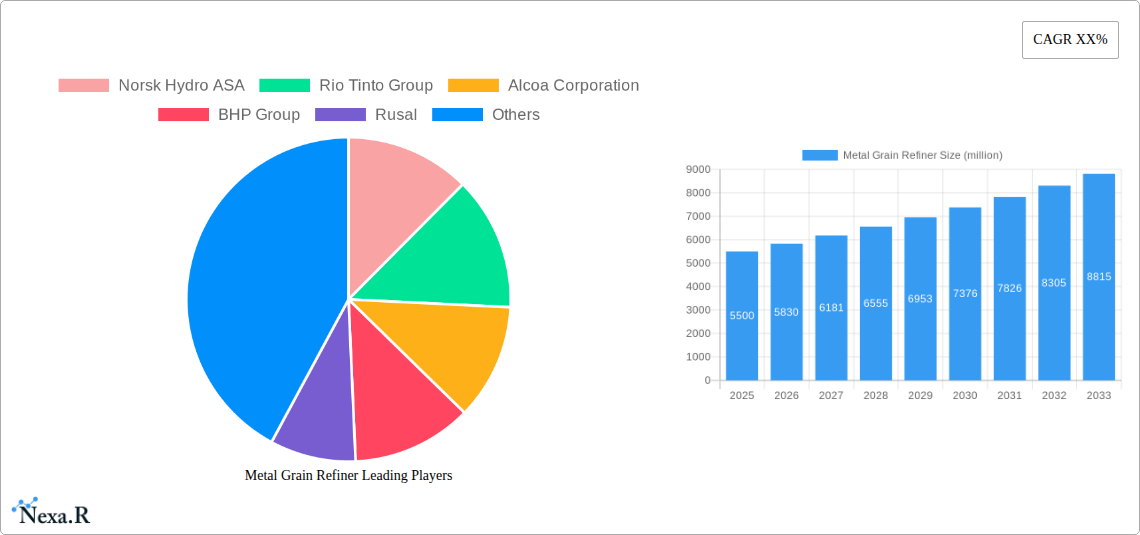
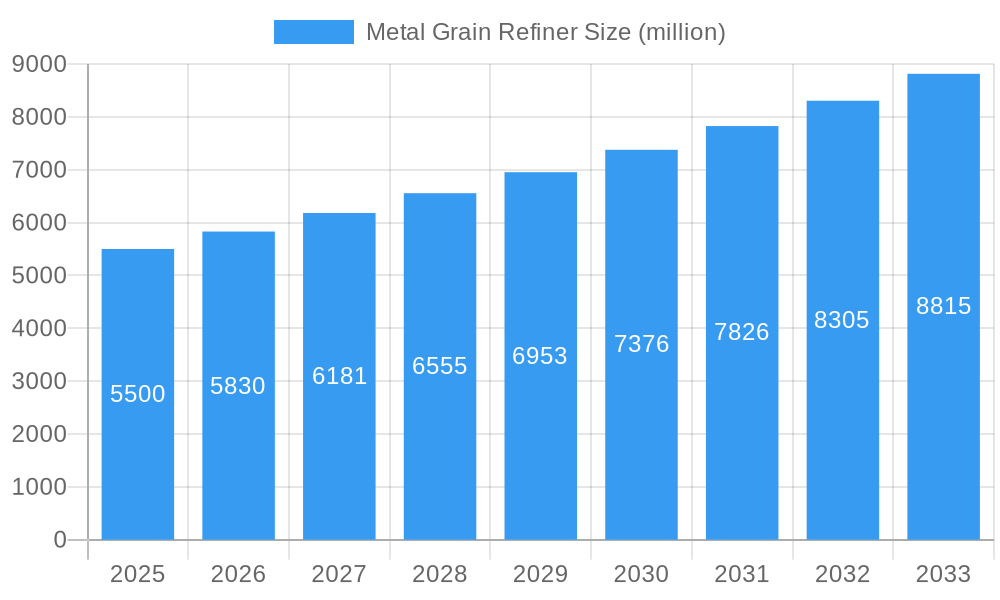
Metal Grain Refiner Market Size (In Billion)
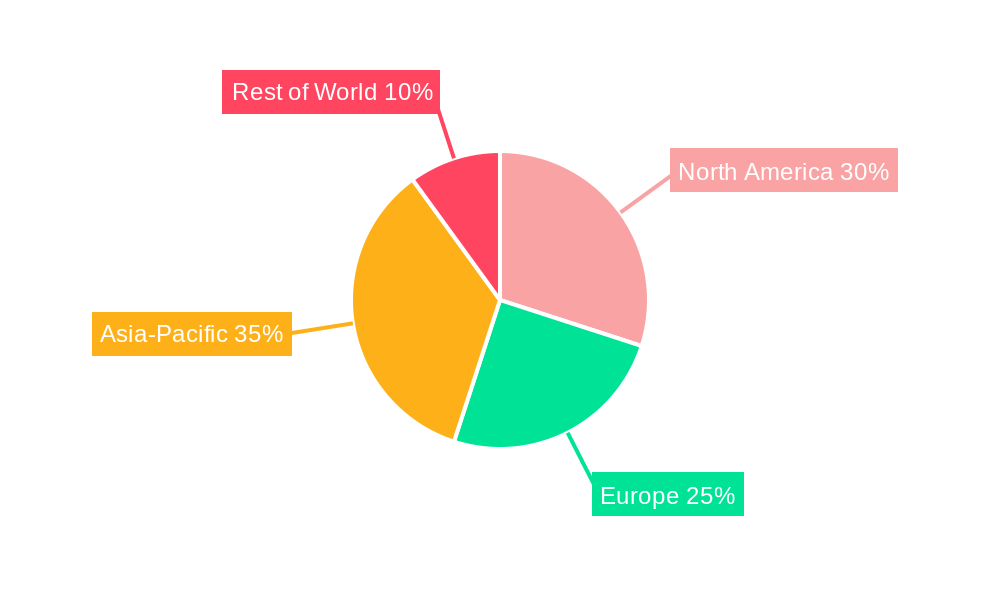
The market segmentation reveals significant opportunities across various applications and geographical regions. While precise regional data is unavailable, it’s reasonable to assume strong growth in regions with robust manufacturing and construction sectors, such as North America and Asia-Pacific. The competitive landscape is characterized by a mix of established players and emerging companies, leading to innovation and increased competition. The market is also witnessing a trend towards sustainable and environmentally friendly grain refining processes, in line with the broader focus on responsible manufacturing and reduced carbon footprints. This shift towards sustainable solutions is expected to influence both technological innovation and consumer preferences, creating further growth opportunities within the market.
Metal Grain Refiner Company Market Share
Metal Grain Refiner Market Report: 2019-2033
This comprehensive report provides an in-depth analysis of the global Metal Grain Refiner market, offering invaluable insights for industry professionals, investors, and strategic decision-makers. Spanning the period 2019-2033, with a focus on 2025, this report leverages extensive primary and secondary research to deliver a precise forecast of market dynamics and future growth potential. The report is segmented by key players, regions, and applications, providing a granular understanding of market structure and competitive landscape.
Keywords: Metal Grain Refiner, Grain Refinement, Aluminum Grain Refiner, Foundry Industry, Metal Casting, Material Science, Market Size, Market Share, Market Growth, CAGR, Norsk Hydro, Rio Tinto, Alcoa, BHP Group, Rusal, Market Analysis, Market Forecast, Industry Trends, Technological Advancements, Competitive Landscape.
Metal Grain Refiner Market Dynamics & Structure
The global Metal Grain Refiner market, valued at $XX million in 2024, exhibits a moderately consolidated structure. Key players like Norsk Hydro ASA, Rio Tinto Group, and Alcoa Corporation hold significant market share, while numerous smaller regional players contribute to the overall landscape. The market's dynamics are shaped by several factors:
- Technological Innovation: Ongoing R&D focuses on developing grain refiners with enhanced efficiency, cost-effectiveness, and environmental sustainability, leading to a steady stream of product innovations.
- Regulatory Landscape: Stringent environmental regulations, particularly concerning emissions and waste management, drive the adoption of eco-friendly grain refiners and influence manufacturing processes.
- Competitive Substitutes: While few direct substitutes exist, the market faces indirect competition from alternative casting and processing techniques aiming for improved material properties.
- End-User Demographics: The automotive, aerospace, and construction industries are major end-users, with demand largely driven by production volumes and the need for high-performance materials.
- M&A Activity: The past five years have witnessed a moderate level of mergers and acquisitions (M&A) activity (approximately XX deals), primarily focused on consolidating market share and expanding product portfolios. Larger players are strategically acquiring smaller companies with specialized technologies or regional presence. The market concentration ratio (CR4) in 2024 was approximately XX%.
Metal Grain Refiner Growth Trends & Insights
The Metal Grain Refiner market experienced robust growth during the historical period (2019-2024), exhibiting a CAGR of XX%. This growth is primarily attributed to the rising demand from the automotive and aerospace sectors, coupled with increasing investments in infrastructure projects globally. The market size is projected to reach $XX million in 2025 and further expand to $XX million by 2033, demonstrating a CAGR of XX% during the forecast period (2025-2033). Technological advancements, like the introduction of novel grain refiner formulations and improved application techniques, are driving adoption rates. Consumer behavior shifts towards lightweight yet high-strength materials are also contributing to market growth. Market penetration in developing economies remains relatively low, presenting significant untapped potential for future expansion.
Dominant Regions, Countries, or Segments in Metal Grain Refiner
The Asia-Pacific region currently dominates the Metal Grain Refiner market, accounting for approximately XX% of the global market share in 2024. This dominance is driven by several factors:
- Rapid Industrialization: Significant growth in manufacturing and construction industries in countries like China, India, and South Korea fuels substantial demand for metal grain refiners.
- Favorable Economic Policies: Government support for infrastructure development and industrial expansion has created a conducive environment for market growth.
- Expanding Automotive Sector: The booming automotive industry in the region is a primary driver, requiring large quantities of high-quality metal castings.
Other key regions include North America and Europe, each contributing approximately XX% and XX% of the market share respectively, though with slightly slower growth rates compared to Asia-Pacific. The forecast period anticipates continued dominance of Asia-Pacific, driven by sustained industrialization and infrastructural investments.
Metal Grain Refiner Product Landscape
The Metal Grain Refiner market offers a diverse range of products, categorized by chemical composition (e.g., Al-Ti-B, Al-Ti-C), grain size control effectiveness, and application suitability. Recent innovations include the development of environmentally friendly, high-efficiency grain refiners, designed to minimize waste and enhance casting properties. These new products boast superior performance metrics, including improved grain refinement, reduced porosity, and enhanced mechanical strength.
Key Drivers, Barriers & Challenges in Metal Grain Refiner
Key Drivers:
- Rising demand from the automotive and aerospace sectors for lightweight, high-strength materials.
- Growing investments in infrastructure projects globally, driving demand for metal castings.
- Technological advancements leading to improved grain refiner performance and efficiency.
Key Challenges:
- Fluctuations in raw material prices, impacting manufacturing costs.
- Stringent environmental regulations and the need for sustainable solutions.
- Intense competition among established players and the emergence of new entrants.
Emerging Opportunities in Metal Grain Refiner
Significant growth potential exists in untapped markets, particularly in developing economies. Emerging applications, such as additive manufacturing and 3D printing, are creating new demand for specialized grain refiners. Furthermore, the increasing focus on sustainable manufacturing practices presents opportunities for environmentally friendly grain refiner solutions.
Growth Accelerators in the Metal Grain Refiner Industry
Technological breakthroughs, especially in the development of next-generation grain refiner formulations, are accelerating market growth. Strategic partnerships between grain refiner producers and downstream manufacturers are fostering innovation and expanding market reach. Furthermore, market expansion strategies targeting emerging economies are playing a significant role in driving long-term growth.
Key Players Shaping the Metal Grain Refiner Market
- Norsk Hydro ASA
- Rio Tinto Group
- Alcoa Corporation
- BHP Group
- Rusal
- ECN LTD.
- Minex Metallurgical Co. Ltd.
- Zhejiang Dongliang New Material Co.,Ltd.
- Arconic
- Belmont Metals Inc.
- Micron Metals Inc.
- TOHO Zinc Co. Ltd.
- Meridian Metal Trading Ltd.
- Silicor Materials Inc.
- KBM Advanced Materials Ltd.
- Foundry Service and Supplies,Inc.
Notable Milestones in Metal Grain Refiner Sector
- 2020: Norsk Hydro ASA launched a new generation of eco-friendly grain refiner.
- 2022: Alcoa Corporation and Rio Tinto Group announced a joint venture to develop advanced grain refiner technologies.
- 2023: Several new entrants introduced innovative grain refiner formulations targeting specific niche applications.
In-Depth Metal Grain Refiner Market Outlook
The Metal Grain Refiner market is poised for continued growth, driven by sustained demand from key industries and ongoing technological innovation. Strategic partnerships and expansion into emerging markets will further fuel this expansion. The long-term outlook is positive, with significant opportunities for players who can adapt to evolving market dynamics and capitalize on emerging technologies.
Metal Grain Refiner Segmentation
-
1. Application
- 1.1. Aluminum Casting
- 1.2. Magnesium Casting
- 1.3. Titanium Casting
-
2. Types
- 2.1. Aluminum Based Grain Refiner
- 2.2. Titanium Based Grain Refiner
- 2.3. Zirconium Based Grain Refiner
- 2.4. Carbon Based Grain Refiner
Metal Grain Refiner Segmentation By Geography
-
1. North America
- 1.1. United States
- 1.2. Canada
- 1.3. Mexico
-
2. South America
- 2.1. Brazil
- 2.2. Argentina
- 2.3. Rest of South America
-
3. Europe
- 3.1. United Kingdom
- 3.2. Germany
- 3.3. France
- 3.4. Italy
- 3.5. Spain
- 3.6. Russia
- 3.7. Benelux
- 3.8. Nordics
- 3.9. Rest of Europe
-
4. Middle East & Africa
- 4.1. Turkey
- 4.2. Israel
- 4.3. GCC
- 4.4. North Africa
- 4.5. South Africa
- 4.6. Rest of Middle East & Africa
-
5. Asia Pacific
- 5.1. China
- 5.2. India
- 5.3. Japan
- 5.4. South Korea
- 5.5. ASEAN
- 5.6. Oceania
- 5.7. Rest of Asia Pacific
Metal Grain Refiner Regional Market Share
Geographic Coverage of Metal Grain Refiner
Metal Grain Refiner REPORT HIGHLIGHTS
| Aspects | Details |
|---|---|
| Study Period | 2020-2034 |
| Base Year | 2025 |
| Estimated Year | 2026 |
| Forecast Period | 2026-2034 |
| Historical Period | 2020-2025 |
| Growth Rate | CAGR of 8.2% from 2020-2034 |
| Segmentation |
|
Table of Contents
- 1. Introduction
- 1.1. Research Scope
- 1.2. Market Segmentation
- 1.3. Research Methodology
- 1.4. Definitions and Assumptions
- 2. Executive Summary
- 2.1. Introduction
- 3. Market Dynamics
- 3.1. Introduction
- 3.2. Market Drivers
- 3.3. Market Restrains
- 3.4. Market Trends
- 4. Market Factor Analysis
- 4.1. Porters Five Forces
- 4.2. Supply/Value Chain
- 4.3. PESTEL analysis
- 4.4. Market Entropy
- 4.5. Patent/Trademark Analysis
- 5. Global Metal Grain Refiner Analysis, Insights and Forecast, 2020-2032
- 5.1. Market Analysis, Insights and Forecast - by Application
- 5.1.1. Aluminum Casting
- 5.1.2. Magnesium Casting
- 5.1.3. Titanium Casting
- 5.2. Market Analysis, Insights and Forecast - by Types
- 5.2.1. Aluminum Based Grain Refiner
- 5.2.2. Titanium Based Grain Refiner
- 5.2.3. Zirconium Based Grain Refiner
- 5.2.4. Carbon Based Grain Refiner
- 5.3. Market Analysis, Insights and Forecast - by Region
- 5.3.1. North America
- 5.3.2. South America
- 5.3.3. Europe
- 5.3.4. Middle East & Africa
- 5.3.5. Asia Pacific
- 5.1. Market Analysis, Insights and Forecast - by Application
- 6. North America Metal Grain Refiner Analysis, Insights and Forecast, 2020-2032
- 6.1. Market Analysis, Insights and Forecast - by Application
- 6.1.1. Aluminum Casting
- 6.1.2. Magnesium Casting
- 6.1.3. Titanium Casting
- 6.2. Market Analysis, Insights and Forecast - by Types
- 6.2.1. Aluminum Based Grain Refiner
- 6.2.2. Titanium Based Grain Refiner
- 6.2.3. Zirconium Based Grain Refiner
- 6.2.4. Carbon Based Grain Refiner
- 6.1. Market Analysis, Insights and Forecast - by Application
- 7. South America Metal Grain Refiner Analysis, Insights and Forecast, 2020-2032
- 7.1. Market Analysis, Insights and Forecast - by Application
- 7.1.1. Aluminum Casting
- 7.1.2. Magnesium Casting
- 7.1.3. Titanium Casting
- 7.2. Market Analysis, Insights and Forecast - by Types
- 7.2.1. Aluminum Based Grain Refiner
- 7.2.2. Titanium Based Grain Refiner
- 7.2.3. Zirconium Based Grain Refiner
- 7.2.4. Carbon Based Grain Refiner
- 7.1. Market Analysis, Insights and Forecast - by Application
- 8. Europe Metal Grain Refiner Analysis, Insights and Forecast, 2020-2032
- 8.1. Market Analysis, Insights and Forecast - by Application
- 8.1.1. Aluminum Casting
- 8.1.2. Magnesium Casting
- 8.1.3. Titanium Casting
- 8.2. Market Analysis, Insights and Forecast - by Types
- 8.2.1. Aluminum Based Grain Refiner
- 8.2.2. Titanium Based Grain Refiner
- 8.2.3. Zirconium Based Grain Refiner
- 8.2.4. Carbon Based Grain Refiner
- 8.1. Market Analysis, Insights and Forecast - by Application
- 9. Middle East & Africa Metal Grain Refiner Analysis, Insights and Forecast, 2020-2032
- 9.1. Market Analysis, Insights and Forecast - by Application
- 9.1.1. Aluminum Casting
- 9.1.2. Magnesium Casting
- 9.1.3. Titanium Casting
- 9.2. Market Analysis, Insights and Forecast - by Types
- 9.2.1. Aluminum Based Grain Refiner
- 9.2.2. Titanium Based Grain Refiner
- 9.2.3. Zirconium Based Grain Refiner
- 9.2.4. Carbon Based Grain Refiner
- 9.1. Market Analysis, Insights and Forecast - by Application
- 10. Asia Pacific Metal Grain Refiner Analysis, Insights and Forecast, 2020-2032
- 10.1. Market Analysis, Insights and Forecast - by Application
- 10.1.1. Aluminum Casting
- 10.1.2. Magnesium Casting
- 10.1.3. Titanium Casting
- 10.2. Market Analysis, Insights and Forecast - by Types
- 10.2.1. Aluminum Based Grain Refiner
- 10.2.2. Titanium Based Grain Refiner
- 10.2.3. Zirconium Based Grain Refiner
- 10.2.4. Carbon Based Grain Refiner
- 10.1. Market Analysis, Insights and Forecast - by Application
- 11. Competitive Analysis
- 11.1. Global Market Share Analysis 2025
- 11.2. Company Profiles
- 11.2.1 Norsk Hydro ASA
- 11.2.1.1. Overview
- 11.2.1.2. Products
- 11.2.1.3. SWOT Analysis
- 11.2.1.4. Recent Developments
- 11.2.1.5. Financials (Based on Availability)
- 11.2.2 Rio Tinto Group
- 11.2.2.1. Overview
- 11.2.2.2. Products
- 11.2.2.3. SWOT Analysis
- 11.2.2.4. Recent Developments
- 11.2.2.5. Financials (Based on Availability)
- 11.2.3 Alcoa Corporation
- 11.2.3.1. Overview
- 11.2.3.2. Products
- 11.2.3.3. SWOT Analysis
- 11.2.3.4. Recent Developments
- 11.2.3.5. Financials (Based on Availability)
- 11.2.4 BHP Group
- 11.2.4.1. Overview
- 11.2.4.2. Products
- 11.2.4.3. SWOT Analysis
- 11.2.4.4. Recent Developments
- 11.2.4.5. Financials (Based on Availability)
- 11.2.5 Rusal
- 11.2.5.1. Overview
- 11.2.5.2. Products
- 11.2.5.3. SWOT Analysis
- 11.2.5.4. Recent Developments
- 11.2.5.5. Financials (Based on Availability)
- 11.2.6 ECN LTD.
- 11.2.6.1. Overview
- 11.2.6.2. Products
- 11.2.6.3. SWOT Analysis
- 11.2.6.4. Recent Developments
- 11.2.6.5. Financials (Based on Availability)
- 11.2.7 Minex Metallurgical Co. Ltd.
- 11.2.7.1. Overview
- 11.2.7.2. Products
- 11.2.7.3. SWOT Analysis
- 11.2.7.4. Recent Developments
- 11.2.7.5. Financials (Based on Availability)
- 11.2.8 Zhejiang Dongliang New Material Co.
- 11.2.8.1. Overview
- 11.2.8.2. Products
- 11.2.8.3. SWOT Analysis
- 11.2.8.4. Recent Developments
- 11.2.8.5. Financials (Based on Availability)
- 11.2.9 Ltd.
- 11.2.9.1. Overview
- 11.2.9.2. Products
- 11.2.9.3. SWOT Analysis
- 11.2.9.4. Recent Developments
- 11.2.9.5. Financials (Based on Availability)
- 11.2.10 Arconic
- 11.2.10.1. Overview
- 11.2.10.2. Products
- 11.2.10.3. SWOT Analysis
- 11.2.10.4. Recent Developments
- 11.2.10.5. Financials (Based on Availability)
- 11.2.11 Belmont Metals Inc.
- 11.2.11.1. Overview
- 11.2.11.2. Products
- 11.2.11.3. SWOT Analysis
- 11.2.11.4. Recent Developments
- 11.2.11.5. Financials (Based on Availability)
- 11.2.12 Micron Metals Inc.
- 11.2.12.1. Overview
- 11.2.12.2. Products
- 11.2.12.3. SWOT Analysis
- 11.2.12.4. Recent Developments
- 11.2.12.5. Financials (Based on Availability)
- 11.2.13 TOHO Zinc Co. Ltd.
- 11.2.13.1. Overview
- 11.2.13.2. Products
- 11.2.13.3. SWOT Analysis
- 11.2.13.4. Recent Developments
- 11.2.13.5. Financials (Based on Availability)
- 11.2.14 Meridian Metal Trading Ltd.
- 11.2.14.1. Overview
- 11.2.14.2. Products
- 11.2.14.3. SWOT Analysis
- 11.2.14.4. Recent Developments
- 11.2.14.5. Financials (Based on Availability)
- 11.2.15 Silicor Materials Inc.
- 11.2.15.1. Overview
- 11.2.15.2. Products
- 11.2.15.3. SWOT Analysis
- 11.2.15.4. Recent Developments
- 11.2.15.5. Financials (Based on Availability)
- 11.2.16 KBM Advanced Materials Ltd.
- 11.2.16.1. Overview
- 11.2.16.2. Products
- 11.2.16.3. SWOT Analysis
- 11.2.16.4. Recent Developments
- 11.2.16.5. Financials (Based on Availability)
- 11.2.17 Foundry Service and Supplies
- 11.2.17.1. Overview
- 11.2.17.2. Products
- 11.2.17.3. SWOT Analysis
- 11.2.17.4. Recent Developments
- 11.2.17.5. Financials (Based on Availability)
- 11.2.18 Inc.
- 11.2.18.1. Overview
- 11.2.18.2. Products
- 11.2.18.3. SWOT Analysis
- 11.2.18.4. Recent Developments
- 11.2.18.5. Financials (Based on Availability)
- 11.2.1 Norsk Hydro ASA
List of Figures
- Figure 1: Global Metal Grain Refiner Revenue Breakdown (undefined, %) by Region 2025 & 2033
- Figure 2: Global Metal Grain Refiner Volume Breakdown (K, %) by Region 2025 & 2033
- Figure 3: North America Metal Grain Refiner Revenue (undefined), by Application 2025 & 2033
- Figure 4: North America Metal Grain Refiner Volume (K), by Application 2025 & 2033
- Figure 5: North America Metal Grain Refiner Revenue Share (%), by Application 2025 & 2033
- Figure 6: North America Metal Grain Refiner Volume Share (%), by Application 2025 & 2033
- Figure 7: North America Metal Grain Refiner Revenue (undefined), by Types 2025 & 2033
- Figure 8: North America Metal Grain Refiner Volume (K), by Types 2025 & 2033
- Figure 9: North America Metal Grain Refiner Revenue Share (%), by Types 2025 & 2033
- Figure 10: North America Metal Grain Refiner Volume Share (%), by Types 2025 & 2033
- Figure 11: North America Metal Grain Refiner Revenue (undefined), by Country 2025 & 2033
- Figure 12: North America Metal Grain Refiner Volume (K), by Country 2025 & 2033
- Figure 13: North America Metal Grain Refiner Revenue Share (%), by Country 2025 & 2033
- Figure 14: North America Metal Grain Refiner Volume Share (%), by Country 2025 & 2033
- Figure 15: South America Metal Grain Refiner Revenue (undefined), by Application 2025 & 2033
- Figure 16: South America Metal Grain Refiner Volume (K), by Application 2025 & 2033
- Figure 17: South America Metal Grain Refiner Revenue Share (%), by Application 2025 & 2033
- Figure 18: South America Metal Grain Refiner Volume Share (%), by Application 2025 & 2033
- Figure 19: South America Metal Grain Refiner Revenue (undefined), by Types 2025 & 2033
- Figure 20: South America Metal Grain Refiner Volume (K), by Types 2025 & 2033
- Figure 21: South America Metal Grain Refiner Revenue Share (%), by Types 2025 & 2033
- Figure 22: South America Metal Grain Refiner Volume Share (%), by Types 2025 & 2033
- Figure 23: South America Metal Grain Refiner Revenue (undefined), by Country 2025 & 2033
- Figure 24: South America Metal Grain Refiner Volume (K), by Country 2025 & 2033
- Figure 25: South America Metal Grain Refiner Revenue Share (%), by Country 2025 & 2033
- Figure 26: South America Metal Grain Refiner Volume Share (%), by Country 2025 & 2033
- Figure 27: Europe Metal Grain Refiner Revenue (undefined), by Application 2025 & 2033
- Figure 28: Europe Metal Grain Refiner Volume (K), by Application 2025 & 2033
- Figure 29: Europe Metal Grain Refiner Revenue Share (%), by Application 2025 & 2033
- Figure 30: Europe Metal Grain Refiner Volume Share (%), by Application 2025 & 2033
- Figure 31: Europe Metal Grain Refiner Revenue (undefined), by Types 2025 & 2033
- Figure 32: Europe Metal Grain Refiner Volume (K), by Types 2025 & 2033
- Figure 33: Europe Metal Grain Refiner Revenue Share (%), by Types 2025 & 2033
- Figure 34: Europe Metal Grain Refiner Volume Share (%), by Types 2025 & 2033
- Figure 35: Europe Metal Grain Refiner Revenue (undefined), by Country 2025 & 2033
- Figure 36: Europe Metal Grain Refiner Volume (K), by Country 2025 & 2033
- Figure 37: Europe Metal Grain Refiner Revenue Share (%), by Country 2025 & 2033
- Figure 38: Europe Metal Grain Refiner Volume Share (%), by Country 2025 & 2033
- Figure 39: Middle East & Africa Metal Grain Refiner Revenue (undefined), by Application 2025 & 2033
- Figure 40: Middle East & Africa Metal Grain Refiner Volume (K), by Application 2025 & 2033
- Figure 41: Middle East & Africa Metal Grain Refiner Revenue Share (%), by Application 2025 & 2033
- Figure 42: Middle East & Africa Metal Grain Refiner Volume Share (%), by Application 2025 & 2033
- Figure 43: Middle East & Africa Metal Grain Refiner Revenue (undefined), by Types 2025 & 2033
- Figure 44: Middle East & Africa Metal Grain Refiner Volume (K), by Types 2025 & 2033
- Figure 45: Middle East & Africa Metal Grain Refiner Revenue Share (%), by Types 2025 & 2033
- Figure 46: Middle East & Africa Metal Grain Refiner Volume Share (%), by Types 2025 & 2033
- Figure 47: Middle East & Africa Metal Grain Refiner Revenue (undefined), by Country 2025 & 2033
- Figure 48: Middle East & Africa Metal Grain Refiner Volume (K), by Country 2025 & 2033
- Figure 49: Middle East & Africa Metal Grain Refiner Revenue Share (%), by Country 2025 & 2033
- Figure 50: Middle East & Africa Metal Grain Refiner Volume Share (%), by Country 2025 & 2033
- Figure 51: Asia Pacific Metal Grain Refiner Revenue (undefined), by Application 2025 & 2033
- Figure 52: Asia Pacific Metal Grain Refiner Volume (K), by Application 2025 & 2033
- Figure 53: Asia Pacific Metal Grain Refiner Revenue Share (%), by Application 2025 & 2033
- Figure 54: Asia Pacific Metal Grain Refiner Volume Share (%), by Application 2025 & 2033
- Figure 55: Asia Pacific Metal Grain Refiner Revenue (undefined), by Types 2025 & 2033
- Figure 56: Asia Pacific Metal Grain Refiner Volume (K), by Types 2025 & 2033
- Figure 57: Asia Pacific Metal Grain Refiner Revenue Share (%), by Types 2025 & 2033
- Figure 58: Asia Pacific Metal Grain Refiner Volume Share (%), by Types 2025 & 2033
- Figure 59: Asia Pacific Metal Grain Refiner Revenue (undefined), by Country 2025 & 2033
- Figure 60: Asia Pacific Metal Grain Refiner Volume (K), by Country 2025 & 2033
- Figure 61: Asia Pacific Metal Grain Refiner Revenue Share (%), by Country 2025 & 2033
- Figure 62: Asia Pacific Metal Grain Refiner Volume Share (%), by Country 2025 & 2033
List of Tables
- Table 1: Global Metal Grain Refiner Revenue undefined Forecast, by Application 2020 & 2033
- Table 2: Global Metal Grain Refiner Volume K Forecast, by Application 2020 & 2033
- Table 3: Global Metal Grain Refiner Revenue undefined Forecast, by Types 2020 & 2033
- Table 4: Global Metal Grain Refiner Volume K Forecast, by Types 2020 & 2033
- Table 5: Global Metal Grain Refiner Revenue undefined Forecast, by Region 2020 & 2033
- Table 6: Global Metal Grain Refiner Volume K Forecast, by Region 2020 & 2033
- Table 7: Global Metal Grain Refiner Revenue undefined Forecast, by Application 2020 & 2033
- Table 8: Global Metal Grain Refiner Volume K Forecast, by Application 2020 & 2033
- Table 9: Global Metal Grain Refiner Revenue undefined Forecast, by Types 2020 & 2033
- Table 10: Global Metal Grain Refiner Volume K Forecast, by Types 2020 & 2033
- Table 11: Global Metal Grain Refiner Revenue undefined Forecast, by Country 2020 & 2033
- Table 12: Global Metal Grain Refiner Volume K Forecast, by Country 2020 & 2033
- Table 13: United States Metal Grain Refiner Revenue (undefined) Forecast, by Application 2020 & 2033
- Table 14: United States Metal Grain Refiner Volume (K) Forecast, by Application 2020 & 2033
- Table 15: Canada Metal Grain Refiner Revenue (undefined) Forecast, by Application 2020 & 2033
- Table 16: Canada Metal Grain Refiner Volume (K) Forecast, by Application 2020 & 2033
- Table 17: Mexico Metal Grain Refiner Revenue (undefined) Forecast, by Application 2020 & 2033
- Table 18: Mexico Metal Grain Refiner Volume (K) Forecast, by Application 2020 & 2033
- Table 19: Global Metal Grain Refiner Revenue undefined Forecast, by Application 2020 & 2033
- Table 20: Global Metal Grain Refiner Volume K Forecast, by Application 2020 & 2033
- Table 21: Global Metal Grain Refiner Revenue undefined Forecast, by Types 2020 & 2033
- Table 22: Global Metal Grain Refiner Volume K Forecast, by Types 2020 & 2033
- Table 23: Global Metal Grain Refiner Revenue undefined Forecast, by Country 2020 & 2033
- Table 24: Global Metal Grain Refiner Volume K Forecast, by Country 2020 & 2033
- Table 25: Brazil Metal Grain Refiner Revenue (undefined) Forecast, by Application 2020 & 2033
- Table 26: Brazil Metal Grain Refiner Volume (K) Forecast, by Application 2020 & 2033
- Table 27: Argentina Metal Grain Refiner Revenue (undefined) Forecast, by Application 2020 & 2033
- Table 28: Argentina Metal Grain Refiner Volume (K) Forecast, by Application 2020 & 2033
- Table 29: Rest of South America Metal Grain Refiner Revenue (undefined) Forecast, by Application 2020 & 2033
- Table 30: Rest of South America Metal Grain Refiner Volume (K) Forecast, by Application 2020 & 2033
- Table 31: Global Metal Grain Refiner Revenue undefined Forecast, by Application 2020 & 2033
- Table 32: Global Metal Grain Refiner Volume K Forecast, by Application 2020 & 2033
- Table 33: Global Metal Grain Refiner Revenue undefined Forecast, by Types 2020 & 2033
- Table 34: Global Metal Grain Refiner Volume K Forecast, by Types 2020 & 2033
- Table 35: Global Metal Grain Refiner Revenue undefined Forecast, by Country 2020 & 2033
- Table 36: Global Metal Grain Refiner Volume K Forecast, by Country 2020 & 2033
- Table 37: United Kingdom Metal Grain Refiner Revenue (undefined) Forecast, by Application 2020 & 2033
- Table 38: United Kingdom Metal Grain Refiner Volume (K) Forecast, by Application 2020 & 2033
- Table 39: Germany Metal Grain Refiner Revenue (undefined) Forecast, by Application 2020 & 2033
- Table 40: Germany Metal Grain Refiner Volume (K) Forecast, by Application 2020 & 2033
- Table 41: France Metal Grain Refiner Revenue (undefined) Forecast, by Application 2020 & 2033
- Table 42: France Metal Grain Refiner Volume (K) Forecast, by Application 2020 & 2033
- Table 43: Italy Metal Grain Refiner Revenue (undefined) Forecast, by Application 2020 & 2033
- Table 44: Italy Metal Grain Refiner Volume (K) Forecast, by Application 2020 & 2033
- Table 45: Spain Metal Grain Refiner Revenue (undefined) Forecast, by Application 2020 & 2033
- Table 46: Spain Metal Grain Refiner Volume (K) Forecast, by Application 2020 & 2033
- Table 47: Russia Metal Grain Refiner Revenue (undefined) Forecast, by Application 2020 & 2033
- Table 48: Russia Metal Grain Refiner Volume (K) Forecast, by Application 2020 & 2033
- Table 49: Benelux Metal Grain Refiner Revenue (undefined) Forecast, by Application 2020 & 2033
- Table 50: Benelux Metal Grain Refiner Volume (K) Forecast, by Application 2020 & 2033
- Table 51: Nordics Metal Grain Refiner Revenue (undefined) Forecast, by Application 2020 & 2033
- Table 52: Nordics Metal Grain Refiner Volume (K) Forecast, by Application 2020 & 2033
- Table 53: Rest of Europe Metal Grain Refiner Revenue (undefined) Forecast, by Application 2020 & 2033
- Table 54: Rest of Europe Metal Grain Refiner Volume (K) Forecast, by Application 2020 & 2033
- Table 55: Global Metal Grain Refiner Revenue undefined Forecast, by Application 2020 & 2033
- Table 56: Global Metal Grain Refiner Volume K Forecast, by Application 2020 & 2033
- Table 57: Global Metal Grain Refiner Revenue undefined Forecast, by Types 2020 & 2033
- Table 58: Global Metal Grain Refiner Volume K Forecast, by Types 2020 & 2033
- Table 59: Global Metal Grain Refiner Revenue undefined Forecast, by Country 2020 & 2033
- Table 60: Global Metal Grain Refiner Volume K Forecast, by Country 2020 & 2033
- Table 61: Turkey Metal Grain Refiner Revenue (undefined) Forecast, by Application 2020 & 2033
- Table 62: Turkey Metal Grain Refiner Volume (K) Forecast, by Application 2020 & 2033
- Table 63: Israel Metal Grain Refiner Revenue (undefined) Forecast, by Application 2020 & 2033
- Table 64: Israel Metal Grain Refiner Volume (K) Forecast, by Application 2020 & 2033
- Table 65: GCC Metal Grain Refiner Revenue (undefined) Forecast, by Application 2020 & 2033
- Table 66: GCC Metal Grain Refiner Volume (K) Forecast, by Application 2020 & 2033
- Table 67: North Africa Metal Grain Refiner Revenue (undefined) Forecast, by Application 2020 & 2033
- Table 68: North Africa Metal Grain Refiner Volume (K) Forecast, by Application 2020 & 2033
- Table 69: South Africa Metal Grain Refiner Revenue (undefined) Forecast, by Application 2020 & 2033
- Table 70: South Africa Metal Grain Refiner Volume (K) Forecast, by Application 2020 & 2033
- Table 71: Rest of Middle East & Africa Metal Grain Refiner Revenue (undefined) Forecast, by Application 2020 & 2033
- Table 72: Rest of Middle East & Africa Metal Grain Refiner Volume (K) Forecast, by Application 2020 & 2033
- Table 73: Global Metal Grain Refiner Revenue undefined Forecast, by Application 2020 & 2033
- Table 74: Global Metal Grain Refiner Volume K Forecast, by Application 2020 & 2033
- Table 75: Global Metal Grain Refiner Revenue undefined Forecast, by Types 2020 & 2033
- Table 76: Global Metal Grain Refiner Volume K Forecast, by Types 2020 & 2033
- Table 77: Global Metal Grain Refiner Revenue undefined Forecast, by Country 2020 & 2033
- Table 78: Global Metal Grain Refiner Volume K Forecast, by Country 2020 & 2033
- Table 79: China Metal Grain Refiner Revenue (undefined) Forecast, by Application 2020 & 2033
- Table 80: China Metal Grain Refiner Volume (K) Forecast, by Application 2020 & 2033
- Table 81: India Metal Grain Refiner Revenue (undefined) Forecast, by Application 2020 & 2033
- Table 82: India Metal Grain Refiner Volume (K) Forecast, by Application 2020 & 2033
- Table 83: Japan Metal Grain Refiner Revenue (undefined) Forecast, by Application 2020 & 2033
- Table 84: Japan Metal Grain Refiner Volume (K) Forecast, by Application 2020 & 2033
- Table 85: South Korea Metal Grain Refiner Revenue (undefined) Forecast, by Application 2020 & 2033
- Table 86: South Korea Metal Grain Refiner Volume (K) Forecast, by Application 2020 & 2033
- Table 87: ASEAN Metal Grain Refiner Revenue (undefined) Forecast, by Application 2020 & 2033
- Table 88: ASEAN Metal Grain Refiner Volume (K) Forecast, by Application 2020 & 2033
- Table 89: Oceania Metal Grain Refiner Revenue (undefined) Forecast, by Application 2020 & 2033
- Table 90: Oceania Metal Grain Refiner Volume (K) Forecast, by Application 2020 & 2033
- Table 91: Rest of Asia Pacific Metal Grain Refiner Revenue (undefined) Forecast, by Application 2020 & 2033
- Table 92: Rest of Asia Pacific Metal Grain Refiner Volume (K) Forecast, by Application 2020 & 2033
Frequently Asked Questions
1. What is the projected Compound Annual Growth Rate (CAGR) of the Metal Grain Refiner?
The projected CAGR is approximately 8.2%.
2. Which companies are prominent players in the Metal Grain Refiner?
Key companies in the market include Norsk Hydro ASA, Rio Tinto Group, Alcoa Corporation, BHP Group, Rusal, ECN LTD., Minex Metallurgical Co. Ltd., Zhejiang Dongliang New Material Co., Ltd., Arconic, Belmont Metals Inc., Micron Metals Inc., TOHO Zinc Co. Ltd., Meridian Metal Trading Ltd., Silicor Materials Inc., KBM Advanced Materials Ltd., Foundry Service and Supplies, Inc..
3. What are the main segments of the Metal Grain Refiner?
The market segments include Application, Types.
4. Can you provide details about the market size?
The market size is estimated to be USD XXX N/A as of 2022.
5. What are some drivers contributing to market growth?
N/A
6. What are the notable trends driving market growth?
N/A
7. Are there any restraints impacting market growth?
N/A
8. Can you provide examples of recent developments in the market?
N/A
9. What pricing options are available for accessing the report?
Pricing options include single-user, multi-user, and enterprise licenses priced at USD 3950.00, USD 5925.00, and USD 7900.00 respectively.
10. Is the market size provided in terms of value or volume?
The market size is provided in terms of value, measured in N/A and volume, measured in K.
11. Are there any specific market keywords associated with the report?
Yes, the market keyword associated with the report is "Metal Grain Refiner," which aids in identifying and referencing the specific market segment covered.
12. How do I determine which pricing option suits my needs best?
The pricing options vary based on user requirements and access needs. Individual users may opt for single-user licenses, while businesses requiring broader access may choose multi-user or enterprise licenses for cost-effective access to the report.
13. Are there any additional resources or data provided in the Metal Grain Refiner report?
While the report offers comprehensive insights, it's advisable to review the specific contents or supplementary materials provided to ascertain if additional resources or data are available.
14. How can I stay updated on further developments or reports in the Metal Grain Refiner?
To stay informed about further developments, trends, and reports in the Metal Grain Refiner, consider subscribing to industry newsletters, following relevant companies and organizations, or regularly checking reputable industry news sources and publications.
Methodology
Step 1 - Identification of Relevant Samples Size from Population Database


Step 2 - Approaches for Defining Global Market Size (Value, Volume* & Price*)

Note*: In applicable scenarios
Step 3 - Data Sources
Primary Research
- Web Analytics
- Survey Reports
- Research Institute
- Latest Research Reports
- Opinion Leaders
Secondary Research
- Annual Reports
- White Paper
- Latest Press Release
- Industry Association
- Paid Database
- Investor Presentations

Step 4 - Data Triangulation
Involves using different sources of information in order to increase the validity of a study
These sources are likely to be stakeholders in a program - participants, other researchers, program staff, other community members, and so on.
Then we put all data in single framework & apply various statistical tools to find out the dynamic on the market.
During the analysis stage, feedback from the stakeholder groups would be compared to determine areas of agreement as well as areas of divergence