

Key Insights
The MNT Display Driver IC market is poised for robust expansion, projected to reach $9467.18 million in 2025 and grow at a Compound Annual Growth Rate (CAGR) of 6.6% through 2033. This significant growth is propelled by the escalating demand for high-resolution and immersive display technologies across various monitor applications. The increasing adoption of FHD, QHD, and UHD panels in consumer electronics, professional workstations, and gaming setups is a primary driver. Furthermore, advancements in display technology, leading to larger screen sizes and higher refresh rates, necessitate sophisticated driver ICs capable of managing more complex display signals. The evolution of multi-channel driver ICs, particularly the 8, 16, and 32-channel variants, is crucial for enabling these enhanced visual experiences. As consumers and professionals alike prioritize superior visual fidelity and performance, the market for advanced MNT Display Driver ICs is set to experience sustained upward momentum.
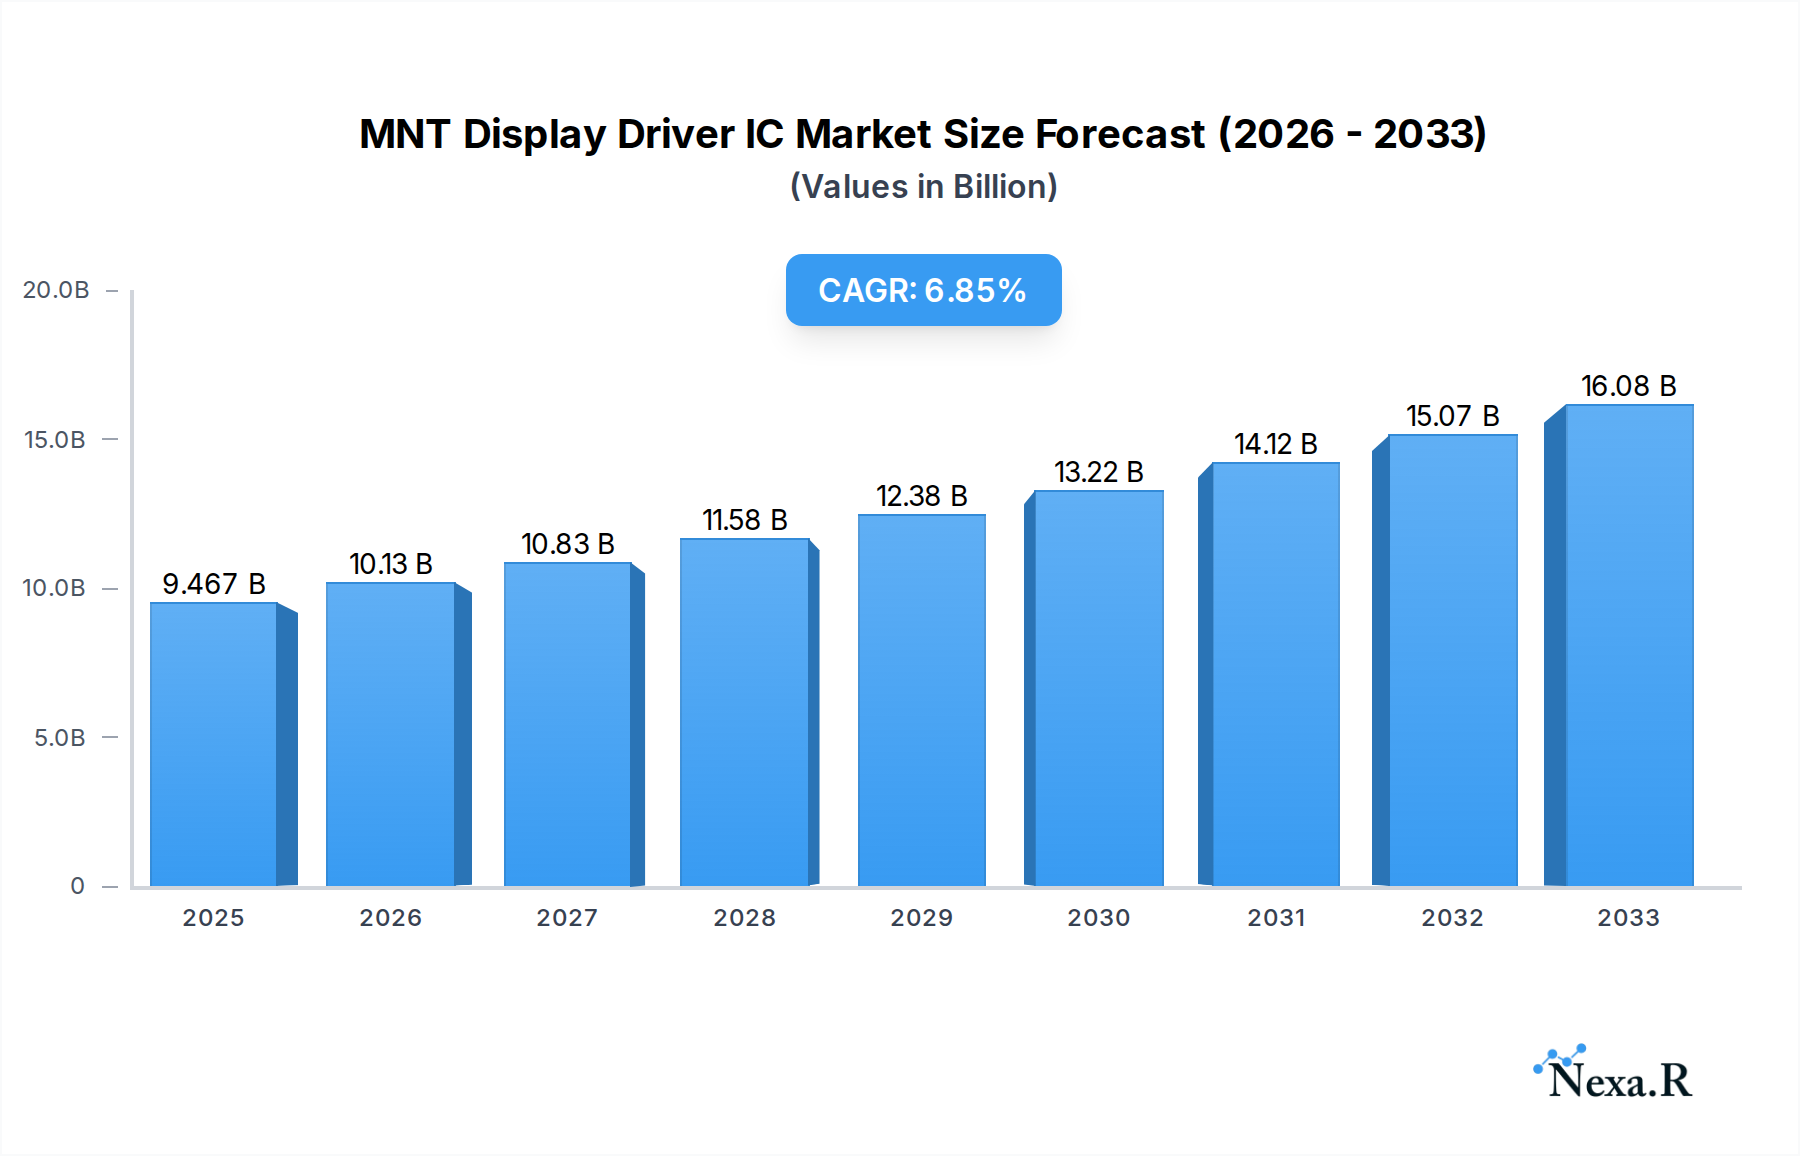
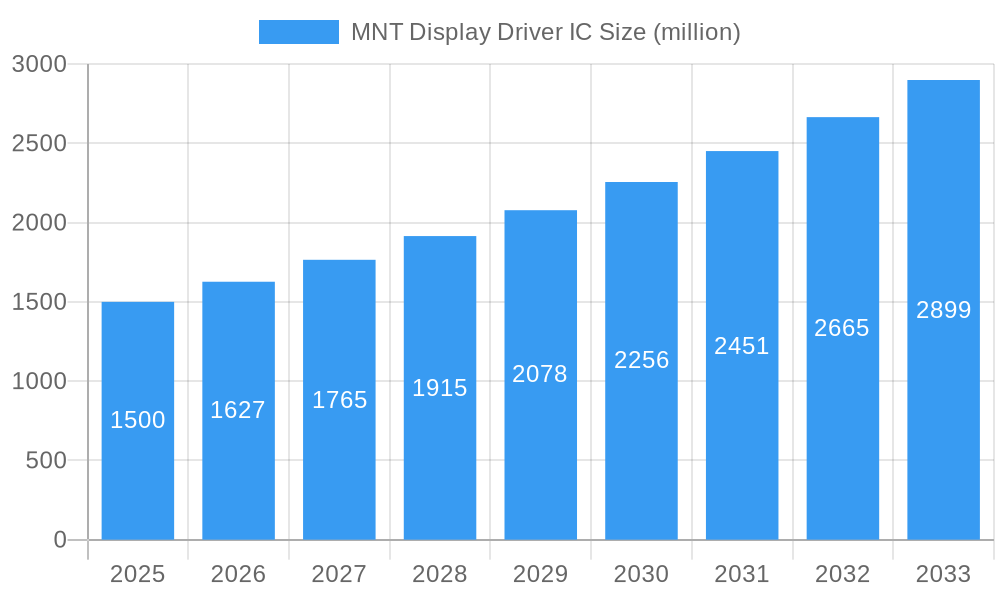
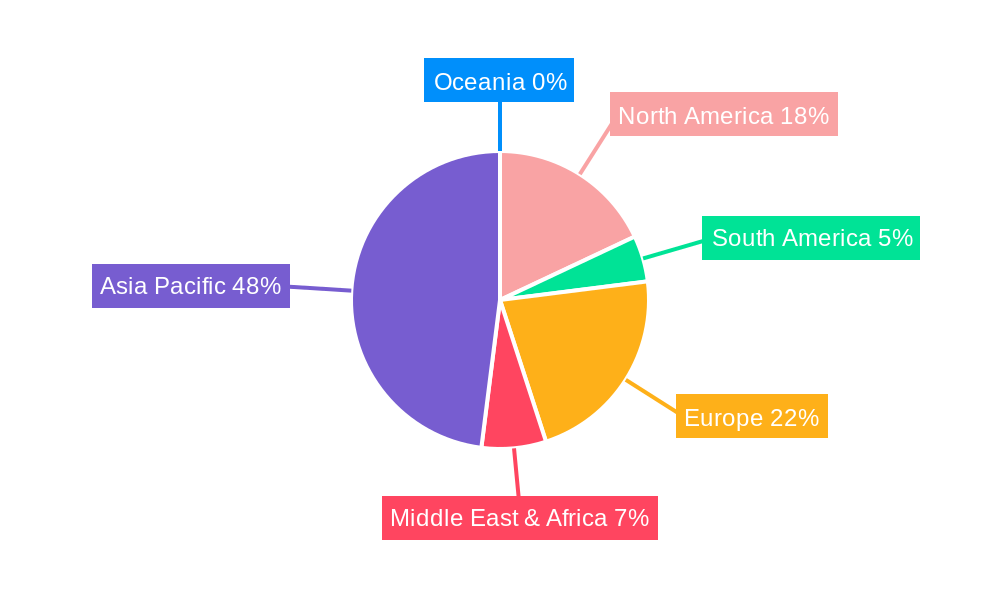
MNT Display Driver IC Market Size (In Billion)
The market's trajectory is further influenced by key trends such as the miniaturization of components, increased power efficiency, and the integration of advanced features like adaptive sync technologies. These developments are pushing manufacturers to innovate and deliver more compact, energy-conscious, and performance-optimized driver ICs. While the market benefits from strong demand, potential restraints may include supply chain disruptions for essential components, fluctuating raw material costs, and the intense competition among established players like LX Semicon, Himax Technologies, Inc., and Novatek Microelectronics Corp. Geographically, Asia Pacific is expected to lead the market due to its strong manufacturing base and high consumer demand for electronic devices. North America and Europe also represent significant markets, driven by their advanced technological infrastructure and early adoption of premium display solutions. The continuous innovation and strategic partnerships among key companies will be instrumental in navigating these dynamics and capitalizing on future growth opportunities.
MNT Display Driver IC Company Market Share
MNT Display Driver IC Market Dynamics & Structure
The MNT (Monitor) Display Driver IC market is characterized by a moderate to high concentration, with key players like LX Semicon, Himax Technologies, Inc., Raydium Semiconductor Corporation, DB HiTek, Novatek Microelectronics Corp, Fitipower, ESWIN, and Chipone Technology driving innovation and market share. Technological advancements, particularly in resolution enhancement and power efficiency, act as significant innovation drivers. The increasing demand for higher resolution panels, including QHD and UHD, fuels research and development in advanced driver IC architectures. Regulatory frameworks, though less prominent than in some other semiconductor sectors, often pertain to environmental compliance and power consumption standards. Competitive product substitutes are limited, with the primary competition arising from incremental improvements within existing driver IC technologies and alternative display technologies that may reduce the reliance on traditional monitor displays. End-user demographics are shifting towards consumers and enterprises demanding more immersive and detailed visual experiences, pushing for higher refresh rates and improved color accuracy. Mergers and acquisitions (M&A) trends are moderate, focusing on consolidating expertise in specific chip technologies or expanding geographic reach. For instance, a recent acquisition might have boosted a company's capabilities in advanced packaging for higher-density driver ICs.
- Market Concentration: Moderate to High, dominated by established semiconductor manufacturers.
- Technological Innovation Drivers: Resolution enhancement (QHD, UHD), power efficiency, higher refresh rates, advanced panel technologies (e.g., Mini-LED, OLED integration).
- Regulatory Frameworks: Emerging focus on energy efficiency standards and environmental impact.
- Competitive Product Substitutes: Limited direct substitutes; competition primarily through incremental technology upgrades within driver ICs.
- End-User Demographics: Growing demand from professional users, content creators, gamers, and businesses requiring high-fidelity displays.
- M&A Trends: Moderate, with strategic acquisitions aimed at technology integration and market expansion.
MNT Display Driver IC Growth Trends & Insights
The MNT Display Driver IC market is poised for substantial growth over the forecast period (2025-2033), driven by an escalating demand for higher-resolution and more immersive monitor displays. The market size, estimated to be $XX million units in 2025, is projected to experience a Compound Annual Growth Rate (CAGR) of XX% during the study period, reaching an estimated $XX million units by 2033. This growth trajectory is significantly influenced by the increasing adoption of QHD and UHD panels across consumer and professional segments. The transition from FHD to QHD and UHD resolutions is a dominant trend, fueled by the proliferation of high-definition content and the need for enhanced productivity and visual clarity in professional environments.
Technological disruptions are playing a pivotal role. The development of advanced driver ICs capable of supporting higher refresh rates (e.g., 144Hz, 240Hz and above) is becoming a critical factor, particularly for the gaming segment. Furthermore, the integration of driver ICs with advanced display technologies like Mini-LED and OLED is opening new avenues for market expansion, enabling brighter, more vibrant, and power-efficient displays. Consumer behavior shifts are also a key contributor. There's a discernible preference for larger screen sizes and superior visual fidelity, directly translating into a higher demand for sophisticated display driver solutions. The rise of remote work and advanced gaming setups has further amplified this trend, making high-performance monitors a necessity.
The market penetration of UHD panels, while lower than FHD, is experiencing rapid growth, indicating a significant opportunity for driver IC manufacturers catering to this segment. Similarly, the demand for WQHD panels continues to expand, occupying a crucial niche between FHD and UHD for users seeking a balance of resolution and performance. The ongoing advancements in semiconductor manufacturing processes are also enabling the production of more compact, power-efficient, and cost-effective driver ICs, further accelerating adoption rates. The industry's ability to innovate and adapt to these evolving demands will be crucial in capitalizing on the robust growth potential of the MNT Display Driver IC market.
Dominant Regions, Countries, or Segments in MNT Display Driver IC
The MNT Display Driver IC market's dominance is largely dictated by the confluence of manufacturing capabilities, end-user demand, and technological adoption rates. Asia-Pacific stands out as the overwhelmingly dominant region, primarily driven by its robust semiconductor manufacturing infrastructure and its position as a global hub for electronics production. Countries within this region, particularly Taiwan and South Korea, are critical centers for display panel manufacturing, and consequently, for the demand and production of associated display driver ICs. China’s rapidly expanding electronics industry also contributes significantly to regional growth.
Within the Application segment, UHD Panel applications are emerging as a key growth driver and a segment exhibiting increasing dominance. While FHD panels still represent a substantial volume, the rapid shift towards higher resolutions for immersive experiences and professional workflows is accelerating UHD adoption. The market share of UHD panels is steadily increasing, driven by consumer demand for better picture quality and the need for greater screen real estate in professional settings. This shift necessitates more advanced and higher-performance driver ICs capable of handling the increased data bandwidth and complex image processing required for UHD resolutions.
In terms of Types, the 32 Channel segment is gaining significant traction and is projected to exhibit substantial growth and increasing dominance. As display resolutions increase and panel sizes expand, there is a growing need for higher channel counts in driver ICs to efficiently address the increasing number of pixels and control signals. While 8 and 16 channel drivers remain relevant for specific applications and lower-resolution panels, the trend towards QHD, UHD, and larger form factors is driving the demand for 32 channel and even higher channel count solutions. The ability of 32 channel ICs to provide more granular control over display elements contributes to improved image quality, faster response times, and enhanced power management, making them increasingly indispensable for high-performance monitors.
- Dominant Region: Asia-Pacific (driven by Taiwan, South Korea, and China).
- Key Application Segment Drivers: Increasing consumer and professional demand for enhanced visual fidelity and productivity.
- Emerging Dominant Application: UHD Panel, witnessing rapid adoption and requiring more advanced driver ICs.
- Key Type Segment Drivers: Need for increased pixel control and data handling with higher resolutions and larger screen sizes.
- Emerging Dominant Type: 32 Channel, crucial for supporting QHD, UHD, and larger display formats.
- Economic Policies: Favorable government support for semiconductor manufacturing and R&D in key Asian countries.
- Infrastructure: Highly developed electronics manufacturing ecosystem and supply chains.
MNT Display Driver IC Product Landscape
The MNT Display Driver IC product landscape is characterized by continuous innovation focused on enhancing visual performance and power efficiency. Manufacturers are developing driver ICs that support ultra-high resolutions like UHD and WQHD, enabling crisp and detailed imagery essential for professional design, gaming, and content consumption. Key product advancements include increased channel counts (up to 32 channels and beyond) to meticulously control individual pixels, contributing to superior contrast ratios and color accuracy. Furthermore, integration of advanced features such as Variable Refresh Rate (VRR) support and adaptive synchronization technologies ensures smoother motion and reduced input lag, crucial for gaming. Power efficiency remains a critical development area, with driver ICs incorporating advanced power management techniques to reduce energy consumption without compromising performance. These technological leaps translate into more immersive, responsive, and visually stunning monitor experiences for end-users.
Key Drivers, Barriers & Challenges in MNT Display Driver IC
Key Drivers: The MNT Display Driver IC market is propelled by the escalating consumer and professional demand for higher resolution monitors (QHD, UHD), the growing popularity of gaming with its requirement for high refresh rates and low latency, and the continuous evolution of display technologies like Mini-LED and OLED which necessitate more sophisticated driver ICs. Technological advancements in semiconductor manufacturing enabling higher integration and lower power consumption also serve as a significant driver.
Barriers & Challenges: Supply chain disruptions, particularly concerning critical raw materials and advanced semiconductor manufacturing capacity, pose a significant challenge. The intense competition among established players and the pressure to constantly innovate with shorter product cycles can lead to high R&D costs. Regulatory hurdles related to environmental compliance and evolving energy efficiency standards can add to development complexities. Furthermore, the commoditization of lower-end monitor segments creates price pressures, impacting profit margins for driver IC manufacturers.
Emerging Opportunities in MNT Display Driver IC
Emerging opportunities in the MNT Display Driver IC sector lie in the growing demand for specialized driver ICs catering to professional creative workflows, including graphic design, video editing, and 3D modeling, where color accuracy and resolution are paramount. The expansion of the esports and professional gaming markets presents a significant avenue for high-performance driver ICs supporting extreme refresh rates and low response times. Furthermore, the integration of advanced AI-driven image processing capabilities within driver ICs to enhance picture quality and user experience represents a nascent but promising area for innovation. The development of driver ICs for next-generation display technologies, such as micro-LED, also offers substantial long-term growth potential.
Growth Accelerators in the MNT Display Driver IC Industry
The MNT Display Driver IC industry's long-term growth is being accelerated by several key catalysts. Technological breakthroughs in advanced packaging, enabling higher density and more complex driver IC designs, are crucial. Strategic partnerships between display panel manufacturers and driver IC suppliers are fostering co-development and faster time-to-market for innovative solutions. The increasing global adoption of premium monitor experiences, driven by both enterprise upgrades and consumer demand for superior entertainment and productivity, fuels market expansion. Furthermore, the continuous push for energy-efficient display solutions aligns with global sustainability initiatives, creating a market advantage for driver ICs that reduce power consumption.
Key Players Shaping the MNT Display Driver IC Market
- LX Semicon
- Himax Technologies, Inc.
- Raydium Semiconductor Corporation
- DB HiTek
- Novatek Microelectronics Corp
- Fitipower
- ESWIN
- Chipone Technology
Notable Milestones in MNT Display Driver IC Sector
- 2019: Introduction of driver ICs supporting 4K resolution at higher refresh rates, catering to the nascent demand for premium consumer monitors.
- 2020: Increased adoption of 10-bit color depth driver ICs, enhancing color accuracy for professional content creation.
- 2021: Significant advancements in power management technologies within driver ICs, leading to more energy-efficient monitor designs.
- 2022: Emergence of driver ICs with integrated adaptive sync technologies, further optimizing gaming monitor performance.
- 2023: Growing focus on driver ICs for OLED and Mini-LED monitors, enabling enhanced contrast and brightness.
- 2024: Introduction of driver ICs with enhanced support for AI-driven image enhancement features.
In-Depth MNT Display Driver IC Market Outlook
The MNT Display Driver IC market outlook is exceptionally positive, with continued growth fueled by an insatiable demand for higher resolution, faster refresh rates, and superior visual fidelity. Key growth accelerators include the ongoing technological evolution in semiconductor manufacturing, enabling more powerful and efficient driver ICs, and strategic collaborations that expedite the integration of cutting-edge display technologies. The expanding global footprint of gaming and professional creative industries, coupled with enterprise upgrades towards enhanced productivity tools, will sustain robust market expansion. Furthermore, the increasing emphasis on energy efficiency and the potential of emerging display technologies like micro-LED present significant future opportunities, positioning the MNT Display Driver IC sector for sustained innovation and market leadership.
MNT Display Driver IC Segmentation
-
1. Application
- 1.1. FHD Panel
- 1.2. QHD Panel
- 1.3. UHD Panel
- 1.4. WQHD Panel
-
2. Types
- 2.1. 8 Channel
- 2.2. 16 Channel
- 2.3. 32 Channel
- 2.4. Others
MNT Display Driver IC Segmentation By Geography
-
1. North America
- 1.1. United States
- 1.2. Canada
- 1.3. Mexico
-
2. South America
- 2.1. Brazil
- 2.2. Argentina
- 2.3. Rest of South America
-
3. Europe
- 3.1. United Kingdom
- 3.2. Germany
- 3.3. France
- 3.4. Italy
- 3.5. Spain
- 3.6. Russia
- 3.7. Benelux
- 3.8. Nordics
- 3.9. Rest of Europe
-
4. Middle East & Africa
- 4.1. Turkey
- 4.2. Israel
- 4.3. GCC
- 4.4. North Africa
- 4.5. South Africa
- 4.6. Rest of Middle East & Africa
-
5. Asia Pacific
- 5.1. China
- 5.2. India
- 5.3. Japan
- 5.4. South Korea
- 5.5. ASEAN
- 5.6. Oceania
- 5.7. Rest of Asia Pacific
MNT Display Driver IC Regional Market Share
Geographic Coverage of MNT Display Driver IC
MNT Display Driver IC REPORT HIGHLIGHTS
| Aspects | Details |
|---|---|
| Study Period | 2020-2034 |
| Base Year | 2025 |
| Estimated Year | 2026 |
| Forecast Period | 2026-2034 |
| Historical Period | 2020-2025 |
| Growth Rate | CAGR of 6.6% from 2020-2034 |
| Segmentation |
|
Table of Contents
- 1. Introduction
- 1.1. Research Scope
- 1.2. Market Segmentation
- 1.3. Research Methodology
- 1.4. Definitions and Assumptions
- 2. Executive Summary
- 2.1. Introduction
- 3. Market Dynamics
- 3.1. Introduction
- 3.2. Market Drivers
- 3.3. Market Restrains
- 3.4. Market Trends
- 4. Market Factor Analysis
- 4.1. Porters Five Forces
- 4.2. Supply/Value Chain
- 4.3. PESTEL analysis
- 4.4. Market Entropy
- 4.5. Patent/Trademark Analysis
- 5. Global MNT Display Driver IC Analysis, Insights and Forecast, 2020-2032
- 5.1. Market Analysis, Insights and Forecast - by Application
- 5.1.1. FHD Panel
- 5.1.2. QHD Panel
- 5.1.3. UHD Panel
- 5.1.4. WQHD Panel
- 5.2. Market Analysis, Insights and Forecast - by Types
- 5.2.1. 8 Channel
- 5.2.2. 16 Channel
- 5.2.3. 32 Channel
- 5.2.4. Others
- 5.3. Market Analysis, Insights and Forecast - by Region
- 5.3.1. North America
- 5.3.2. South America
- 5.3.3. Europe
- 5.3.4. Middle East & Africa
- 5.3.5. Asia Pacific
- 5.1. Market Analysis, Insights and Forecast - by Application
- 6. North America MNT Display Driver IC Analysis, Insights and Forecast, 2020-2032
- 6.1. Market Analysis, Insights and Forecast - by Application
- 6.1.1. FHD Panel
- 6.1.2. QHD Panel
- 6.1.3. UHD Panel
- 6.1.4. WQHD Panel
- 6.2. Market Analysis, Insights and Forecast - by Types
- 6.2.1. 8 Channel
- 6.2.2. 16 Channel
- 6.2.3. 32 Channel
- 6.2.4. Others
- 6.1. Market Analysis, Insights and Forecast - by Application
- 7. South America MNT Display Driver IC Analysis, Insights and Forecast, 2020-2032
- 7.1. Market Analysis, Insights and Forecast - by Application
- 7.1.1. FHD Panel
- 7.1.2. QHD Panel
- 7.1.3. UHD Panel
- 7.1.4. WQHD Panel
- 7.2. Market Analysis, Insights and Forecast - by Types
- 7.2.1. 8 Channel
- 7.2.2. 16 Channel
- 7.2.3. 32 Channel
- 7.2.4. Others
- 7.1. Market Analysis, Insights and Forecast - by Application
- 8. Europe MNT Display Driver IC Analysis, Insights and Forecast, 2020-2032
- 8.1. Market Analysis, Insights and Forecast - by Application
- 8.1.1. FHD Panel
- 8.1.2. QHD Panel
- 8.1.3. UHD Panel
- 8.1.4. WQHD Panel
- 8.2. Market Analysis, Insights and Forecast - by Types
- 8.2.1. 8 Channel
- 8.2.2. 16 Channel
- 8.2.3. 32 Channel
- 8.2.4. Others
- 8.1. Market Analysis, Insights and Forecast - by Application
- 9. Middle East & Africa MNT Display Driver IC Analysis, Insights and Forecast, 2020-2032
- 9.1. Market Analysis, Insights and Forecast - by Application
- 9.1.1. FHD Panel
- 9.1.2. QHD Panel
- 9.1.3. UHD Panel
- 9.1.4. WQHD Panel
- 9.2. Market Analysis, Insights and Forecast - by Types
- 9.2.1. 8 Channel
- 9.2.2. 16 Channel
- 9.2.3. 32 Channel
- 9.2.4. Others
- 9.1. Market Analysis, Insights and Forecast - by Application
- 10. Asia Pacific MNT Display Driver IC Analysis, Insights and Forecast, 2020-2032
- 10.1. Market Analysis, Insights and Forecast - by Application
- 10.1.1. FHD Panel
- 10.1.2. QHD Panel
- 10.1.3. UHD Panel
- 10.1.4. WQHD Panel
- 10.2. Market Analysis, Insights and Forecast - by Types
- 10.2.1. 8 Channel
- 10.2.2. 16 Channel
- 10.2.3. 32 Channel
- 10.2.4. Others
- 10.1. Market Analysis, Insights and Forecast - by Application
- 11. Competitive Analysis
- 11.1. Global Market Share Analysis 2025
- 11.2. Company Profiles
- 11.2.1 LX Semicon
- 11.2.1.1. Overview
- 11.2.1.2. Products
- 11.2.1.3. SWOT Analysis
- 11.2.1.4. Recent Developments
- 11.2.1.5. Financials (Based on Availability)
- 11.2.2 Himax Technologies
- 11.2.2.1. Overview
- 11.2.2.2. Products
- 11.2.2.3. SWOT Analysis
- 11.2.2.4. Recent Developments
- 11.2.2.5. Financials (Based on Availability)
- 11.2.3 Inc
- 11.2.3.1. Overview
- 11.2.3.2. Products
- 11.2.3.3. SWOT Analysis
- 11.2.3.4. Recent Developments
- 11.2.3.5. Financials (Based on Availability)
- 11.2.4 Raydium Semiconductor Corporation
- 11.2.4.1. Overview
- 11.2.4.2. Products
- 11.2.4.3. SWOT Analysis
- 11.2.4.4. Recent Developments
- 11.2.4.5. Financials (Based on Availability)
- 11.2.5 DB HiTek
- 11.2.5.1. Overview
- 11.2.5.2. Products
- 11.2.5.3. SWOT Analysis
- 11.2.5.4. Recent Developments
- 11.2.5.5. Financials (Based on Availability)
- 11.2.6 Novatek Microelectronics Corp
- 11.2.6.1. Overview
- 11.2.6.2. Products
- 11.2.6.3. SWOT Analysis
- 11.2.6.4. Recent Developments
- 11.2.6.5. Financials (Based on Availability)
- 11.2.7 Fitipower
- 11.2.7.1. Overview
- 11.2.7.2. Products
- 11.2.7.3. SWOT Analysis
- 11.2.7.4. Recent Developments
- 11.2.7.5. Financials (Based on Availability)
- 11.2.8 ESWIN
- 11.2.8.1. Overview
- 11.2.8.2. Products
- 11.2.8.3. SWOT Analysis
- 11.2.8.4. Recent Developments
- 11.2.8.5. Financials (Based on Availability)
- 11.2.9 Chipone Technology
- 11.2.9.1. Overview
- 11.2.9.2. Products
- 11.2.9.3. SWOT Analysis
- 11.2.9.4. Recent Developments
- 11.2.9.5. Financials (Based on Availability)
- 11.2.1 LX Semicon
List of Figures
- Figure 1: Global MNT Display Driver IC Revenue Breakdown (million, %) by Region 2025 & 2033
- Figure 2: Global MNT Display Driver IC Volume Breakdown (K, %) by Region 2025 & 2033
- Figure 3: North America MNT Display Driver IC Revenue (million), by Application 2025 & 2033
- Figure 4: North America MNT Display Driver IC Volume (K), by Application 2025 & 2033
- Figure 5: North America MNT Display Driver IC Revenue Share (%), by Application 2025 & 2033
- Figure 6: North America MNT Display Driver IC Volume Share (%), by Application 2025 & 2033
- Figure 7: North America MNT Display Driver IC Revenue (million), by Types 2025 & 2033
- Figure 8: North America MNT Display Driver IC Volume (K), by Types 2025 & 2033
- Figure 9: North America MNT Display Driver IC Revenue Share (%), by Types 2025 & 2033
- Figure 10: North America MNT Display Driver IC Volume Share (%), by Types 2025 & 2033
- Figure 11: North America MNT Display Driver IC Revenue (million), by Country 2025 & 2033
- Figure 12: North America MNT Display Driver IC Volume (K), by Country 2025 & 2033
- Figure 13: North America MNT Display Driver IC Revenue Share (%), by Country 2025 & 2033
- Figure 14: North America MNT Display Driver IC Volume Share (%), by Country 2025 & 2033
- Figure 15: South America MNT Display Driver IC Revenue (million), by Application 2025 & 2033
- Figure 16: South America MNT Display Driver IC Volume (K), by Application 2025 & 2033
- Figure 17: South America MNT Display Driver IC Revenue Share (%), by Application 2025 & 2033
- Figure 18: South America MNT Display Driver IC Volume Share (%), by Application 2025 & 2033
- Figure 19: South America MNT Display Driver IC Revenue (million), by Types 2025 & 2033
- Figure 20: South America MNT Display Driver IC Volume (K), by Types 2025 & 2033
- Figure 21: South America MNT Display Driver IC Revenue Share (%), by Types 2025 & 2033
- Figure 22: South America MNT Display Driver IC Volume Share (%), by Types 2025 & 2033
- Figure 23: South America MNT Display Driver IC Revenue (million), by Country 2025 & 2033
- Figure 24: South America MNT Display Driver IC Volume (K), by Country 2025 & 2033
- Figure 25: South America MNT Display Driver IC Revenue Share (%), by Country 2025 & 2033
- Figure 26: South America MNT Display Driver IC Volume Share (%), by Country 2025 & 2033
- Figure 27: Europe MNT Display Driver IC Revenue (million), by Application 2025 & 2033
- Figure 28: Europe MNT Display Driver IC Volume (K), by Application 2025 & 2033
- Figure 29: Europe MNT Display Driver IC Revenue Share (%), by Application 2025 & 2033
- Figure 30: Europe MNT Display Driver IC Volume Share (%), by Application 2025 & 2033
- Figure 31: Europe MNT Display Driver IC Revenue (million), by Types 2025 & 2033
- Figure 32: Europe MNT Display Driver IC Volume (K), by Types 2025 & 2033
- Figure 33: Europe MNT Display Driver IC Revenue Share (%), by Types 2025 & 2033
- Figure 34: Europe MNT Display Driver IC Volume Share (%), by Types 2025 & 2033
- Figure 35: Europe MNT Display Driver IC Revenue (million), by Country 2025 & 2033
- Figure 36: Europe MNT Display Driver IC Volume (K), by Country 2025 & 2033
- Figure 37: Europe MNT Display Driver IC Revenue Share (%), by Country 2025 & 2033
- Figure 38: Europe MNT Display Driver IC Volume Share (%), by Country 2025 & 2033
- Figure 39: Middle East & Africa MNT Display Driver IC Revenue (million), by Application 2025 & 2033
- Figure 40: Middle East & Africa MNT Display Driver IC Volume (K), by Application 2025 & 2033
- Figure 41: Middle East & Africa MNT Display Driver IC Revenue Share (%), by Application 2025 & 2033
- Figure 42: Middle East & Africa MNT Display Driver IC Volume Share (%), by Application 2025 & 2033
- Figure 43: Middle East & Africa MNT Display Driver IC Revenue (million), by Types 2025 & 2033
- Figure 44: Middle East & Africa MNT Display Driver IC Volume (K), by Types 2025 & 2033
- Figure 45: Middle East & Africa MNT Display Driver IC Revenue Share (%), by Types 2025 & 2033
- Figure 46: Middle East & Africa MNT Display Driver IC Volume Share (%), by Types 2025 & 2033
- Figure 47: Middle East & Africa MNT Display Driver IC Revenue (million), by Country 2025 & 2033
- Figure 48: Middle East & Africa MNT Display Driver IC Volume (K), by Country 2025 & 2033
- Figure 49: Middle East & Africa MNT Display Driver IC Revenue Share (%), by Country 2025 & 2033
- Figure 50: Middle East & Africa MNT Display Driver IC Volume Share (%), by Country 2025 & 2033
- Figure 51: Asia Pacific MNT Display Driver IC Revenue (million), by Application 2025 & 2033
- Figure 52: Asia Pacific MNT Display Driver IC Volume (K), by Application 2025 & 2033
- Figure 53: Asia Pacific MNT Display Driver IC Revenue Share (%), by Application 2025 & 2033
- Figure 54: Asia Pacific MNT Display Driver IC Volume Share (%), by Application 2025 & 2033
- Figure 55: Asia Pacific MNT Display Driver IC Revenue (million), by Types 2025 & 2033
- Figure 56: Asia Pacific MNT Display Driver IC Volume (K), by Types 2025 & 2033
- Figure 57: Asia Pacific MNT Display Driver IC Revenue Share (%), by Types 2025 & 2033
- Figure 58: Asia Pacific MNT Display Driver IC Volume Share (%), by Types 2025 & 2033
- Figure 59: Asia Pacific MNT Display Driver IC Revenue (million), by Country 2025 & 2033
- Figure 60: Asia Pacific MNT Display Driver IC Volume (K), by Country 2025 & 2033
- Figure 61: Asia Pacific MNT Display Driver IC Revenue Share (%), by Country 2025 & 2033
- Figure 62: Asia Pacific MNT Display Driver IC Volume Share (%), by Country 2025 & 2033
List of Tables
- Table 1: Global MNT Display Driver IC Revenue million Forecast, by Application 2020 & 2033
- Table 2: Global MNT Display Driver IC Volume K Forecast, by Application 2020 & 2033
- Table 3: Global MNT Display Driver IC Revenue million Forecast, by Types 2020 & 2033
- Table 4: Global MNT Display Driver IC Volume K Forecast, by Types 2020 & 2033
- Table 5: Global MNT Display Driver IC Revenue million Forecast, by Region 2020 & 2033
- Table 6: Global MNT Display Driver IC Volume K Forecast, by Region 2020 & 2033
- Table 7: Global MNT Display Driver IC Revenue million Forecast, by Application 2020 & 2033
- Table 8: Global MNT Display Driver IC Volume K Forecast, by Application 2020 & 2033
- Table 9: Global MNT Display Driver IC Revenue million Forecast, by Types 2020 & 2033
- Table 10: Global MNT Display Driver IC Volume K Forecast, by Types 2020 & 2033
- Table 11: Global MNT Display Driver IC Revenue million Forecast, by Country 2020 & 2033
- Table 12: Global MNT Display Driver IC Volume K Forecast, by Country 2020 & 2033
- Table 13: United States MNT Display Driver IC Revenue (million) Forecast, by Application 2020 & 2033
- Table 14: United States MNT Display Driver IC Volume (K) Forecast, by Application 2020 & 2033
- Table 15: Canada MNT Display Driver IC Revenue (million) Forecast, by Application 2020 & 2033
- Table 16: Canada MNT Display Driver IC Volume (K) Forecast, by Application 2020 & 2033
- Table 17: Mexico MNT Display Driver IC Revenue (million) Forecast, by Application 2020 & 2033
- Table 18: Mexico MNT Display Driver IC Volume (K) Forecast, by Application 2020 & 2033
- Table 19: Global MNT Display Driver IC Revenue million Forecast, by Application 2020 & 2033
- Table 20: Global MNT Display Driver IC Volume K Forecast, by Application 2020 & 2033
- Table 21: Global MNT Display Driver IC Revenue million Forecast, by Types 2020 & 2033
- Table 22: Global MNT Display Driver IC Volume K Forecast, by Types 2020 & 2033
- Table 23: Global MNT Display Driver IC Revenue million Forecast, by Country 2020 & 2033
- Table 24: Global MNT Display Driver IC Volume K Forecast, by Country 2020 & 2033
- Table 25: Brazil MNT Display Driver IC Revenue (million) Forecast, by Application 2020 & 2033
- Table 26: Brazil MNT Display Driver IC Volume (K) Forecast, by Application 2020 & 2033
- Table 27: Argentina MNT Display Driver IC Revenue (million) Forecast, by Application 2020 & 2033
- Table 28: Argentina MNT Display Driver IC Volume (K) Forecast, by Application 2020 & 2033
- Table 29: Rest of South America MNT Display Driver IC Revenue (million) Forecast, by Application 2020 & 2033
- Table 30: Rest of South America MNT Display Driver IC Volume (K) Forecast, by Application 2020 & 2033
- Table 31: Global MNT Display Driver IC Revenue million Forecast, by Application 2020 & 2033
- Table 32: Global MNT Display Driver IC Volume K Forecast, by Application 2020 & 2033
- Table 33: Global MNT Display Driver IC Revenue million Forecast, by Types 2020 & 2033
- Table 34: Global MNT Display Driver IC Volume K Forecast, by Types 2020 & 2033
- Table 35: Global MNT Display Driver IC Revenue million Forecast, by Country 2020 & 2033
- Table 36: Global MNT Display Driver IC Volume K Forecast, by Country 2020 & 2033
- Table 37: United Kingdom MNT Display Driver IC Revenue (million) Forecast, by Application 2020 & 2033
- Table 38: United Kingdom MNT Display Driver IC Volume (K) Forecast, by Application 2020 & 2033
- Table 39: Germany MNT Display Driver IC Revenue (million) Forecast, by Application 2020 & 2033
- Table 40: Germany MNT Display Driver IC Volume (K) Forecast, by Application 2020 & 2033
- Table 41: France MNT Display Driver IC Revenue (million) Forecast, by Application 2020 & 2033
- Table 42: France MNT Display Driver IC Volume (K) Forecast, by Application 2020 & 2033
- Table 43: Italy MNT Display Driver IC Revenue (million) Forecast, by Application 2020 & 2033
- Table 44: Italy MNT Display Driver IC Volume (K) Forecast, by Application 2020 & 2033
- Table 45: Spain MNT Display Driver IC Revenue (million) Forecast, by Application 2020 & 2033
- Table 46: Spain MNT Display Driver IC Volume (K) Forecast, by Application 2020 & 2033
- Table 47: Russia MNT Display Driver IC Revenue (million) Forecast, by Application 2020 & 2033
- Table 48: Russia MNT Display Driver IC Volume (K) Forecast, by Application 2020 & 2033
- Table 49: Benelux MNT Display Driver IC Revenue (million) Forecast, by Application 2020 & 2033
- Table 50: Benelux MNT Display Driver IC Volume (K) Forecast, by Application 2020 & 2033
- Table 51: Nordics MNT Display Driver IC Revenue (million) Forecast, by Application 2020 & 2033
- Table 52: Nordics MNT Display Driver IC Volume (K) Forecast, by Application 2020 & 2033
- Table 53: Rest of Europe MNT Display Driver IC Revenue (million) Forecast, by Application 2020 & 2033
- Table 54: Rest of Europe MNT Display Driver IC Volume (K) Forecast, by Application 2020 & 2033
- Table 55: Global MNT Display Driver IC Revenue million Forecast, by Application 2020 & 2033
- Table 56: Global MNT Display Driver IC Volume K Forecast, by Application 2020 & 2033
- Table 57: Global MNT Display Driver IC Revenue million Forecast, by Types 2020 & 2033
- Table 58: Global MNT Display Driver IC Volume K Forecast, by Types 2020 & 2033
- Table 59: Global MNT Display Driver IC Revenue million Forecast, by Country 2020 & 2033
- Table 60: Global MNT Display Driver IC Volume K Forecast, by Country 2020 & 2033
- Table 61: Turkey MNT Display Driver IC Revenue (million) Forecast, by Application 2020 & 2033
- Table 62: Turkey MNT Display Driver IC Volume (K) Forecast, by Application 2020 & 2033
- Table 63: Israel MNT Display Driver IC Revenue (million) Forecast, by Application 2020 & 2033
- Table 64: Israel MNT Display Driver IC Volume (K) Forecast, by Application 2020 & 2033
- Table 65: GCC MNT Display Driver IC Revenue (million) Forecast, by Application 2020 & 2033
- Table 66: GCC MNT Display Driver IC Volume (K) Forecast, by Application 2020 & 2033
- Table 67: North Africa MNT Display Driver IC Revenue (million) Forecast, by Application 2020 & 2033
- Table 68: North Africa MNT Display Driver IC Volume (K) Forecast, by Application 2020 & 2033
- Table 69: South Africa MNT Display Driver IC Revenue (million) Forecast, by Application 2020 & 2033
- Table 70: South Africa MNT Display Driver IC Volume (K) Forecast, by Application 2020 & 2033
- Table 71: Rest of Middle East & Africa MNT Display Driver IC Revenue (million) Forecast, by Application 2020 & 2033
- Table 72: Rest of Middle East & Africa MNT Display Driver IC Volume (K) Forecast, by Application 2020 & 2033
- Table 73: Global MNT Display Driver IC Revenue million Forecast, by Application 2020 & 2033
- Table 74: Global MNT Display Driver IC Volume K Forecast, by Application 2020 & 2033
- Table 75: Global MNT Display Driver IC Revenue million Forecast, by Types 2020 & 2033
- Table 76: Global MNT Display Driver IC Volume K Forecast, by Types 2020 & 2033
- Table 77: Global MNT Display Driver IC Revenue million Forecast, by Country 2020 & 2033
- Table 78: Global MNT Display Driver IC Volume K Forecast, by Country 2020 & 2033
- Table 79: China MNT Display Driver IC Revenue (million) Forecast, by Application 2020 & 2033
- Table 80: China MNT Display Driver IC Volume (K) Forecast, by Application 2020 & 2033
- Table 81: India MNT Display Driver IC Revenue (million) Forecast, by Application 2020 & 2033
- Table 82: India MNT Display Driver IC Volume (K) Forecast, by Application 2020 & 2033
- Table 83: Japan MNT Display Driver IC Revenue (million) Forecast, by Application 2020 & 2033
- Table 84: Japan MNT Display Driver IC Volume (K) Forecast, by Application 2020 & 2033
- Table 85: South Korea MNT Display Driver IC Revenue (million) Forecast, by Application 2020 & 2033
- Table 86: South Korea MNT Display Driver IC Volume (K) Forecast, by Application 2020 & 2033
- Table 87: ASEAN MNT Display Driver IC Revenue (million) Forecast, by Application 2020 & 2033
- Table 88: ASEAN MNT Display Driver IC Volume (K) Forecast, by Application 2020 & 2033
- Table 89: Oceania MNT Display Driver IC Revenue (million) Forecast, by Application 2020 & 2033
- Table 90: Oceania MNT Display Driver IC Volume (K) Forecast, by Application 2020 & 2033
- Table 91: Rest of Asia Pacific MNT Display Driver IC Revenue (million) Forecast, by Application 2020 & 2033
- Table 92: Rest of Asia Pacific MNT Display Driver IC Volume (K) Forecast, by Application 2020 & 2033
Frequently Asked Questions
1. What is the projected Compound Annual Growth Rate (CAGR) of the MNT Display Driver IC?
The projected CAGR is approximately 6.6%.
2. Which companies are prominent players in the MNT Display Driver IC?
Key companies in the market include LX Semicon, Himax Technologies, Inc, Raydium Semiconductor Corporation, DB HiTek, Novatek Microelectronics Corp, Fitipower, ESWIN, Chipone Technology.
3. What are the main segments of the MNT Display Driver IC?
The market segments include Application, Types.
4. Can you provide details about the market size?
The market size is estimated to be USD 9467.18 million as of 2022.
5. What are some drivers contributing to market growth?
N/A
6. What are the notable trends driving market growth?
N/A
7. Are there any restraints impacting market growth?
N/A
8. Can you provide examples of recent developments in the market?
N/A
9. What pricing options are available for accessing the report?
Pricing options include single-user, multi-user, and enterprise licenses priced at USD 3950.00, USD 5925.00, and USD 7900.00 respectively.
10. Is the market size provided in terms of value or volume?
The market size is provided in terms of value, measured in million and volume, measured in K.
11. Are there any specific market keywords associated with the report?
Yes, the market keyword associated with the report is "MNT Display Driver IC," which aids in identifying and referencing the specific market segment covered.
12. How do I determine which pricing option suits my needs best?
The pricing options vary based on user requirements and access needs. Individual users may opt for single-user licenses, while businesses requiring broader access may choose multi-user or enterprise licenses for cost-effective access to the report.
13. Are there any additional resources or data provided in the MNT Display Driver IC report?
While the report offers comprehensive insights, it's advisable to review the specific contents or supplementary materials provided to ascertain if additional resources or data are available.
14. How can I stay updated on further developments or reports in the MNT Display Driver IC?
To stay informed about further developments, trends, and reports in the MNT Display Driver IC, consider subscribing to industry newsletters, following relevant companies and organizations, or regularly checking reputable industry news sources and publications.
Methodology
Step 1 - Identification of Relevant Samples Size from Population Database


Step 2 - Approaches for Defining Global Market Size (Value, Volume* & Price*)

Note*: In applicable scenarios
Step 3 - Data Sources
Primary Research
- Web Analytics
- Survey Reports
- Research Institute
- Latest Research Reports
- Opinion Leaders
Secondary Research
- Annual Reports
- White Paper
- Latest Press Release
- Industry Association
- Paid Database
- Investor Presentations

Step 4 - Data Triangulation
Involves using different sources of information in order to increase the validity of a study
These sources are likely to be stakeholders in a program - participants, other researchers, program staff, other community members, and so on.
Then we put all data in single framework & apply various statistical tools to find out the dynamic on the market.
During the analysis stage, feedback from the stakeholder groups would be compared to determine areas of agreement as well as areas of divergence