

Key Insights
The global market for PAN pre-oxidized fibers is experiencing robust growth, driven by the increasing demand for lightweight yet high-strength materials in various end-use industries. The automotive sector, particularly the electric vehicle (EV) market, is a significant contributor to this growth, as manufacturers seek to improve fuel efficiency and vehicle performance through the use of carbon fiber composites. The aerospace industry also presents a substantial opportunity, with PAN pre-oxidized fibers playing a crucial role in the development of lighter and more fuel-efficient aircraft. Furthermore, the rising adoption of these fibers in wind energy applications, sporting goods, and construction further fuels market expansion. Technological advancements focusing on improving fiber properties, such as tensile strength and durability, are also contributing to market growth. While raw material costs and the energy-intensive nature of the manufacturing process pose challenges, continuous innovation and optimization strategies are mitigating these restraints. Competition is relatively concentrated, with established players like SGL Carbon, Zoltek, Teijin, and several Chinese manufacturers vying for market share.
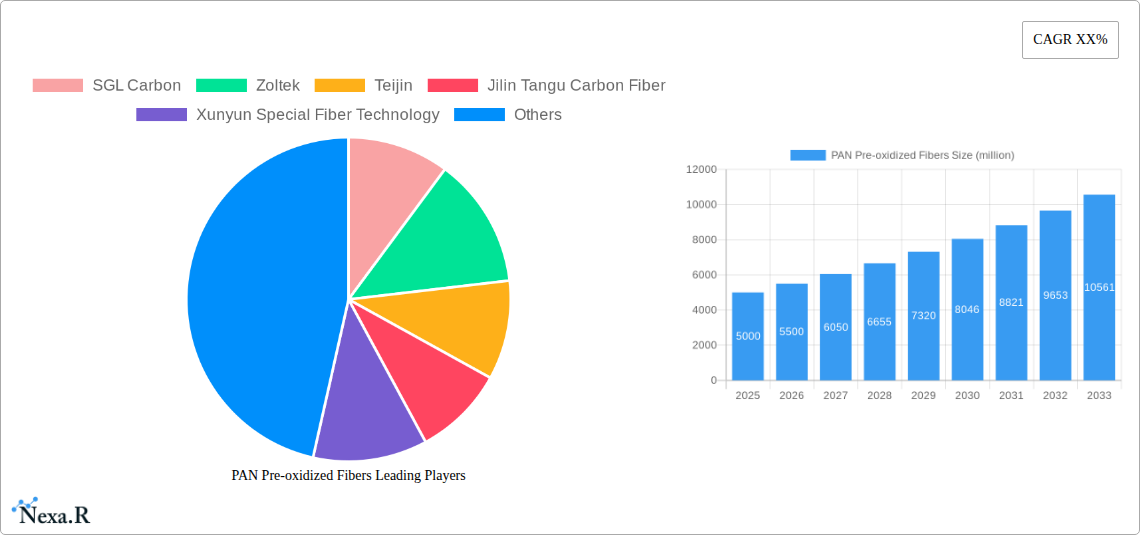
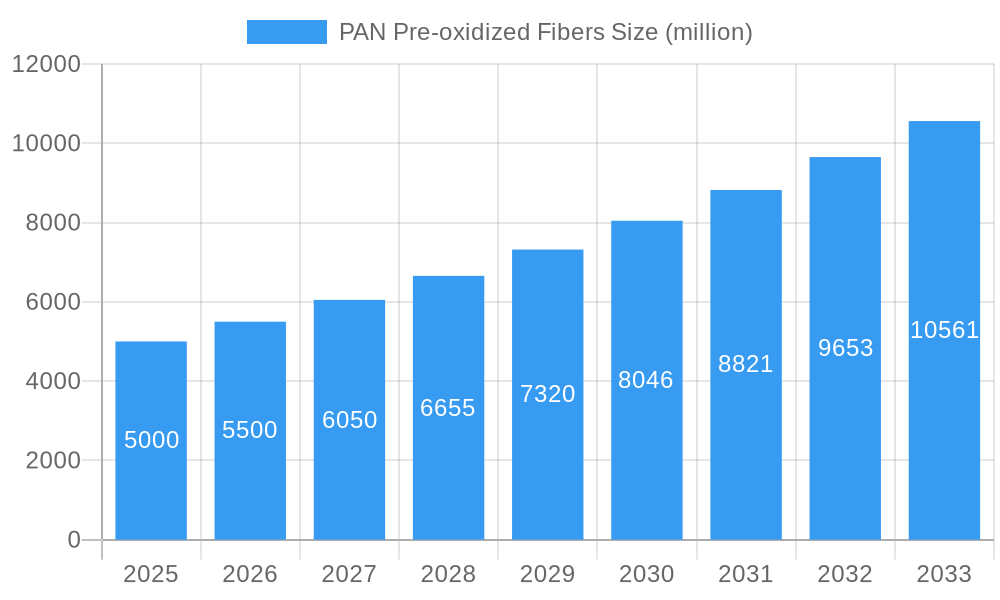
PAN Pre-oxidized Fibers Market Size (In Billion)
Looking forward, the market is projected to maintain a healthy Compound Annual Growth Rate (CAGR) throughout the forecast period (2025-2033). This growth will likely be fueled by sustained demand from existing industries and the emergence of new applications in areas like infrastructure development and biomedical engineering. Regional variations in growth will likely reflect the maturity of respective manufacturing sectors and government policies promoting sustainable materials. The continued investment in research and development, coupled with strategic partnerships and mergers and acquisitions, will shape the competitive landscape and drive innovation within the PAN pre-oxidized fiber market.
PAN Pre-oxidized Fibers Company Market Share
PAN Pre-oxidized Fibers Market Report: 2019-2033
This comprehensive report provides a detailed analysis of the global PAN Pre-oxidized Fibers market, offering invaluable insights for industry professionals, investors, and strategic decision-makers. The study covers the historical period (2019-2024), base year (2025), and forecast period (2025-2033), projecting market growth and identifying key trends impacting this crucial segment of the advanced materials industry (Parent Market: Advanced Materials; Child Market: Carbon Fiber). The report's value surpasses xx million units.
PAN Pre-oxidized Fibers Market Dynamics & Structure
This section delves into the competitive landscape of the PAN Pre-oxidized Fibers market, examining market concentration, technological innovation, regulatory influences, and competitive dynamics. The analysis incorporates quantitative data such as market share percentages and M&A deal volumes (xx in 2024) alongside qualitative assessments of innovation barriers and market structure.
- Market Concentration: The market is moderately concentrated, with key players such as SGL Carbon, Zoltek, and Teijin holding significant market share (combined xx% in 2025). However, the presence of several regional players like Jilin Tangu Carbon Fiber and Xunyun Special Fiber Technology indicates increasing competition.
- Technological Innovation: Continuous advancements in fiber production techniques, including improvements in precursor quality and oxidation processes, are key drivers. However, high capital investment requirements present a barrier to entry for smaller players.
- Regulatory Framework: Stringent environmental regulations concerning emissions and waste management influence manufacturing processes and drive innovation towards sustainable solutions.
- Competitive Product Substitutes: While PAN pre-oxidized fibers dominate the market, alternative materials like pitch-based carbon fibers are emerging as substitutes in specific niche applications.
- End-User Demographics: The primary end-users are the aerospace, automotive, and wind energy sectors, with demand driven by lightweighting needs and performance enhancements.
- M&A Trends: Consolidation is anticipated, with larger players potentially acquiring smaller companies to gain access to new technologies or expand their geographic reach.
PAN Pre-oxidized Fibers Growth Trends & Insights
This section analyzes the evolution of the PAN Pre-oxidized Fibers market size, adoption rates, and technological disruptions. Using comprehensive market research data, the report projects a Compound Annual Growth Rate (CAGR) of xx% during the forecast period (2025-2033), driven by increasing demand from diverse end-use industries.
Market size is projected to reach xx million units by 2033, significantly exceeding the 2025 estimated value of xx million units. Adoption rates are expected to increase steadily across various sectors, propelled by advancements in fiber properties and decreasing production costs. Technological disruptions, such as the development of high-strength, high-modulus fibers, will further fuel market growth. Consumer behavior shifts towards sustainable and high-performance materials will also contribute to increasing demand for PAN pre-oxidized fibers.
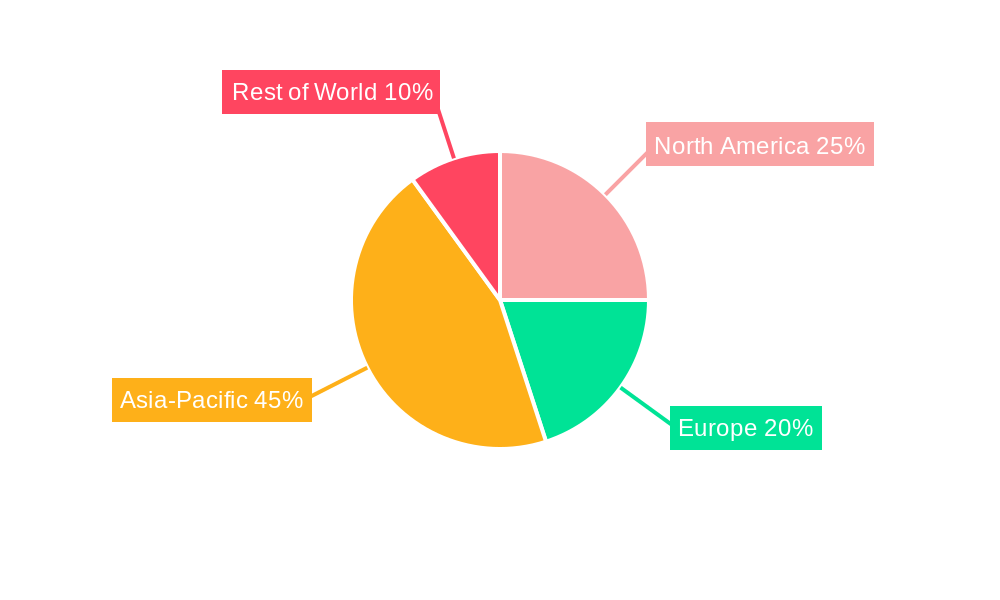
Dominant Regions, Countries, or Segments in PAN Pre-oxidized Fibers
This section identifies the leading geographical regions and market segments driving growth. Asia-Pacific, particularly China, currently holds a dominant market share (xx% in 2025), benefiting from robust domestic demand and significant investments in infrastructure development.
- Key Drivers in Asia-Pacific:
- Strong government support for renewable energy projects (e.g., wind energy)
- Growing automotive and aerospace industries
- Rapid infrastructure development
- Dominance Factors: High production capacity, lower manufacturing costs, and substantial government investments are key contributors to Asia-Pacific's dominance. The region's large and growing population further fuels the demand for various products incorporating PAN pre-oxidized fibers.
North America and Europe are also significant markets with substantial growth potential. However, their market share is projected to remain below Asia-Pacific's throughout the forecast period.
PAN Pre-oxidized Fibers Product Landscape
PAN pre-oxidized fibers are offered in various grades with different tensile strengths, moduli, and diameters to cater to diverse applications. Recent innovations focus on enhancing fiber properties for specific needs, including higher tensile strength and improved processing characteristics. Key selling propositions emphasize improved performance, lightweighting capabilities, and cost-effectiveness compared to traditional materials.
Key Drivers, Barriers & Challenges in PAN Pre-oxidized Fibers
Key Drivers: The primary growth drivers include the increasing demand for lightweight and high-strength materials in the aerospace and automotive sectors, along with the expansion of the wind energy market. Government initiatives promoting renewable energy and stringent fuel efficiency standards further contribute to market growth.
Key Challenges: Fluctuations in raw material prices, intense competition from alternative materials, and environmental regulations pose significant challenges. Supply chain disruptions and geopolitical uncertainties can also impact market stability. The high capital expenditure required for production facilities presents a barrier for new entrants.
Emerging Opportunities in PAN Pre-oxidized Fibers
Emerging opportunities lie in the development of high-performance fibers for advanced applications in areas such as sporting goods, construction, and biomedical engineering. Expanding into untapped markets in developing economies and exploring innovative applications in emerging technologies like robotics and 3D printing also presents substantial potential.
Growth Accelerators in the PAN Pre-oxidized Fibers Industry
Technological breakthroughs, such as the development of higher-performance fibers with improved properties and cost-effective manufacturing processes, are significant growth catalysts. Strategic partnerships between fiber manufacturers and end-users foster innovation and accelerate product development. Market expansion strategies targeting emerging economies and new applications further enhance growth prospects.
Key Players Shaping the PAN Pre-oxidized Fibers Market
- SGL Carbon
- Zoltek
- Teijin
- Jilin Tangu Carbon Fiber
- Xunyun Special Fiber Technology
- Sinopec Shanghai Petrochemical
Notable Milestones in PAN Pre-oxidized Fibers Sector
- 2020: Teijin launches a new high-performance PAN pre-oxidized fiber with enhanced tensile strength.
- 2022: SGL Carbon and Zoltek announce a strategic partnership to jointly develop advanced carbon fiber technologies.
- 2023: Significant investments are made in new production facilities in China to meet growing demand. (Further specific milestones would need to be added based on available data)
In-Depth PAN Pre-oxidized Fibers Market Outlook
The PAN Pre-oxidized Fibers market is poised for robust growth over the forecast period, driven by continuous technological advancements, expansion into new applications, and increasing demand from key end-use sectors. Strategic investments in research and development, coupled with strategic partnerships and market expansion initiatives, will shape the future of this dynamic market. Opportunities abound for companies that can effectively address the challenges and capitalize on emerging trends.
PAN Pre-oxidized Fibers Segmentation
-
1. Application
- 1.1. Aerospace
- 1.2. Car
- 1.3. Textile
- 1.4. Other
-
2. Types
- 2.1. 1K
- 2.2. 3K
- 2.3. 6K
- 2.4. Other
PAN Pre-oxidized Fibers Segmentation By Geography
-
1. North America
- 1.1. United States
- 1.2. Canada
- 1.3. Mexico
-
2. South America
- 2.1. Brazil
- 2.2. Argentina
- 2.3. Rest of South America
-
3. Europe
- 3.1. United Kingdom
- 3.2. Germany
- 3.3. France
- 3.4. Italy
- 3.5. Spain
- 3.6. Russia
- 3.7. Benelux
- 3.8. Nordics
- 3.9. Rest of Europe
-
4. Middle East & Africa
- 4.1. Turkey
- 4.2. Israel
- 4.3. GCC
- 4.4. North Africa
- 4.5. South Africa
- 4.6. Rest of Middle East & Africa
-
5. Asia Pacific
- 5.1. China
- 5.2. India
- 5.3. Japan
- 5.4. South Korea
- 5.5. ASEAN
- 5.6. Oceania
- 5.7. Rest of Asia Pacific
PAN Pre-oxidized Fibers Regional Market Share
Geographic Coverage of PAN Pre-oxidized Fibers
PAN Pre-oxidized Fibers REPORT HIGHLIGHTS
| Aspects | Details |
|---|---|
| Study Period | 2020-2034 |
| Base Year | 2025 |
| Estimated Year | 2026 |
| Forecast Period | 2026-2034 |
| Historical Period | 2020-2025 |
| Growth Rate | CAGR of 9.2% from 2020-2034 |
| Segmentation |
|
Table of Contents
- 1. Introduction
- 1.1. Research Scope
- 1.2. Market Segmentation
- 1.3. Research Methodology
- 1.4. Definitions and Assumptions
- 2. Executive Summary
- 2.1. Introduction
- 3. Market Dynamics
- 3.1. Introduction
- 3.2. Market Drivers
- 3.3. Market Restrains
- 3.4. Market Trends
- 4. Market Factor Analysis
- 4.1. Porters Five Forces
- 4.2. Supply/Value Chain
- 4.3. PESTEL analysis
- 4.4. Market Entropy
- 4.5. Patent/Trademark Analysis
- 5. Global PAN Pre-oxidized Fibers Analysis, Insights and Forecast, 2020-2032
- 5.1. Market Analysis, Insights and Forecast - by Application
- 5.1.1. Aerospace
- 5.1.2. Car
- 5.1.3. Textile
- 5.1.4. Other
- 5.2. Market Analysis, Insights and Forecast - by Types
- 5.2.1. 1K
- 5.2.2. 3K
- 5.2.3. 6K
- 5.2.4. Other
- 5.3. Market Analysis, Insights and Forecast - by Region
- 5.3.1. North America
- 5.3.2. South America
- 5.3.3. Europe
- 5.3.4. Middle East & Africa
- 5.3.5. Asia Pacific
- 5.1. Market Analysis, Insights and Forecast - by Application
- 6. North America PAN Pre-oxidized Fibers Analysis, Insights and Forecast, 2020-2032
- 6.1. Market Analysis, Insights and Forecast - by Application
- 6.1.1. Aerospace
- 6.1.2. Car
- 6.1.3. Textile
- 6.1.4. Other
- 6.2. Market Analysis, Insights and Forecast - by Types
- 6.2.1. 1K
- 6.2.2. 3K
- 6.2.3. 6K
- 6.2.4. Other
- 6.1. Market Analysis, Insights and Forecast - by Application
- 7. South America PAN Pre-oxidized Fibers Analysis, Insights and Forecast, 2020-2032
- 7.1. Market Analysis, Insights and Forecast - by Application
- 7.1.1. Aerospace
- 7.1.2. Car
- 7.1.3. Textile
- 7.1.4. Other
- 7.2. Market Analysis, Insights and Forecast - by Types
- 7.2.1. 1K
- 7.2.2. 3K
- 7.2.3. 6K
- 7.2.4. Other
- 7.1. Market Analysis, Insights and Forecast - by Application
- 8. Europe PAN Pre-oxidized Fibers Analysis, Insights and Forecast, 2020-2032
- 8.1. Market Analysis, Insights and Forecast - by Application
- 8.1.1. Aerospace
- 8.1.2. Car
- 8.1.3. Textile
- 8.1.4. Other
- 8.2. Market Analysis, Insights and Forecast - by Types
- 8.2.1. 1K
- 8.2.2. 3K
- 8.2.3. 6K
- 8.2.4. Other
- 8.1. Market Analysis, Insights and Forecast - by Application
- 9. Middle East & Africa PAN Pre-oxidized Fibers Analysis, Insights and Forecast, 2020-2032
- 9.1. Market Analysis, Insights and Forecast - by Application
- 9.1.1. Aerospace
- 9.1.2. Car
- 9.1.3. Textile
- 9.1.4. Other
- 9.2. Market Analysis, Insights and Forecast - by Types
- 9.2.1. 1K
- 9.2.2. 3K
- 9.2.3. 6K
- 9.2.4. Other
- 9.1. Market Analysis, Insights and Forecast - by Application
- 10. Asia Pacific PAN Pre-oxidized Fibers Analysis, Insights and Forecast, 2020-2032
- 10.1. Market Analysis, Insights and Forecast - by Application
- 10.1.1. Aerospace
- 10.1.2. Car
- 10.1.3. Textile
- 10.1.4. Other
- 10.2. Market Analysis, Insights and Forecast - by Types
- 10.2.1. 1K
- 10.2.2. 3K
- 10.2.3. 6K
- 10.2.4. Other
- 10.1. Market Analysis, Insights and Forecast - by Application
- 11. Competitive Analysis
- 11.1. Global Market Share Analysis 2025
- 11.2. Company Profiles
- 11.2.1 SGL Carbon
- 11.2.1.1. Overview
- 11.2.1.2. Products
- 11.2.1.3. SWOT Analysis
- 11.2.1.4. Recent Developments
- 11.2.1.5. Financials (Based on Availability)
- 11.2.2 Zoltek
- 11.2.2.1. Overview
- 11.2.2.2. Products
- 11.2.2.3. SWOT Analysis
- 11.2.2.4. Recent Developments
- 11.2.2.5. Financials (Based on Availability)
- 11.2.3 Teijin
- 11.2.3.1. Overview
- 11.2.3.2. Products
- 11.2.3.3. SWOT Analysis
- 11.2.3.4. Recent Developments
- 11.2.3.5. Financials (Based on Availability)
- 11.2.4 Jilin Tangu Carbon Fiber
- 11.2.4.1. Overview
- 11.2.4.2. Products
- 11.2.4.3. SWOT Analysis
- 11.2.4.4. Recent Developments
- 11.2.4.5. Financials (Based on Availability)
- 11.2.5 Xunyun Special Fiber Technology
- 11.2.5.1. Overview
- 11.2.5.2. Products
- 11.2.5.3. SWOT Analysis
- 11.2.5.4. Recent Developments
- 11.2.5.5. Financials (Based on Availability)
- 11.2.6 Sinopec Shanghai Petrochemical
- 11.2.6.1. Overview
- 11.2.6.2. Products
- 11.2.6.3. SWOT Analysis
- 11.2.6.4. Recent Developments
- 11.2.6.5. Financials (Based on Availability)
- 11.2.1 SGL Carbon
List of Figures
- Figure 1: Global PAN Pre-oxidized Fibers Revenue Breakdown (undefined, %) by Region 2025 & 2033
- Figure 2: Global PAN Pre-oxidized Fibers Volume Breakdown (K, %) by Region 2025 & 2033
- Figure 3: North America PAN Pre-oxidized Fibers Revenue (undefined), by Application 2025 & 2033
- Figure 4: North America PAN Pre-oxidized Fibers Volume (K), by Application 2025 & 2033
- Figure 5: North America PAN Pre-oxidized Fibers Revenue Share (%), by Application 2025 & 2033
- Figure 6: North America PAN Pre-oxidized Fibers Volume Share (%), by Application 2025 & 2033
- Figure 7: North America PAN Pre-oxidized Fibers Revenue (undefined), by Types 2025 & 2033
- Figure 8: North America PAN Pre-oxidized Fibers Volume (K), by Types 2025 & 2033
- Figure 9: North America PAN Pre-oxidized Fibers Revenue Share (%), by Types 2025 & 2033
- Figure 10: North America PAN Pre-oxidized Fibers Volume Share (%), by Types 2025 & 2033
- Figure 11: North America PAN Pre-oxidized Fibers Revenue (undefined), by Country 2025 & 2033
- Figure 12: North America PAN Pre-oxidized Fibers Volume (K), by Country 2025 & 2033
- Figure 13: North America PAN Pre-oxidized Fibers Revenue Share (%), by Country 2025 & 2033
- Figure 14: North America PAN Pre-oxidized Fibers Volume Share (%), by Country 2025 & 2033
- Figure 15: South America PAN Pre-oxidized Fibers Revenue (undefined), by Application 2025 & 2033
- Figure 16: South America PAN Pre-oxidized Fibers Volume (K), by Application 2025 & 2033
- Figure 17: South America PAN Pre-oxidized Fibers Revenue Share (%), by Application 2025 & 2033
- Figure 18: South America PAN Pre-oxidized Fibers Volume Share (%), by Application 2025 & 2033
- Figure 19: South America PAN Pre-oxidized Fibers Revenue (undefined), by Types 2025 & 2033
- Figure 20: South America PAN Pre-oxidized Fibers Volume (K), by Types 2025 & 2033
- Figure 21: South America PAN Pre-oxidized Fibers Revenue Share (%), by Types 2025 & 2033
- Figure 22: South America PAN Pre-oxidized Fibers Volume Share (%), by Types 2025 & 2033
- Figure 23: South America PAN Pre-oxidized Fibers Revenue (undefined), by Country 2025 & 2033
- Figure 24: South America PAN Pre-oxidized Fibers Volume (K), by Country 2025 & 2033
- Figure 25: South America PAN Pre-oxidized Fibers Revenue Share (%), by Country 2025 & 2033
- Figure 26: South America PAN Pre-oxidized Fibers Volume Share (%), by Country 2025 & 2033
- Figure 27: Europe PAN Pre-oxidized Fibers Revenue (undefined), by Application 2025 & 2033
- Figure 28: Europe PAN Pre-oxidized Fibers Volume (K), by Application 2025 & 2033
- Figure 29: Europe PAN Pre-oxidized Fibers Revenue Share (%), by Application 2025 & 2033
- Figure 30: Europe PAN Pre-oxidized Fibers Volume Share (%), by Application 2025 & 2033
- Figure 31: Europe PAN Pre-oxidized Fibers Revenue (undefined), by Types 2025 & 2033
- Figure 32: Europe PAN Pre-oxidized Fibers Volume (K), by Types 2025 & 2033
- Figure 33: Europe PAN Pre-oxidized Fibers Revenue Share (%), by Types 2025 & 2033
- Figure 34: Europe PAN Pre-oxidized Fibers Volume Share (%), by Types 2025 & 2033
- Figure 35: Europe PAN Pre-oxidized Fibers Revenue (undefined), by Country 2025 & 2033
- Figure 36: Europe PAN Pre-oxidized Fibers Volume (K), by Country 2025 & 2033
- Figure 37: Europe PAN Pre-oxidized Fibers Revenue Share (%), by Country 2025 & 2033
- Figure 38: Europe PAN Pre-oxidized Fibers Volume Share (%), by Country 2025 & 2033
- Figure 39: Middle East & Africa PAN Pre-oxidized Fibers Revenue (undefined), by Application 2025 & 2033
- Figure 40: Middle East & Africa PAN Pre-oxidized Fibers Volume (K), by Application 2025 & 2033
- Figure 41: Middle East & Africa PAN Pre-oxidized Fibers Revenue Share (%), by Application 2025 & 2033
- Figure 42: Middle East & Africa PAN Pre-oxidized Fibers Volume Share (%), by Application 2025 & 2033
- Figure 43: Middle East & Africa PAN Pre-oxidized Fibers Revenue (undefined), by Types 2025 & 2033
- Figure 44: Middle East & Africa PAN Pre-oxidized Fibers Volume (K), by Types 2025 & 2033
- Figure 45: Middle East & Africa PAN Pre-oxidized Fibers Revenue Share (%), by Types 2025 & 2033
- Figure 46: Middle East & Africa PAN Pre-oxidized Fibers Volume Share (%), by Types 2025 & 2033
- Figure 47: Middle East & Africa PAN Pre-oxidized Fibers Revenue (undefined), by Country 2025 & 2033
- Figure 48: Middle East & Africa PAN Pre-oxidized Fibers Volume (K), by Country 2025 & 2033
- Figure 49: Middle East & Africa PAN Pre-oxidized Fibers Revenue Share (%), by Country 2025 & 2033
- Figure 50: Middle East & Africa PAN Pre-oxidized Fibers Volume Share (%), by Country 2025 & 2033
- Figure 51: Asia Pacific PAN Pre-oxidized Fibers Revenue (undefined), by Application 2025 & 2033
- Figure 52: Asia Pacific PAN Pre-oxidized Fibers Volume (K), by Application 2025 & 2033
- Figure 53: Asia Pacific PAN Pre-oxidized Fibers Revenue Share (%), by Application 2025 & 2033
- Figure 54: Asia Pacific PAN Pre-oxidized Fibers Volume Share (%), by Application 2025 & 2033
- Figure 55: Asia Pacific PAN Pre-oxidized Fibers Revenue (undefined), by Types 2025 & 2033
- Figure 56: Asia Pacific PAN Pre-oxidized Fibers Volume (K), by Types 2025 & 2033
- Figure 57: Asia Pacific PAN Pre-oxidized Fibers Revenue Share (%), by Types 2025 & 2033
- Figure 58: Asia Pacific PAN Pre-oxidized Fibers Volume Share (%), by Types 2025 & 2033
- Figure 59: Asia Pacific PAN Pre-oxidized Fibers Revenue (undefined), by Country 2025 & 2033
- Figure 60: Asia Pacific PAN Pre-oxidized Fibers Volume (K), by Country 2025 & 2033
- Figure 61: Asia Pacific PAN Pre-oxidized Fibers Revenue Share (%), by Country 2025 & 2033
- Figure 62: Asia Pacific PAN Pre-oxidized Fibers Volume Share (%), by Country 2025 & 2033
List of Tables
- Table 1: Global PAN Pre-oxidized Fibers Revenue undefined Forecast, by Application 2020 & 2033
- Table 2: Global PAN Pre-oxidized Fibers Volume K Forecast, by Application 2020 & 2033
- Table 3: Global PAN Pre-oxidized Fibers Revenue undefined Forecast, by Types 2020 & 2033
- Table 4: Global PAN Pre-oxidized Fibers Volume K Forecast, by Types 2020 & 2033
- Table 5: Global PAN Pre-oxidized Fibers Revenue undefined Forecast, by Region 2020 & 2033
- Table 6: Global PAN Pre-oxidized Fibers Volume K Forecast, by Region 2020 & 2033
- Table 7: Global PAN Pre-oxidized Fibers Revenue undefined Forecast, by Application 2020 & 2033
- Table 8: Global PAN Pre-oxidized Fibers Volume K Forecast, by Application 2020 & 2033
- Table 9: Global PAN Pre-oxidized Fibers Revenue undefined Forecast, by Types 2020 & 2033
- Table 10: Global PAN Pre-oxidized Fibers Volume K Forecast, by Types 2020 & 2033
- Table 11: Global PAN Pre-oxidized Fibers Revenue undefined Forecast, by Country 2020 & 2033
- Table 12: Global PAN Pre-oxidized Fibers Volume K Forecast, by Country 2020 & 2033
- Table 13: United States PAN Pre-oxidized Fibers Revenue (undefined) Forecast, by Application 2020 & 2033
- Table 14: United States PAN Pre-oxidized Fibers Volume (K) Forecast, by Application 2020 & 2033
- Table 15: Canada PAN Pre-oxidized Fibers Revenue (undefined) Forecast, by Application 2020 & 2033
- Table 16: Canada PAN Pre-oxidized Fibers Volume (K) Forecast, by Application 2020 & 2033
- Table 17: Mexico PAN Pre-oxidized Fibers Revenue (undefined) Forecast, by Application 2020 & 2033
- Table 18: Mexico PAN Pre-oxidized Fibers Volume (K) Forecast, by Application 2020 & 2033
- Table 19: Global PAN Pre-oxidized Fibers Revenue undefined Forecast, by Application 2020 & 2033
- Table 20: Global PAN Pre-oxidized Fibers Volume K Forecast, by Application 2020 & 2033
- Table 21: Global PAN Pre-oxidized Fibers Revenue undefined Forecast, by Types 2020 & 2033
- Table 22: Global PAN Pre-oxidized Fibers Volume K Forecast, by Types 2020 & 2033
- Table 23: Global PAN Pre-oxidized Fibers Revenue undefined Forecast, by Country 2020 & 2033
- Table 24: Global PAN Pre-oxidized Fibers Volume K Forecast, by Country 2020 & 2033
- Table 25: Brazil PAN Pre-oxidized Fibers Revenue (undefined) Forecast, by Application 2020 & 2033
- Table 26: Brazil PAN Pre-oxidized Fibers Volume (K) Forecast, by Application 2020 & 2033
- Table 27: Argentina PAN Pre-oxidized Fibers Revenue (undefined) Forecast, by Application 2020 & 2033
- Table 28: Argentina PAN Pre-oxidized Fibers Volume (K) Forecast, by Application 2020 & 2033
- Table 29: Rest of South America PAN Pre-oxidized Fibers Revenue (undefined) Forecast, by Application 2020 & 2033
- Table 30: Rest of South America PAN Pre-oxidized Fibers Volume (K) Forecast, by Application 2020 & 2033
- Table 31: Global PAN Pre-oxidized Fibers Revenue undefined Forecast, by Application 2020 & 2033
- Table 32: Global PAN Pre-oxidized Fibers Volume K Forecast, by Application 2020 & 2033
- Table 33: Global PAN Pre-oxidized Fibers Revenue undefined Forecast, by Types 2020 & 2033
- Table 34: Global PAN Pre-oxidized Fibers Volume K Forecast, by Types 2020 & 2033
- Table 35: Global PAN Pre-oxidized Fibers Revenue undefined Forecast, by Country 2020 & 2033
- Table 36: Global PAN Pre-oxidized Fibers Volume K Forecast, by Country 2020 & 2033
- Table 37: United Kingdom PAN Pre-oxidized Fibers Revenue (undefined) Forecast, by Application 2020 & 2033
- Table 38: United Kingdom PAN Pre-oxidized Fibers Volume (K) Forecast, by Application 2020 & 2033
- Table 39: Germany PAN Pre-oxidized Fibers Revenue (undefined) Forecast, by Application 2020 & 2033
- Table 40: Germany PAN Pre-oxidized Fibers Volume (K) Forecast, by Application 2020 & 2033
- Table 41: France PAN Pre-oxidized Fibers Revenue (undefined) Forecast, by Application 2020 & 2033
- Table 42: France PAN Pre-oxidized Fibers Volume (K) Forecast, by Application 2020 & 2033
- Table 43: Italy PAN Pre-oxidized Fibers Revenue (undefined) Forecast, by Application 2020 & 2033
- Table 44: Italy PAN Pre-oxidized Fibers Volume (K) Forecast, by Application 2020 & 2033
- Table 45: Spain PAN Pre-oxidized Fibers Revenue (undefined) Forecast, by Application 2020 & 2033
- Table 46: Spain PAN Pre-oxidized Fibers Volume (K) Forecast, by Application 2020 & 2033
- Table 47: Russia PAN Pre-oxidized Fibers Revenue (undefined) Forecast, by Application 2020 & 2033
- Table 48: Russia PAN Pre-oxidized Fibers Volume (K) Forecast, by Application 2020 & 2033
- Table 49: Benelux PAN Pre-oxidized Fibers Revenue (undefined) Forecast, by Application 2020 & 2033
- Table 50: Benelux PAN Pre-oxidized Fibers Volume (K) Forecast, by Application 2020 & 2033
- Table 51: Nordics PAN Pre-oxidized Fibers Revenue (undefined) Forecast, by Application 2020 & 2033
- Table 52: Nordics PAN Pre-oxidized Fibers Volume (K) Forecast, by Application 2020 & 2033
- Table 53: Rest of Europe PAN Pre-oxidized Fibers Revenue (undefined) Forecast, by Application 2020 & 2033
- Table 54: Rest of Europe PAN Pre-oxidized Fibers Volume (K) Forecast, by Application 2020 & 2033
- Table 55: Global PAN Pre-oxidized Fibers Revenue undefined Forecast, by Application 2020 & 2033
- Table 56: Global PAN Pre-oxidized Fibers Volume K Forecast, by Application 2020 & 2033
- Table 57: Global PAN Pre-oxidized Fibers Revenue undefined Forecast, by Types 2020 & 2033
- Table 58: Global PAN Pre-oxidized Fibers Volume K Forecast, by Types 2020 & 2033
- Table 59: Global PAN Pre-oxidized Fibers Revenue undefined Forecast, by Country 2020 & 2033
- Table 60: Global PAN Pre-oxidized Fibers Volume K Forecast, by Country 2020 & 2033
- Table 61: Turkey PAN Pre-oxidized Fibers Revenue (undefined) Forecast, by Application 2020 & 2033
- Table 62: Turkey PAN Pre-oxidized Fibers Volume (K) Forecast, by Application 2020 & 2033
- Table 63: Israel PAN Pre-oxidized Fibers Revenue (undefined) Forecast, by Application 2020 & 2033
- Table 64: Israel PAN Pre-oxidized Fibers Volume (K) Forecast, by Application 2020 & 2033
- Table 65: GCC PAN Pre-oxidized Fibers Revenue (undefined) Forecast, by Application 2020 & 2033
- Table 66: GCC PAN Pre-oxidized Fibers Volume (K) Forecast, by Application 2020 & 2033
- Table 67: North Africa PAN Pre-oxidized Fibers Revenue (undefined) Forecast, by Application 2020 & 2033
- Table 68: North Africa PAN Pre-oxidized Fibers Volume (K) Forecast, by Application 2020 & 2033
- Table 69: South Africa PAN Pre-oxidized Fibers Revenue (undefined) Forecast, by Application 2020 & 2033
- Table 70: South Africa PAN Pre-oxidized Fibers Volume (K) Forecast, by Application 2020 & 2033
- Table 71: Rest of Middle East & Africa PAN Pre-oxidized Fibers Revenue (undefined) Forecast, by Application 2020 & 2033
- Table 72: Rest of Middle East & Africa PAN Pre-oxidized Fibers Volume (K) Forecast, by Application 2020 & 2033
- Table 73: Global PAN Pre-oxidized Fibers Revenue undefined Forecast, by Application 2020 & 2033
- Table 74: Global PAN Pre-oxidized Fibers Volume K Forecast, by Application 2020 & 2033
- Table 75: Global PAN Pre-oxidized Fibers Revenue undefined Forecast, by Types 2020 & 2033
- Table 76: Global PAN Pre-oxidized Fibers Volume K Forecast, by Types 2020 & 2033
- Table 77: Global PAN Pre-oxidized Fibers Revenue undefined Forecast, by Country 2020 & 2033
- Table 78: Global PAN Pre-oxidized Fibers Volume K Forecast, by Country 2020 & 2033
- Table 79: China PAN Pre-oxidized Fibers Revenue (undefined) Forecast, by Application 2020 & 2033
- Table 80: China PAN Pre-oxidized Fibers Volume (K) Forecast, by Application 2020 & 2033
- Table 81: India PAN Pre-oxidized Fibers Revenue (undefined) Forecast, by Application 2020 & 2033
- Table 82: India PAN Pre-oxidized Fibers Volume (K) Forecast, by Application 2020 & 2033
- Table 83: Japan PAN Pre-oxidized Fibers Revenue (undefined) Forecast, by Application 2020 & 2033
- Table 84: Japan PAN Pre-oxidized Fibers Volume (K) Forecast, by Application 2020 & 2033
- Table 85: South Korea PAN Pre-oxidized Fibers Revenue (undefined) Forecast, by Application 2020 & 2033
- Table 86: South Korea PAN Pre-oxidized Fibers Volume (K) Forecast, by Application 2020 & 2033
- Table 87: ASEAN PAN Pre-oxidized Fibers Revenue (undefined) Forecast, by Application 2020 & 2033
- Table 88: ASEAN PAN Pre-oxidized Fibers Volume (K) Forecast, by Application 2020 & 2033
- Table 89: Oceania PAN Pre-oxidized Fibers Revenue (undefined) Forecast, by Application 2020 & 2033
- Table 90: Oceania PAN Pre-oxidized Fibers Volume (K) Forecast, by Application 2020 & 2033
- Table 91: Rest of Asia Pacific PAN Pre-oxidized Fibers Revenue (undefined) Forecast, by Application 2020 & 2033
- Table 92: Rest of Asia Pacific PAN Pre-oxidized Fibers Volume (K) Forecast, by Application 2020 & 2033
Frequently Asked Questions
1. What is the projected Compound Annual Growth Rate (CAGR) of the PAN Pre-oxidized Fibers?
The projected CAGR is approximately 9.2%.
2. Which companies are prominent players in the PAN Pre-oxidized Fibers?
Key companies in the market include SGL Carbon, Zoltek, Teijin, Jilin Tangu Carbon Fiber, Xunyun Special Fiber Technology, Sinopec Shanghai Petrochemical.
3. What are the main segments of the PAN Pre-oxidized Fibers?
The market segments include Application, Types.
4. Can you provide details about the market size?
The market size is estimated to be USD XXX N/A as of 2022.
5. What are some drivers contributing to market growth?
N/A
6. What are the notable trends driving market growth?
N/A
7. Are there any restraints impacting market growth?
N/A
8. Can you provide examples of recent developments in the market?
N/A
9. What pricing options are available for accessing the report?
Pricing options include single-user, multi-user, and enterprise licenses priced at USD 3950.00, USD 5925.00, and USD 7900.00 respectively.
10. Is the market size provided in terms of value or volume?
The market size is provided in terms of value, measured in N/A and volume, measured in K.
11. Are there any specific market keywords associated with the report?
Yes, the market keyword associated with the report is "PAN Pre-oxidized Fibers," which aids in identifying and referencing the specific market segment covered.
12. How do I determine which pricing option suits my needs best?
The pricing options vary based on user requirements and access needs. Individual users may opt for single-user licenses, while businesses requiring broader access may choose multi-user or enterprise licenses for cost-effective access to the report.
13. Are there any additional resources or data provided in the PAN Pre-oxidized Fibers report?
While the report offers comprehensive insights, it's advisable to review the specific contents or supplementary materials provided to ascertain if additional resources or data are available.
14. How can I stay updated on further developments or reports in the PAN Pre-oxidized Fibers?
To stay informed about further developments, trends, and reports in the PAN Pre-oxidized Fibers, consider subscribing to industry newsletters, following relevant companies and organizations, or regularly checking reputable industry news sources and publications.
Methodology
Step 1 - Identification of Relevant Samples Size from Population Database


Step 2 - Approaches for Defining Global Market Size (Value, Volume* & Price*)

Note*: In applicable scenarios
Step 3 - Data Sources
Primary Research
- Web Analytics
- Survey Reports
- Research Institute
- Latest Research Reports
- Opinion Leaders
Secondary Research
- Annual Reports
- White Paper
- Latest Press Release
- Industry Association
- Paid Database
- Investor Presentations

Step 4 - Data Triangulation
Involves using different sources of information in order to increase the validity of a study
These sources are likely to be stakeholders in a program - participants, other researchers, program staff, other community members, and so on.
Then we put all data in single framework & apply various statistical tools to find out the dynamic on the market.
During the analysis stage, feedback from the stakeholder groups would be compared to determine areas of agreement as well as areas of divergence