

Key Insights
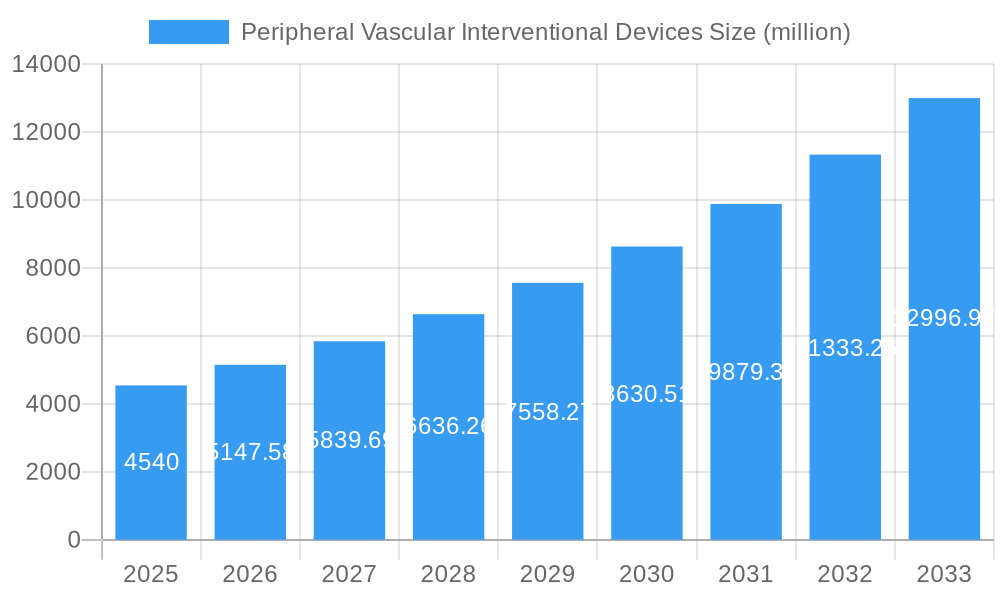
The Peripheral Vascular Interventional Devices (PVID) market is experiencing robust growth, projected to reach $4.54 billion in 2025 and maintain a Compound Annual Growth Rate (CAGR) of 13.7% from 2025 to 2033. This expansion is driven by several key factors. An aging global population with a higher prevalence of cardiovascular diseases, such as peripheral artery disease (PAD) and venous thromboembolism (VTE), significantly fuels demand for minimally invasive PVID procedures. Technological advancements, including the development of smaller, less invasive devices and improved imaging techniques, contribute to increased adoption rates and improved patient outcomes. Furthermore, rising healthcare expenditure and increased awareness of PVID treatments among both physicians and patients are driving market growth. The competitive landscape is characterized by a mix of established multinational corporations like Medtronic, Boston Scientific, and Abbott, alongside several regional players, fostering innovation and competition within the sector.
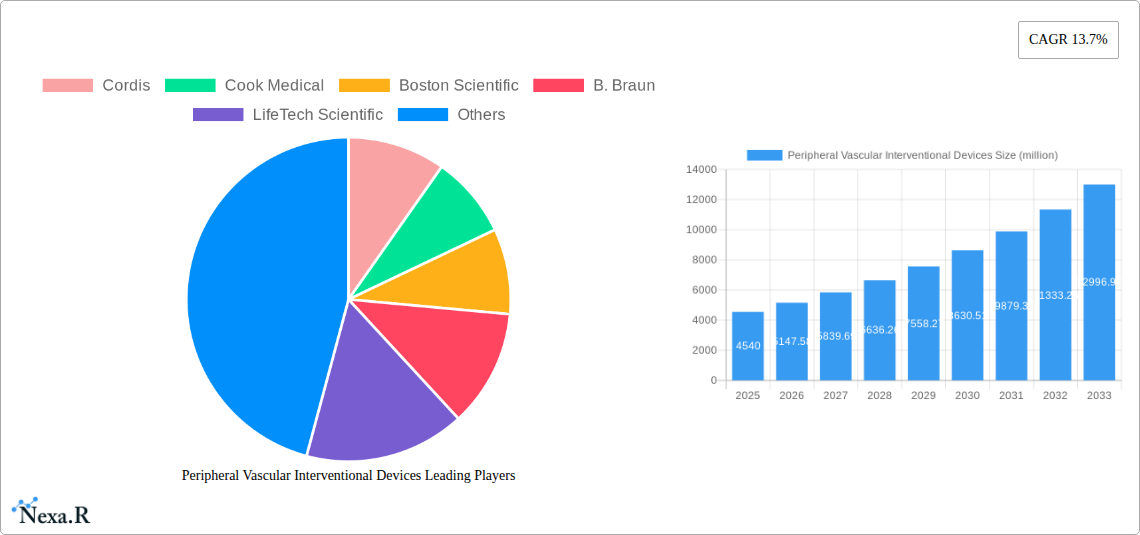
Peripheral Vascular Interventional Devices Market Size (In Billion)
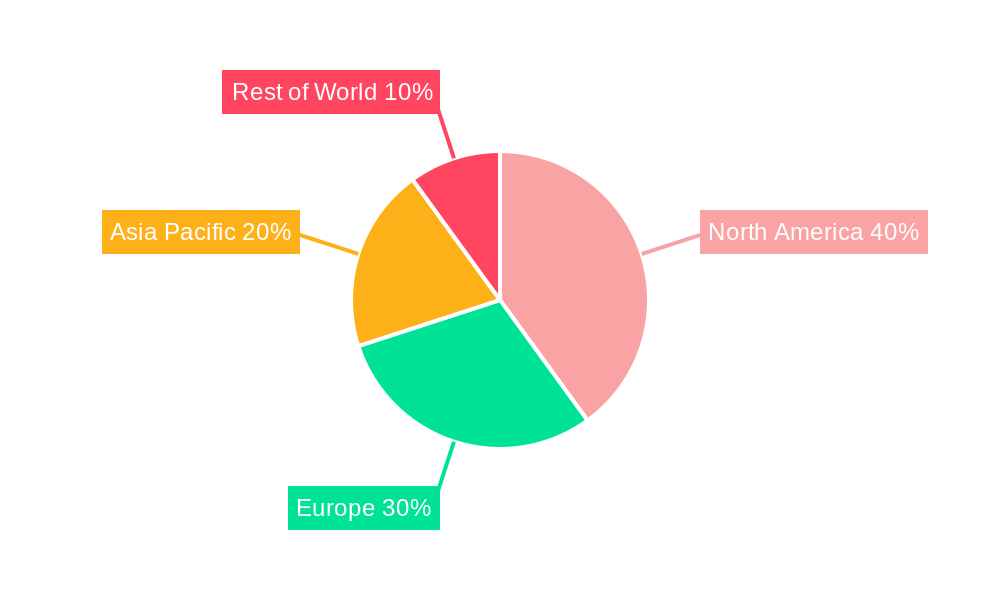
The market segmentation within PVID is complex, encompassing various device types (e.g., stents, catheters, guidewires, balloons) and applications (e.g., angioplasty, thrombectomy, embolization). While precise segment data is unavailable, it's reasonable to assume that angioplasty and related stenting procedures represent a significant portion of the market due to their prevalence in treating PAD. Geographic variations exist, with developed nations like North America and Europe holding a larger market share due to advanced healthcare infrastructure and higher per-capita healthcare spending. However, emerging economies in Asia and Latin America are witnessing rapid growth, driven by increasing awareness and affordability of PVID interventions. Challenges include the high cost of devices, the need for skilled professionals, and potential complications associated with invasive procedures. Despite these restraints, the overall market outlook for PVID remains highly positive, underpinned by the escalating burden of vascular diseases globally.
Peripheral Vascular Interventional Devices Company Market Share
Peripheral Vascular Interventional Devices Market Report: 2019-2033
This comprehensive report provides a detailed analysis of the Peripheral Vascular Interventional Devices market, encompassing market dynamics, growth trends, regional analysis, product landscape, key players, and future outlook. The report covers the period from 2019 to 2033, with a focus on the forecast period of 2025-2033 and a base year of 2025. The parent market is the broader medical devices market, while the child market is specifically peripheral vascular interventions. The market size is valued in millions of units.
Peripheral Vascular Interventional Devices Market Dynamics & Structure
This section analyzes the market's competitive landscape, technological advancements, regulatory influences, and market trends. The global market exhibits a moderately concentrated structure, with key players holding significant market share. Technological innovation, particularly in minimally invasive techniques and biocompatible materials, is a primary growth driver. Stringent regulatory frameworks, however, pose challenges to market entry and product approval. The presence of substitute therapies, such as open surgery, impacts market penetration. The end-user demographic primarily comprises aging populations with cardiovascular diseases. Mergers and acquisitions (M&A) activities are prevalent, with larger companies acquiring smaller, innovative firms to expand their product portfolios. Market concentration is estimated at xx%, with the top 5 players holding approximately xx% of the market share in 2025. M&A activity saw xx deals in 2024, valued at approximately $xx million.
- Market Concentration: Moderately concentrated, with top 5 players holding xx% market share (2025).
- Technological Innovation: Minimally invasive techniques, biocompatible materials, drug-eluting devices.
- Regulatory Landscape: Stringent FDA and CE mark approvals, impacting market entry.
- Competitive Substitutes: Open surgical procedures, alternative therapies.
- End-User Demographics: Aging population, increasing prevalence of cardiovascular diseases.
- M&A Activity: Significant activity in recent years, driving market consolidation. xx deals in 2024 valued at $xx million.
Peripheral Vascular Interventional Devices Growth Trends & Insights
The global peripheral vascular interventional devices market is experiencing robust growth, driven by factors such as an aging population, rising prevalence of cardiovascular diseases, and increasing adoption of minimally invasive procedures. The market size expanded from xx million units in 2019 to xx million units in 2024, exhibiting a CAGR of xx%. The adoption rate of these devices is expected to increase further, fueled by technological advancements and improved clinical outcomes. Technological disruptions, like the introduction of smart devices and AI-powered diagnostic tools, are transforming the market landscape. Consumer behavior is shifting toward minimally invasive procedures due to reduced recovery time and improved patient outcomes. By 2033, the market is projected to reach xx million units, with a forecast CAGR of xx% (2025-2033). Market penetration is estimated at xx% in 2025, projected to reach xx% by 2033.
Dominant Regions, Countries, or Segments in Peripheral Vascular Interventional Devices
North America currently holds the largest market share, driven by high healthcare expenditure, advanced medical infrastructure, and a large geriatric population. Europe follows as a significant market, with growing adoption rates and supportive government initiatives. Asia-Pacific is projected to exhibit the highest growth rate in the forecast period, fueled by rising disposable incomes, increasing healthcare awareness, and expanding medical infrastructure. Specifically, China and India are emerging as key markets within this region. The strong growth in the Asia-Pacific region is fueled by several factors:
- Economic Growth: Rising disposable incomes in key markets like China and India.
- Healthcare Infrastructure Development: Investments in hospitals and medical facilities.
- Government Initiatives: Supportive policies and reimbursement schemes.
- Increasing Awareness: Growing understanding of cardiovascular diseases and minimally invasive treatments.
North America's dominance is attributable to:
- High Healthcare Expenditure: Extensive investment in advanced medical technologies.
- Advanced Medical Infrastructure: Well-established healthcare systems and skilled medical professionals.
- Large Geriatric Population: Higher prevalence of cardiovascular diseases.
Peripheral Vascular Interventional Devices Product Landscape
The market encompasses a wide range of devices, including angioplasty balloons, stents, catheters, guidewires, and embolization devices. Recent innovations focus on drug-eluting devices, bioabsorbable materials, and minimally invasive techniques. These advancements offer improved clinical outcomes, reduced complications, and enhanced patient comfort. Unique selling propositions include faster recovery times, reduced hospital stays, and improved long-term efficacy.
Key Drivers, Barriers & Challenges in Peripheral Vascular Interventional Devices
Key Drivers:
- Aging population and rising prevalence of cardiovascular diseases: Increased demand for effective treatments.
- Technological advancements: Improved device efficacy, safety, and minimally invasive procedures.
- Favorable reimbursement policies: Support government policies that encourage the use of these devices.
Challenges & Restraints:
- High cost of devices: Limiting accessibility in certain markets.
- Stringent regulatory approvals: Creating barriers to market entry for new products.
- Potential complications and adverse events: Requires rigorous safety and efficacy testing.
- Supply chain disruptions: Impacting availability and pricing of devices.
Emerging Opportunities in Peripheral Vascular Interventional Devices
- Untapped markets in developing economies: Significant growth potential in regions with growing healthcare infrastructure.
- Innovation in biocompatible materials and drug-eluting technologies: Improvements in device performance and reduced side effects.
- Development of personalized medicine approaches: Tailoring treatments to individual patient needs.
Growth Accelerators in the Peripheral Vascular Interventional Devices Industry
Technological breakthroughs in minimally invasive techniques, the development of smart devices and AI-powered diagnostics, and strategic collaborations between device manufacturers and healthcare providers are key growth accelerators. Market expansion strategies, including penetration into emerging economies, are also driving market growth.
Key Players Shaping the Peripheral Vascular Interventional Devices Market
- Cordis
- Cook Medical
- Boston Scientific
- B. Braun
- LifeTech Scientific
- Philips
- Braile BIOMEDICA
- Argon Medical Devices
- BD
- Acotec Scientific Holdings
- Shanghai MicroPort Endovascular MedTech
- Zylox-Tonbridge Medical Technology
- Suzhou Tianhong Shengjie Medical Equipment
- Shandong Visee Medical Devices
- Medtronic
- Abbott
- Arjo
- Zimmer Biomet
- Breg
- Cardinal Health
Notable Milestones in Peripheral Vascular Interventional Devices Sector
- 2020: Launch of a novel drug-eluting stent by Boston Scientific.
- 2021: Acquisition of a smaller device company by Medtronic.
- 2022: FDA approval of a new minimally invasive procedure.
- 2023: Publication of a landmark clinical trial demonstrating improved patient outcomes.
- 2024: Strategic partnership between two leading device manufacturers to develop next-generation devices.
In-Depth Peripheral Vascular Interventional Devices Market Outlook
The peripheral vascular interventional devices market is poised for significant growth in the coming years, driven by continued technological advancements, increasing prevalence of cardiovascular diseases, and expansion into new markets. Strategic partnerships, focus on innovation, and efficient supply chain management will be crucial for success in this dynamic market. The market offers lucrative opportunities for both established players and new entrants, especially those with a focus on innovation and patient-centric solutions.
Peripheral Vascular Interventional Devices Segmentation
-
1. Application
- 1.1. Hospital
- 1.2. Clinic
-
2. Types
- 2.1. Veins
- 2.2. Peripheral Arteries
Peripheral Vascular Interventional Devices Segmentation By Geography
-
1. North America
- 1.1. United States
- 1.2. Canada
- 1.3. Mexico
-
2. South America
- 2.1. Brazil
- 2.2. Argentina
- 2.3. Rest of South America
-
3. Europe
- 3.1. United Kingdom
- 3.2. Germany
- 3.3. France
- 3.4. Italy
- 3.5. Spain
- 3.6. Russia
- 3.7. Benelux
- 3.8. Nordics
- 3.9. Rest of Europe
-
4. Middle East & Africa
- 4.1. Turkey
- 4.2. Israel
- 4.3. GCC
- 4.4. North Africa
- 4.5. South Africa
- 4.6. Rest of Middle East & Africa
-
5. Asia Pacific
- 5.1. China
- 5.2. India
- 5.3. Japan
- 5.4. South Korea
- 5.5. ASEAN
- 5.6. Oceania
- 5.7. Rest of Asia Pacific
Peripheral Vascular Interventional Devices Regional Market Share
Geographic Coverage of Peripheral Vascular Interventional Devices
Peripheral Vascular Interventional Devices REPORT HIGHLIGHTS
| Aspects | Details |
|---|---|
| Study Period | 2020-2034 |
| Base Year | 2025 |
| Estimated Year | 2026 |
| Forecast Period | 2026-2034 |
| Historical Period | 2020-2025 |
| Growth Rate | CAGR of 13.7% from 2020-2034 |
| Segmentation |
|
Table of Contents
- 1. Introduction
- 1.1. Research Scope
- 1.2. Market Segmentation
- 1.3. Research Methodology
- 1.4. Definitions and Assumptions
- 2. Executive Summary
- 2.1. Introduction
- 3. Market Dynamics
- 3.1. Introduction
- 3.2. Market Drivers
- 3.3. Market Restrains
- 3.4. Market Trends
- 4. Market Factor Analysis
- 4.1. Porters Five Forces
- 4.2. Supply/Value Chain
- 4.3. PESTEL analysis
- 4.4. Market Entropy
- 4.5. Patent/Trademark Analysis
- 5. Global Peripheral Vascular Interventional Devices Analysis, Insights and Forecast, 2020-2032
- 5.1. Market Analysis, Insights and Forecast - by Application
- 5.1.1. Hospital
- 5.1.2. Clinic
- 5.2. Market Analysis, Insights and Forecast - by Types
- 5.2.1. Veins
- 5.2.2. Peripheral Arteries
- 5.3. Market Analysis, Insights and Forecast - by Region
- 5.3.1. North America
- 5.3.2. South America
- 5.3.3. Europe
- 5.3.4. Middle East & Africa
- 5.3.5. Asia Pacific
- 5.1. Market Analysis, Insights and Forecast - by Application
- 6. North America Peripheral Vascular Interventional Devices Analysis, Insights and Forecast, 2020-2032
- 6.1. Market Analysis, Insights and Forecast - by Application
- 6.1.1. Hospital
- 6.1.2. Clinic
- 6.2. Market Analysis, Insights and Forecast - by Types
- 6.2.1. Veins
- 6.2.2. Peripheral Arteries
- 6.1. Market Analysis, Insights and Forecast - by Application
- 7. South America Peripheral Vascular Interventional Devices Analysis, Insights and Forecast, 2020-2032
- 7.1. Market Analysis, Insights and Forecast - by Application
- 7.1.1. Hospital
- 7.1.2. Clinic
- 7.2. Market Analysis, Insights and Forecast - by Types
- 7.2.1. Veins
- 7.2.2. Peripheral Arteries
- 7.1. Market Analysis, Insights and Forecast - by Application
- 8. Europe Peripheral Vascular Interventional Devices Analysis, Insights and Forecast, 2020-2032
- 8.1. Market Analysis, Insights and Forecast - by Application
- 8.1.1. Hospital
- 8.1.2. Clinic
- 8.2. Market Analysis, Insights and Forecast - by Types
- 8.2.1. Veins
- 8.2.2. Peripheral Arteries
- 8.1. Market Analysis, Insights and Forecast - by Application
- 9. Middle East & Africa Peripheral Vascular Interventional Devices Analysis, Insights and Forecast, 2020-2032
- 9.1. Market Analysis, Insights and Forecast - by Application
- 9.1.1. Hospital
- 9.1.2. Clinic
- 9.2. Market Analysis, Insights and Forecast - by Types
- 9.2.1. Veins
- 9.2.2. Peripheral Arteries
- 9.1. Market Analysis, Insights and Forecast - by Application
- 10. Asia Pacific Peripheral Vascular Interventional Devices Analysis, Insights and Forecast, 2020-2032
- 10.1. Market Analysis, Insights and Forecast - by Application
- 10.1.1. Hospital
- 10.1.2. Clinic
- 10.2. Market Analysis, Insights and Forecast - by Types
- 10.2.1. Veins
- 10.2.2. Peripheral Arteries
- 10.1. Market Analysis, Insights and Forecast - by Application
- 11. Competitive Analysis
- 11.1. Global Market Share Analysis 2025
- 11.2. Company Profiles
- 11.2.1 Cordis
- 11.2.1.1. Overview
- 11.2.1.2. Products
- 11.2.1.3. SWOT Analysis
- 11.2.1.4. Recent Developments
- 11.2.1.5. Financials (Based on Availability)
- 11.2.2 Cook Medical
- 11.2.2.1. Overview
- 11.2.2.2. Products
- 11.2.2.3. SWOT Analysis
- 11.2.2.4. Recent Developments
- 11.2.2.5. Financials (Based on Availability)
- 11.2.3 Boston Scientific
- 11.2.3.1. Overview
- 11.2.3.2. Products
- 11.2.3.3. SWOT Analysis
- 11.2.3.4. Recent Developments
- 11.2.3.5. Financials (Based on Availability)
- 11.2.4 B. Braun
- 11.2.4.1. Overview
- 11.2.4.2. Products
- 11.2.4.3. SWOT Analysis
- 11.2.4.4. Recent Developments
- 11.2.4.5. Financials (Based on Availability)
- 11.2.5 LifeTech Scientific
- 11.2.5.1. Overview
- 11.2.5.2. Products
- 11.2.5.3. SWOT Analysis
- 11.2.5.4. Recent Developments
- 11.2.5.5. Financials (Based on Availability)
- 11.2.6 Philips
- 11.2.6.1. Overview
- 11.2.6.2. Products
- 11.2.6.3. SWOT Analysis
- 11.2.6.4. Recent Developments
- 11.2.6.5. Financials (Based on Availability)
- 11.2.7 Braile BIOMEDICA
- 11.2.7.1. Overview
- 11.2.7.2. Products
- 11.2.7.3. SWOT Analysis
- 11.2.7.4. Recent Developments
- 11.2.7.5. Financials (Based on Availability)
- 11.2.8 Argon Medical Devices
- 11.2.8.1. Overview
- 11.2.8.2. Products
- 11.2.8.3. SWOT Analysis
- 11.2.8.4. Recent Developments
- 11.2.8.5. Financials (Based on Availability)
- 11.2.9 BD
- 11.2.9.1. Overview
- 11.2.9.2. Products
- 11.2.9.3. SWOT Analysis
- 11.2.9.4. Recent Developments
- 11.2.9.5. Financials (Based on Availability)
- 11.2.10 Acotec Scientific Holdings
- 11.2.10.1. Overview
- 11.2.10.2. Products
- 11.2.10.3. SWOT Analysis
- 11.2.10.4. Recent Developments
- 11.2.10.5. Financials (Based on Availability)
- 11.2.11 Shanghai MicroPort Endovascular MedTech
- 11.2.11.1. Overview
- 11.2.11.2. Products
- 11.2.11.3. SWOT Analysis
- 11.2.11.4. Recent Developments
- 11.2.11.5. Financials (Based on Availability)
- 11.2.12 Zylox-Tonbridge Medical Technology
- 11.2.12.1. Overview
- 11.2.12.2. Products
- 11.2.12.3. SWOT Analysis
- 11.2.12.4. Recent Developments
- 11.2.12.5. Financials (Based on Availability)
- 11.2.13 Suzhou Tianhong Shengjie Medical Equipment
- 11.2.13.1. Overview
- 11.2.13.2. Products
- 11.2.13.3. SWOT Analysis
- 11.2.13.4. Recent Developments
- 11.2.13.5. Financials (Based on Availability)
- 11.2.14 Shandong Visee Medical Devices
- 11.2.14.1. Overview
- 11.2.14.2. Products
- 11.2.14.3. SWOT Analysis
- 11.2.14.4. Recent Developments
- 11.2.14.5. Financials (Based on Availability)
- 11.2.15 Medtronic
- 11.2.15.1. Overview
- 11.2.15.2. Products
- 11.2.15.3. SWOT Analysis
- 11.2.15.4. Recent Developments
- 11.2.15.5. Financials (Based on Availability)
- 11.2.16 Abbott
- 11.2.16.1. Overview
- 11.2.16.2. Products
- 11.2.16.3. SWOT Analysis
- 11.2.16.4. Recent Developments
- 11.2.16.5. Financials (Based on Availability)
- 11.2.17 Arjo
- 11.2.17.1. Overview
- 11.2.17.2. Products
- 11.2.17.3. SWOT Analysis
- 11.2.17.4. Recent Developments
- 11.2.17.5. Financials (Based on Availability)
- 11.2.18 Zimmer Biomet
- 11.2.18.1. Overview
- 11.2.18.2. Products
- 11.2.18.3. SWOT Analysis
- 11.2.18.4. Recent Developments
- 11.2.18.5. Financials (Based on Availability)
- 11.2.19 Breg
- 11.2.19.1. Overview
- 11.2.19.2. Products
- 11.2.19.3. SWOT Analysis
- 11.2.19.4. Recent Developments
- 11.2.19.5. Financials (Based on Availability)
- 11.2.20 Cardinal Health
- 11.2.20.1. Overview
- 11.2.20.2. Products
- 11.2.20.3. SWOT Analysis
- 11.2.20.4. Recent Developments
- 11.2.20.5. Financials (Based on Availability)
- 11.2.1 Cordis
List of Figures
- Figure 1: Global Peripheral Vascular Interventional Devices Revenue Breakdown (million, %) by Region 2025 & 2033
- Figure 2: Global Peripheral Vascular Interventional Devices Volume Breakdown (K, %) by Region 2025 & 2033
- Figure 3: North America Peripheral Vascular Interventional Devices Revenue (million), by Application 2025 & 2033
- Figure 4: North America Peripheral Vascular Interventional Devices Volume (K), by Application 2025 & 2033
- Figure 5: North America Peripheral Vascular Interventional Devices Revenue Share (%), by Application 2025 & 2033
- Figure 6: North America Peripheral Vascular Interventional Devices Volume Share (%), by Application 2025 & 2033
- Figure 7: North America Peripheral Vascular Interventional Devices Revenue (million), by Types 2025 & 2033
- Figure 8: North America Peripheral Vascular Interventional Devices Volume (K), by Types 2025 & 2033
- Figure 9: North America Peripheral Vascular Interventional Devices Revenue Share (%), by Types 2025 & 2033
- Figure 10: North America Peripheral Vascular Interventional Devices Volume Share (%), by Types 2025 & 2033
- Figure 11: North America Peripheral Vascular Interventional Devices Revenue (million), by Country 2025 & 2033
- Figure 12: North America Peripheral Vascular Interventional Devices Volume (K), by Country 2025 & 2033
- Figure 13: North America Peripheral Vascular Interventional Devices Revenue Share (%), by Country 2025 & 2033
- Figure 14: North America Peripheral Vascular Interventional Devices Volume Share (%), by Country 2025 & 2033
- Figure 15: South America Peripheral Vascular Interventional Devices Revenue (million), by Application 2025 & 2033
- Figure 16: South America Peripheral Vascular Interventional Devices Volume (K), by Application 2025 & 2033
- Figure 17: South America Peripheral Vascular Interventional Devices Revenue Share (%), by Application 2025 & 2033
- Figure 18: South America Peripheral Vascular Interventional Devices Volume Share (%), by Application 2025 & 2033
- Figure 19: South America Peripheral Vascular Interventional Devices Revenue (million), by Types 2025 & 2033
- Figure 20: South America Peripheral Vascular Interventional Devices Volume (K), by Types 2025 & 2033
- Figure 21: South America Peripheral Vascular Interventional Devices Revenue Share (%), by Types 2025 & 2033
- Figure 22: South America Peripheral Vascular Interventional Devices Volume Share (%), by Types 2025 & 2033
- Figure 23: South America Peripheral Vascular Interventional Devices Revenue (million), by Country 2025 & 2033
- Figure 24: South America Peripheral Vascular Interventional Devices Volume (K), by Country 2025 & 2033
- Figure 25: South America Peripheral Vascular Interventional Devices Revenue Share (%), by Country 2025 & 2033
- Figure 26: South America Peripheral Vascular Interventional Devices Volume Share (%), by Country 2025 & 2033
- Figure 27: Europe Peripheral Vascular Interventional Devices Revenue (million), by Application 2025 & 2033
- Figure 28: Europe Peripheral Vascular Interventional Devices Volume (K), by Application 2025 & 2033
- Figure 29: Europe Peripheral Vascular Interventional Devices Revenue Share (%), by Application 2025 & 2033
- Figure 30: Europe Peripheral Vascular Interventional Devices Volume Share (%), by Application 2025 & 2033
- Figure 31: Europe Peripheral Vascular Interventional Devices Revenue (million), by Types 2025 & 2033
- Figure 32: Europe Peripheral Vascular Interventional Devices Volume (K), by Types 2025 & 2033
- Figure 33: Europe Peripheral Vascular Interventional Devices Revenue Share (%), by Types 2025 & 2033
- Figure 34: Europe Peripheral Vascular Interventional Devices Volume Share (%), by Types 2025 & 2033
- Figure 35: Europe Peripheral Vascular Interventional Devices Revenue (million), by Country 2025 & 2033
- Figure 36: Europe Peripheral Vascular Interventional Devices Volume (K), by Country 2025 & 2033
- Figure 37: Europe Peripheral Vascular Interventional Devices Revenue Share (%), by Country 2025 & 2033
- Figure 38: Europe Peripheral Vascular Interventional Devices Volume Share (%), by Country 2025 & 2033
- Figure 39: Middle East & Africa Peripheral Vascular Interventional Devices Revenue (million), by Application 2025 & 2033
- Figure 40: Middle East & Africa Peripheral Vascular Interventional Devices Volume (K), by Application 2025 & 2033
- Figure 41: Middle East & Africa Peripheral Vascular Interventional Devices Revenue Share (%), by Application 2025 & 2033
- Figure 42: Middle East & Africa Peripheral Vascular Interventional Devices Volume Share (%), by Application 2025 & 2033
- Figure 43: Middle East & Africa Peripheral Vascular Interventional Devices Revenue (million), by Types 2025 & 2033
- Figure 44: Middle East & Africa Peripheral Vascular Interventional Devices Volume (K), by Types 2025 & 2033
- Figure 45: Middle East & Africa Peripheral Vascular Interventional Devices Revenue Share (%), by Types 2025 & 2033
- Figure 46: Middle East & Africa Peripheral Vascular Interventional Devices Volume Share (%), by Types 2025 & 2033
- Figure 47: Middle East & Africa Peripheral Vascular Interventional Devices Revenue (million), by Country 2025 & 2033
- Figure 48: Middle East & Africa Peripheral Vascular Interventional Devices Volume (K), by Country 2025 & 2033
- Figure 49: Middle East & Africa Peripheral Vascular Interventional Devices Revenue Share (%), by Country 2025 & 2033
- Figure 50: Middle East & Africa Peripheral Vascular Interventional Devices Volume Share (%), by Country 2025 & 2033
- Figure 51: Asia Pacific Peripheral Vascular Interventional Devices Revenue (million), by Application 2025 & 2033
- Figure 52: Asia Pacific Peripheral Vascular Interventional Devices Volume (K), by Application 2025 & 2033
- Figure 53: Asia Pacific Peripheral Vascular Interventional Devices Revenue Share (%), by Application 2025 & 2033
- Figure 54: Asia Pacific Peripheral Vascular Interventional Devices Volume Share (%), by Application 2025 & 2033
- Figure 55: Asia Pacific Peripheral Vascular Interventional Devices Revenue (million), by Types 2025 & 2033
- Figure 56: Asia Pacific Peripheral Vascular Interventional Devices Volume (K), by Types 2025 & 2033
- Figure 57: Asia Pacific Peripheral Vascular Interventional Devices Revenue Share (%), by Types 2025 & 2033
- Figure 58: Asia Pacific Peripheral Vascular Interventional Devices Volume Share (%), by Types 2025 & 2033
- Figure 59: Asia Pacific Peripheral Vascular Interventional Devices Revenue (million), by Country 2025 & 2033
- Figure 60: Asia Pacific Peripheral Vascular Interventional Devices Volume (K), by Country 2025 & 2033
- Figure 61: Asia Pacific Peripheral Vascular Interventional Devices Revenue Share (%), by Country 2025 & 2033
- Figure 62: Asia Pacific Peripheral Vascular Interventional Devices Volume Share (%), by Country 2025 & 2033
List of Tables
- Table 1: Global Peripheral Vascular Interventional Devices Revenue million Forecast, by Application 2020 & 2033
- Table 2: Global Peripheral Vascular Interventional Devices Volume K Forecast, by Application 2020 & 2033
- Table 3: Global Peripheral Vascular Interventional Devices Revenue million Forecast, by Types 2020 & 2033
- Table 4: Global Peripheral Vascular Interventional Devices Volume K Forecast, by Types 2020 & 2033
- Table 5: Global Peripheral Vascular Interventional Devices Revenue million Forecast, by Region 2020 & 2033
- Table 6: Global Peripheral Vascular Interventional Devices Volume K Forecast, by Region 2020 & 2033
- Table 7: Global Peripheral Vascular Interventional Devices Revenue million Forecast, by Application 2020 & 2033
- Table 8: Global Peripheral Vascular Interventional Devices Volume K Forecast, by Application 2020 & 2033
- Table 9: Global Peripheral Vascular Interventional Devices Revenue million Forecast, by Types 2020 & 2033
- Table 10: Global Peripheral Vascular Interventional Devices Volume K Forecast, by Types 2020 & 2033
- Table 11: Global Peripheral Vascular Interventional Devices Revenue million Forecast, by Country 2020 & 2033
- Table 12: Global Peripheral Vascular Interventional Devices Volume K Forecast, by Country 2020 & 2033
- Table 13: United States Peripheral Vascular Interventional Devices Revenue (million) Forecast, by Application 2020 & 2033
- Table 14: United States Peripheral Vascular Interventional Devices Volume (K) Forecast, by Application 2020 & 2033
- Table 15: Canada Peripheral Vascular Interventional Devices Revenue (million) Forecast, by Application 2020 & 2033
- Table 16: Canada Peripheral Vascular Interventional Devices Volume (K) Forecast, by Application 2020 & 2033
- Table 17: Mexico Peripheral Vascular Interventional Devices Revenue (million) Forecast, by Application 2020 & 2033
- Table 18: Mexico Peripheral Vascular Interventional Devices Volume (K) Forecast, by Application 2020 & 2033
- Table 19: Global Peripheral Vascular Interventional Devices Revenue million Forecast, by Application 2020 & 2033
- Table 20: Global Peripheral Vascular Interventional Devices Volume K Forecast, by Application 2020 & 2033
- Table 21: Global Peripheral Vascular Interventional Devices Revenue million Forecast, by Types 2020 & 2033
- Table 22: Global Peripheral Vascular Interventional Devices Volume K Forecast, by Types 2020 & 2033
- Table 23: Global Peripheral Vascular Interventional Devices Revenue million Forecast, by Country 2020 & 2033
- Table 24: Global Peripheral Vascular Interventional Devices Volume K Forecast, by Country 2020 & 2033
- Table 25: Brazil Peripheral Vascular Interventional Devices Revenue (million) Forecast, by Application 2020 & 2033
- Table 26: Brazil Peripheral Vascular Interventional Devices Volume (K) Forecast, by Application 2020 & 2033
- Table 27: Argentina Peripheral Vascular Interventional Devices Revenue (million) Forecast, by Application 2020 & 2033
- Table 28: Argentina Peripheral Vascular Interventional Devices Volume (K) Forecast, by Application 2020 & 2033
- Table 29: Rest of South America Peripheral Vascular Interventional Devices Revenue (million) Forecast, by Application 2020 & 2033
- Table 30: Rest of South America Peripheral Vascular Interventional Devices Volume (K) Forecast, by Application 2020 & 2033
- Table 31: Global Peripheral Vascular Interventional Devices Revenue million Forecast, by Application 2020 & 2033
- Table 32: Global Peripheral Vascular Interventional Devices Volume K Forecast, by Application 2020 & 2033
- Table 33: Global Peripheral Vascular Interventional Devices Revenue million Forecast, by Types 2020 & 2033
- Table 34: Global Peripheral Vascular Interventional Devices Volume K Forecast, by Types 2020 & 2033
- Table 35: Global Peripheral Vascular Interventional Devices Revenue million Forecast, by Country 2020 & 2033
- Table 36: Global Peripheral Vascular Interventional Devices Volume K Forecast, by Country 2020 & 2033
- Table 37: United Kingdom Peripheral Vascular Interventional Devices Revenue (million) Forecast, by Application 2020 & 2033
- Table 38: United Kingdom Peripheral Vascular Interventional Devices Volume (K) Forecast, by Application 2020 & 2033
- Table 39: Germany Peripheral Vascular Interventional Devices Revenue (million) Forecast, by Application 2020 & 2033
- Table 40: Germany Peripheral Vascular Interventional Devices Volume (K) Forecast, by Application 2020 & 2033
- Table 41: France Peripheral Vascular Interventional Devices Revenue (million) Forecast, by Application 2020 & 2033
- Table 42: France Peripheral Vascular Interventional Devices Volume (K) Forecast, by Application 2020 & 2033
- Table 43: Italy Peripheral Vascular Interventional Devices Revenue (million) Forecast, by Application 2020 & 2033
- Table 44: Italy Peripheral Vascular Interventional Devices Volume (K) Forecast, by Application 2020 & 2033
- Table 45: Spain Peripheral Vascular Interventional Devices Revenue (million) Forecast, by Application 2020 & 2033
- Table 46: Spain Peripheral Vascular Interventional Devices Volume (K) Forecast, by Application 2020 & 2033
- Table 47: Russia Peripheral Vascular Interventional Devices Revenue (million) Forecast, by Application 2020 & 2033
- Table 48: Russia Peripheral Vascular Interventional Devices Volume (K) Forecast, by Application 2020 & 2033
- Table 49: Benelux Peripheral Vascular Interventional Devices Revenue (million) Forecast, by Application 2020 & 2033
- Table 50: Benelux Peripheral Vascular Interventional Devices Volume (K) Forecast, by Application 2020 & 2033
- Table 51: Nordics Peripheral Vascular Interventional Devices Revenue (million) Forecast, by Application 2020 & 2033
- Table 52: Nordics Peripheral Vascular Interventional Devices Volume (K) Forecast, by Application 2020 & 2033
- Table 53: Rest of Europe Peripheral Vascular Interventional Devices Revenue (million) Forecast, by Application 2020 & 2033
- Table 54: Rest of Europe Peripheral Vascular Interventional Devices Volume (K) Forecast, by Application 2020 & 2033
- Table 55: Global Peripheral Vascular Interventional Devices Revenue million Forecast, by Application 2020 & 2033
- Table 56: Global Peripheral Vascular Interventional Devices Volume K Forecast, by Application 2020 & 2033
- Table 57: Global Peripheral Vascular Interventional Devices Revenue million Forecast, by Types 2020 & 2033
- Table 58: Global Peripheral Vascular Interventional Devices Volume K Forecast, by Types 2020 & 2033
- Table 59: Global Peripheral Vascular Interventional Devices Revenue million Forecast, by Country 2020 & 2033
- Table 60: Global Peripheral Vascular Interventional Devices Volume K Forecast, by Country 2020 & 2033
- Table 61: Turkey Peripheral Vascular Interventional Devices Revenue (million) Forecast, by Application 2020 & 2033
- Table 62: Turkey Peripheral Vascular Interventional Devices Volume (K) Forecast, by Application 2020 & 2033
- Table 63: Israel Peripheral Vascular Interventional Devices Revenue (million) Forecast, by Application 2020 & 2033
- Table 64: Israel Peripheral Vascular Interventional Devices Volume (K) Forecast, by Application 2020 & 2033
- Table 65: GCC Peripheral Vascular Interventional Devices Revenue (million) Forecast, by Application 2020 & 2033
- Table 66: GCC Peripheral Vascular Interventional Devices Volume (K) Forecast, by Application 2020 & 2033
- Table 67: North Africa Peripheral Vascular Interventional Devices Revenue (million) Forecast, by Application 2020 & 2033
- Table 68: North Africa Peripheral Vascular Interventional Devices Volume (K) Forecast, by Application 2020 & 2033
- Table 69: South Africa Peripheral Vascular Interventional Devices Revenue (million) Forecast, by Application 2020 & 2033
- Table 70: South Africa Peripheral Vascular Interventional Devices Volume (K) Forecast, by Application 2020 & 2033
- Table 71: Rest of Middle East & Africa Peripheral Vascular Interventional Devices Revenue (million) Forecast, by Application 2020 & 2033
- Table 72: Rest of Middle East & Africa Peripheral Vascular Interventional Devices Volume (K) Forecast, by Application 2020 & 2033
- Table 73: Global Peripheral Vascular Interventional Devices Revenue million Forecast, by Application 2020 & 2033
- Table 74: Global Peripheral Vascular Interventional Devices Volume K Forecast, by Application 2020 & 2033
- Table 75: Global Peripheral Vascular Interventional Devices Revenue million Forecast, by Types 2020 & 2033
- Table 76: Global Peripheral Vascular Interventional Devices Volume K Forecast, by Types 2020 & 2033
- Table 77: Global Peripheral Vascular Interventional Devices Revenue million Forecast, by Country 2020 & 2033
- Table 78: Global Peripheral Vascular Interventional Devices Volume K Forecast, by Country 2020 & 2033
- Table 79: China Peripheral Vascular Interventional Devices Revenue (million) Forecast, by Application 2020 & 2033
- Table 80: China Peripheral Vascular Interventional Devices Volume (K) Forecast, by Application 2020 & 2033
- Table 81: India Peripheral Vascular Interventional Devices Revenue (million) Forecast, by Application 2020 & 2033
- Table 82: India Peripheral Vascular Interventional Devices Volume (K) Forecast, by Application 2020 & 2033
- Table 83: Japan Peripheral Vascular Interventional Devices Revenue (million) Forecast, by Application 2020 & 2033
- Table 84: Japan Peripheral Vascular Interventional Devices Volume (K) Forecast, by Application 2020 & 2033
- Table 85: South Korea Peripheral Vascular Interventional Devices Revenue (million) Forecast, by Application 2020 & 2033
- Table 86: South Korea Peripheral Vascular Interventional Devices Volume (K) Forecast, by Application 2020 & 2033
- Table 87: ASEAN Peripheral Vascular Interventional Devices Revenue (million) Forecast, by Application 2020 & 2033
- Table 88: ASEAN Peripheral Vascular Interventional Devices Volume (K) Forecast, by Application 2020 & 2033
- Table 89: Oceania Peripheral Vascular Interventional Devices Revenue (million) Forecast, by Application 2020 & 2033
- Table 90: Oceania Peripheral Vascular Interventional Devices Volume (K) Forecast, by Application 2020 & 2033
- Table 91: Rest of Asia Pacific Peripheral Vascular Interventional Devices Revenue (million) Forecast, by Application 2020 & 2033
- Table 92: Rest of Asia Pacific Peripheral Vascular Interventional Devices Volume (K) Forecast, by Application 2020 & 2033
Frequently Asked Questions
1. What is the projected Compound Annual Growth Rate (CAGR) of the Peripheral Vascular Interventional Devices?
The projected CAGR is approximately 13.7%.
2. Which companies are prominent players in the Peripheral Vascular Interventional Devices?
Key companies in the market include Cordis, Cook Medical, Boston Scientific, B. Braun, LifeTech Scientific, Philips, Braile BIOMEDICA, Argon Medical Devices, BD, Acotec Scientific Holdings, Shanghai MicroPort Endovascular MedTech, Zylox-Tonbridge Medical Technology, Suzhou Tianhong Shengjie Medical Equipment, Shandong Visee Medical Devices, Medtronic, Abbott, Arjo, Zimmer Biomet, Breg, Cardinal Health.
3. What are the main segments of the Peripheral Vascular Interventional Devices?
The market segments include Application, Types.
4. Can you provide details about the market size?
The market size is estimated to be USD 4540 million as of 2022.
5. What are some drivers contributing to market growth?
N/A
6. What are the notable trends driving market growth?
N/A
7. Are there any restraints impacting market growth?
N/A
8. Can you provide examples of recent developments in the market?
N/A
9. What pricing options are available for accessing the report?
Pricing options include single-user, multi-user, and enterprise licenses priced at USD 4350.00, USD 6525.00, and USD 8700.00 respectively.
10. Is the market size provided in terms of value or volume?
The market size is provided in terms of value, measured in million and volume, measured in K.
11. Are there any specific market keywords associated with the report?
Yes, the market keyword associated with the report is "Peripheral Vascular Interventional Devices," which aids in identifying and referencing the specific market segment covered.
12. How do I determine which pricing option suits my needs best?
The pricing options vary based on user requirements and access needs. Individual users may opt for single-user licenses, while businesses requiring broader access may choose multi-user or enterprise licenses for cost-effective access to the report.
13. Are there any additional resources or data provided in the Peripheral Vascular Interventional Devices report?
While the report offers comprehensive insights, it's advisable to review the specific contents or supplementary materials provided to ascertain if additional resources or data are available.
14. How can I stay updated on further developments or reports in the Peripheral Vascular Interventional Devices?
To stay informed about further developments, trends, and reports in the Peripheral Vascular Interventional Devices, consider subscribing to industry newsletters, following relevant companies and organizations, or regularly checking reputable industry news sources and publications.
Methodology
Step 1 - Identification of Relevant Samples Size from Population Database


Step 2 - Approaches for Defining Global Market Size (Value, Volume* & Price*)

Note*: In applicable scenarios
Step 3 - Data Sources
Primary Research
- Web Analytics
- Survey Reports
- Research Institute
- Latest Research Reports
- Opinion Leaders
Secondary Research
- Annual Reports
- White Paper
- Latest Press Release
- Industry Association
- Paid Database
- Investor Presentations

Step 4 - Data Triangulation
Involves using different sources of information in order to increase the validity of a study
These sources are likely to be stakeholders in a program - participants, other researchers, program staff, other community members, and so on.
Then we put all data in single framework & apply various statistical tools to find out the dynamic on the market.
During the analysis stage, feedback from the stakeholder groups would be compared to determine areas of agreement as well as areas of divergence