

Key Insights
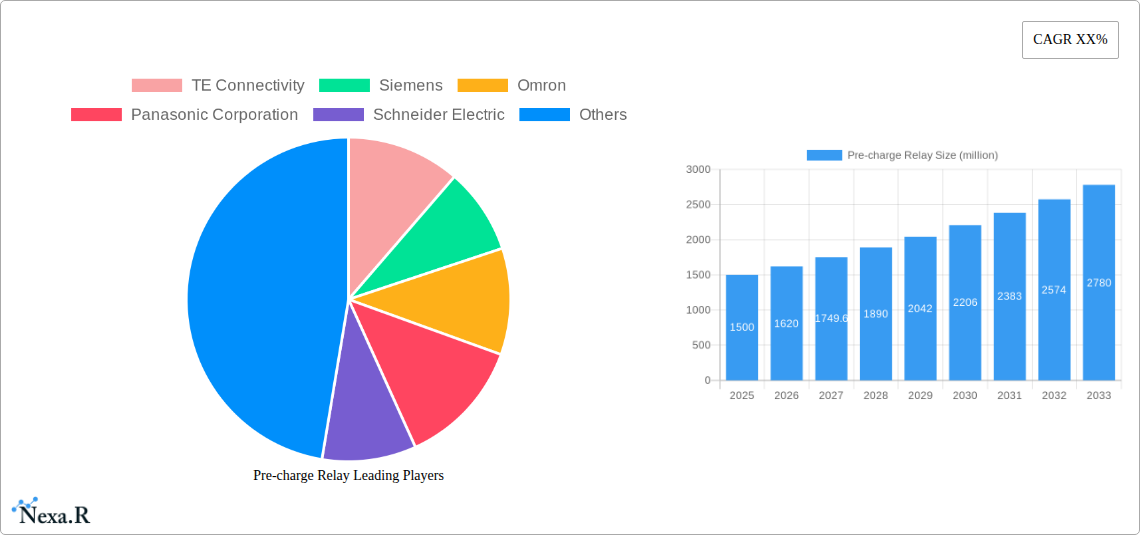
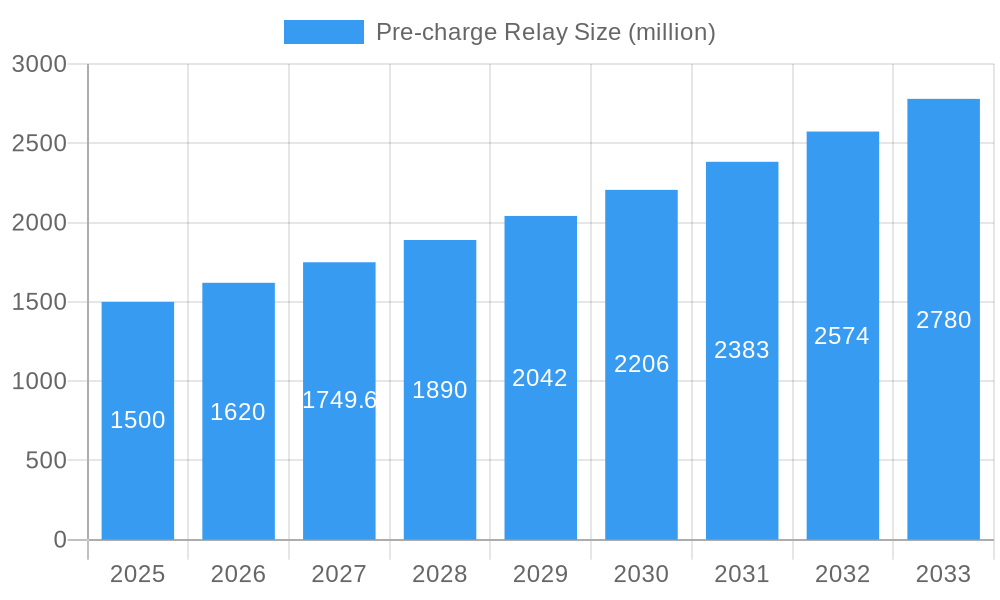
The pre-charge relay market is experiencing robust growth, driven by the increasing demand for electric vehicles (EVs) and hybrid electric vehicles (HEVs). These relays play a crucial role in protecting high-voltage battery systems, ensuring safe and efficient operation. The market's expansion is further fueled by the rising adoption of renewable energy sources and the growing focus on energy efficiency across various industrial applications. Technological advancements, such as the development of more compact and reliable relays with improved switching speeds and higher current handling capabilities, are also contributing to market growth. Major players like TE Connectivity, Siemens, and Omron are investing heavily in R&D and strategic partnerships to capitalize on this burgeoning market. Competition is intense, with both established players and emerging regional manufacturers vying for market share. Challenges include stringent safety regulations and the need for robust quality control to ensure the reliability of these critical components in demanding applications. We estimate the market size in 2025 to be approximately $1.5 billion, projecting a compound annual growth rate (CAGR) of 8% from 2025 to 2033. This growth trajectory is influenced by government incentives for electric mobility, expanding charging infrastructure, and increasing demand across diverse sectors, including industrial automation and renewable energy systems.
Pre-charge Relay Market Size (In Billion)
The market segmentation reveals a significant portion dominated by automotive applications, reflecting the strong influence of EV adoption. However, non-automotive sectors such as industrial automation and power generation are showing promising growth potential, presenting lucrative opportunities for market players to diversify their product offerings. Geographic analysis indicates that North America and Europe currently hold the largest market shares, primarily driven by strong technological advancements and supportive government policies in these regions. However, Asia-Pacific is expected to witness significant growth in the coming years, driven by the rapid expansion of the electric vehicle market and the increasing industrialization within this region. The competitive landscape is characterized by both large multinational corporations and smaller, specialized manufacturers. The key to success in this market lies in technological innovation, cost-effectiveness, and strategic partnerships to meet the growing demands of various sectors.
Pre-charge Relay Company Market Share
Pre-charge Relay Market Report: 2019-2033
This comprehensive report provides an in-depth analysis of the global pre-charge relay market, encompassing market dynamics, growth trends, regional segmentation, product landscape, key players, and future outlook. The study period covers 2019-2033, with 2025 as the base and estimated year. The forecast period is 2025-2033, and the historical period is 2019-2024. This report is crucial for industry professionals, investors, and strategic decision-makers seeking a clear understanding of this evolving market.
Pre-charge Relay Market Dynamics & Structure
This section analyzes the competitive landscape, technological advancements, regulatory influences, and market trends within the pre-charge relay industry (parent market: Electrical Relay Market; child market: Automotive Relays). The report quantifies market concentration, examining market share distribution among key players and assessing the impact of mergers and acquisitions (M&A). The analysis incorporates qualitative factors such as innovation barriers and regulatory compliance challenges, offering a holistic view of the market's structure.
- Market Concentration: The market is moderately concentrated, with the top 5 players holding approximately xx% of the market share in 2024.
- Technological Innovation: Advancements in semiconductor technology and miniaturization are key drivers of innovation, enabling higher efficiency and reliability.
- Regulatory Framework: Stringent safety and performance standards across various industries (automotive, industrial automation) significantly impact product design and market entry.
- Competitive Substitutes: Solid-state relays and other switching technologies present competitive alternatives, although pre-charge relays maintain advantages in specific applications.
- M&A Activity: The number of M&A deals in the pre-charge relay sector averaged xx per year during the historical period, primarily driven by efforts to expand market reach and product portfolios. This resulted in a xx million unit increase in market size.
- End-User Demographics: The automotive industry represents the largest end-user segment, followed by industrial automation and renewable energy sectors.
Pre-charge Relay Growth Trends & Insights
This section leverages extensive data analysis to provide a detailed overview of the pre-charge relay market's evolution. It examines historical market size, forecasts future growth using a compound annual growth rate (CAGR), assesses market penetration rates, and analyzes the influence of technological disruptions and evolving consumer preferences on market dynamics. This analysis also accounts for factors like increasing demand for electric vehicles and stringent emission regulations. The expected market size in 2033 is projected to reach xx million units.
- Market Size Evolution: The market experienced a CAGR of xx% during 2019-2024 and is projected to maintain a CAGR of xx% from 2025-2033.
- Adoption Rates: Adoption is increasing steadily across various end-user sectors, particularly in regions with robust industrial growth and expanding renewable energy infrastructure.
- Technological Disruptions: The integration of smart functionalities and improved power handling capabilities is driving market expansion.
- Consumer Behavior Shifts: The growing preference for energy-efficient and reliable systems fuels demand for advanced pre-charge relay solutions.
Dominant Regions, Countries, or Segments in Pre-charge Relay
This section identifies the leading geographical regions and market segments driving market growth. A detailed analysis of regional dominance is provided, considering factors such as economic growth, infrastructure development, government policies, and industry-specific regulations. Market share data and growth potential projections are included for key regions and segments.
- Dominant Region: Asia-Pacific is expected to hold the largest market share throughout the forecast period due to rapid industrialization and expanding automotive production.
- Key Drivers:
- Strong economic growth in developing economies
- Increasing investments in renewable energy infrastructure
- Government initiatives promoting automation and industrial modernization.
- Dominant Countries: China, Japan, and India are projected to lead the regional market.
- Segment Analysis: The automotive segment is expected to maintain its dominance, driven by increasing electric vehicle adoption and advanced driver-assistance systems (ADAS).
Pre-charge Relay Product Landscape
This section details product innovations, applications, and performance metrics of pre-charge relays. It highlights unique selling propositions (USPs) and technological advancements such as improved switching speeds, enhanced thermal management, and increased reliability. These innovations are key factors influencing market competition and shaping future demand. New product designs emphasize compact sizes and reduced energy consumption, catering to the demands of miniaturized electronic systems.
Key Drivers, Barriers & Challenges in Pre-charge Relay
This section outlines the primary factors propelling market growth and identifies significant challenges and restraints impacting market expansion. Quantitative impacts are highlighted wherever possible.
Key Drivers:
- Increasing demand for electric vehicles and hybrid electric vehicles.
- Growth of industrial automation across various sectors.
- Expanding renewable energy infrastructure.
Challenges & Restraints:
- Intense competition among established and emerging players.
- Supply chain disruptions due to geopolitical uncertainties.
- Fluctuations in raw material prices.
- Stringent regulatory compliance requirements across different geographies.
Emerging Opportunities in Pre-charge Relay
This section identifies potential growth areas for pre-charge relay technology, including untapped markets, innovative applications, and evolving consumer preferences. Emphasis is placed on opportunities within emerging economies, niche applications in specialized industries, and strategic partnerships that can expand market reach and drive growth.
Growth Accelerators in the Pre-charge Relay Industry
Technological breakthroughs, strategic alliances, and market expansion strategies are highlighted as key drivers of long-term market growth. The focus is on identifying factors that can accelerate market expansion and enhance the overall market potential. The emphasis is placed on anticipating future technology trends and adapting to changing market dynamics.
Key Players Shaping the Pre-charge Relay Market
- TE Connectivity
- Siemens
- Omron
- Panasonic Corporation
- Schneider Electric
- Littelfuse
- Eaton
- Curtis Instruments
- Tyco Electronics
- Shanghai Xi'e Electric
- Zhuhai Hanglian Technology
- Wuxi Kaiweilian Hydraulic Machinery
Notable Milestones in Pre-charge Relay Sector
- 2020-Q4: Introduction of a new high-power pre-charge relay by TE Connectivity.
- 2021-Q2: Strategic partnership between Siemens and a major automotive manufacturer for pre-charge relay supply.
- 2022-Q3: Acquisition of a smaller pre-charge relay manufacturer by Omron.
- 2023-Q1: Launch of a new energy-efficient pre-charge relay by Panasonic.
In-Depth Pre-charge Relay Market Outlook
The pre-charge relay market is poised for significant growth, driven by technological advancements, expanding applications, and increasing demand across various sectors. The focus on energy efficiency, enhanced reliability, and compact designs will further stimulate market expansion. Strategic partnerships and aggressive market penetration strategies will be crucial for players seeking to gain a competitive edge. The long-term outlook is positive, projecting a sustained growth trajectory throughout the forecast period.
Pre-charge Relay Segmentation
-
1. Application
- 1.1. Electric Car
- 1.2. Solar System
- 1.3. Other
-
2. Types
- 2.1. Electromagnetic Pre-charge
- 2.2. Solid-state Pre-charge
Pre-charge Relay Segmentation By Geography
-
1. North America
- 1.1. United States
- 1.2. Canada
- 1.3. Mexico
-
2. South America
- 2.1. Brazil
- 2.2. Argentina
- 2.3. Rest of South America
-
3. Europe
- 3.1. United Kingdom
- 3.2. Germany
- 3.3. France
- 3.4. Italy
- 3.5. Spain
- 3.6. Russia
- 3.7. Benelux
- 3.8. Nordics
- 3.9. Rest of Europe
-
4. Middle East & Africa
- 4.1. Turkey
- 4.2. Israel
- 4.3. GCC
- 4.4. North Africa
- 4.5. South Africa
- 4.6. Rest of Middle East & Africa
-
5. Asia Pacific
- 5.1. China
- 5.2. India
- 5.3. Japan
- 5.4. South Korea
- 5.5. ASEAN
- 5.6. Oceania
- 5.7. Rest of Asia Pacific

Pre-charge Relay Regional Market Share
Geographic Coverage of Pre-charge Relay
Pre-charge Relay REPORT HIGHLIGHTS
| Aspects | Details |
|---|---|
| Study Period | 2020-2034 |
| Base Year | 2025 |
| Estimated Year | 2026 |
| Forecast Period | 2026-2034 |
| Historical Period | 2020-2025 |
| Growth Rate | CAGR of XX% from 2020-2034 |
| Segmentation |
|
Table of Contents
- 1. Introduction
- 1.1. Research Scope
- 1.2. Market Segmentation
- 1.3. Research Methodology
- 1.4. Definitions and Assumptions
- 2. Executive Summary
- 2.1. Introduction
- 3. Market Dynamics
- 3.1. Introduction
- 3.2. Market Drivers
- 3.3. Market Restrains
- 3.4. Market Trends
- 4. Market Factor Analysis
- 4.1. Porters Five Forces
- 4.2. Supply/Value Chain
- 4.3. PESTEL analysis
- 4.4. Market Entropy
- 4.5. Patent/Trademark Analysis
- 5. Global Pre-charge Relay Analysis, Insights and Forecast, 2020-2032
- 5.1. Market Analysis, Insights and Forecast - by Application
- 5.1.1. Electric Car
- 5.1.2. Solar System
- 5.1.3. Other
- 5.2. Market Analysis, Insights and Forecast - by Types
- 5.2.1. Electromagnetic Pre-charge
- 5.2.2. Solid-state Pre-charge
- 5.3. Market Analysis, Insights and Forecast - by Region
- 5.3.1. North America
- 5.3.2. South America
- 5.3.3. Europe
- 5.3.4. Middle East & Africa
- 5.3.5. Asia Pacific
- 5.1. Market Analysis, Insights and Forecast - by Application
- 6. North America Pre-charge Relay Analysis, Insights and Forecast, 2020-2032
- 6.1. Market Analysis, Insights and Forecast - by Application
- 6.1.1. Electric Car
- 6.1.2. Solar System
- 6.1.3. Other
- 6.2. Market Analysis, Insights and Forecast - by Types
- 6.2.1. Electromagnetic Pre-charge
- 6.2.2. Solid-state Pre-charge
- 6.1. Market Analysis, Insights and Forecast - by Application
- 7. South America Pre-charge Relay Analysis, Insights and Forecast, 2020-2032
- 7.1. Market Analysis, Insights and Forecast - by Application
- 7.1.1. Electric Car
- 7.1.2. Solar System
- 7.1.3. Other
- 7.2. Market Analysis, Insights and Forecast - by Types
- 7.2.1. Electromagnetic Pre-charge
- 7.2.2. Solid-state Pre-charge
- 7.1. Market Analysis, Insights and Forecast - by Application
- 8. Europe Pre-charge Relay Analysis, Insights and Forecast, 2020-2032
- 8.1. Market Analysis, Insights and Forecast - by Application
- 8.1.1. Electric Car
- 8.1.2. Solar System
- 8.1.3. Other
- 8.2. Market Analysis, Insights and Forecast - by Types
- 8.2.1. Electromagnetic Pre-charge
- 8.2.2. Solid-state Pre-charge
- 8.1. Market Analysis, Insights and Forecast - by Application
- 9. Middle East & Africa Pre-charge Relay Analysis, Insights and Forecast, 2020-2032
- 9.1. Market Analysis, Insights and Forecast - by Application
- 9.1.1. Electric Car
- 9.1.2. Solar System
- 9.1.3. Other
- 9.2. Market Analysis, Insights and Forecast - by Types
- 9.2.1. Electromagnetic Pre-charge
- 9.2.2. Solid-state Pre-charge
- 9.1. Market Analysis, Insights and Forecast - by Application
- 10. Asia Pacific Pre-charge Relay Analysis, Insights and Forecast, 2020-2032
- 10.1. Market Analysis, Insights and Forecast - by Application
- 10.1.1. Electric Car
- 10.1.2. Solar System
- 10.1.3. Other
- 10.2. Market Analysis, Insights and Forecast - by Types
- 10.2.1. Electromagnetic Pre-charge
- 10.2.2. Solid-state Pre-charge
- 10.1. Market Analysis, Insights and Forecast - by Application
- 11. Competitive Analysis
- 11.1. Global Market Share Analysis 2025
- 11.2. Company Profiles
- 11.2.1 TE Connectivity
- 11.2.1.1. Overview
- 11.2.1.2. Products
- 11.2.1.3. SWOT Analysis
- 11.2.1.4. Recent Developments
- 11.2.1.5. Financials (Based on Availability)
- 11.2.2 Siemens
- 11.2.2.1. Overview
- 11.2.2.2. Products
- 11.2.2.3. SWOT Analysis
- 11.2.2.4. Recent Developments
- 11.2.2.5. Financials (Based on Availability)
- 11.2.3 Omron
- 11.2.3.1. Overview
- 11.2.3.2. Products
- 11.2.3.3. SWOT Analysis
- 11.2.3.4. Recent Developments
- 11.2.3.5. Financials (Based on Availability)
- 11.2.4 Panasonic Corporation
- 11.2.4.1. Overview
- 11.2.4.2. Products
- 11.2.4.3. SWOT Analysis
- 11.2.4.4. Recent Developments
- 11.2.4.5. Financials (Based on Availability)
- 11.2.5 Schneider Electric
- 11.2.5.1. Overview
- 11.2.5.2. Products
- 11.2.5.3. SWOT Analysis
- 11.2.5.4. Recent Developments
- 11.2.5.5. Financials (Based on Availability)
- 11.2.6 Littelfuse
- 11.2.6.1. Overview
- 11.2.6.2. Products
- 11.2.6.3. SWOT Analysis
- 11.2.6.4. Recent Developments
- 11.2.6.5. Financials (Based on Availability)
- 11.2.7 Eaton
- 11.2.7.1. Overview
- 11.2.7.2. Products
- 11.2.7.3. SWOT Analysis
- 11.2.7.4. Recent Developments
- 11.2.7.5. Financials (Based on Availability)
- 11.2.8 Curtis Instruments
- 11.2.8.1. Overview
- 11.2.8.2. Products
- 11.2.8.3. SWOT Analysis
- 11.2.8.4. Recent Developments
- 11.2.8.5. Financials (Based on Availability)
- 11.2.9 Tyco Electronics
- 11.2.9.1. Overview
- 11.2.9.2. Products
- 11.2.9.3. SWOT Analysis
- 11.2.9.4. Recent Developments
- 11.2.9.5. Financials (Based on Availability)
- 11.2.10 Shanghai Xi'e Electric
- 11.2.10.1. Overview
- 11.2.10.2. Products
- 11.2.10.3. SWOT Analysis
- 11.2.10.4. Recent Developments
- 11.2.10.5. Financials (Based on Availability)
- 11.2.11 Zhuhai Hanglian Technology
- 11.2.11.1. Overview
- 11.2.11.2. Products
- 11.2.11.3. SWOT Analysis
- 11.2.11.4. Recent Developments
- 11.2.11.5. Financials (Based on Availability)
- 11.2.12 Wuxi Kaiweilian Hydraulic Machinery
- 11.2.12.1. Overview
- 11.2.12.2. Products
- 11.2.12.3. SWOT Analysis
- 11.2.12.4. Recent Developments
- 11.2.12.5. Financials (Based on Availability)
- 11.2.1 TE Connectivity
List of Figures
- Figure 1: Global Pre-charge Relay Revenue Breakdown (million, %) by Region 2025 & 2033
- Figure 2: North America Pre-charge Relay Revenue (million), by Application 2025 & 2033
- Figure 3: North America Pre-charge Relay Revenue Share (%), by Application 2025 & 2033
- Figure 4: North America Pre-charge Relay Revenue (million), by Types 2025 & 2033
- Figure 5: North America Pre-charge Relay Revenue Share (%), by Types 2025 & 2033
- Figure 6: North America Pre-charge Relay Revenue (million), by Country 2025 & 2033
- Figure 7: North America Pre-charge Relay Revenue Share (%), by Country 2025 & 2033
- Figure 8: South America Pre-charge Relay Revenue (million), by Application 2025 & 2033
- Figure 9: South America Pre-charge Relay Revenue Share (%), by Application 2025 & 2033
- Figure 10: South America Pre-charge Relay Revenue (million), by Types 2025 & 2033
- Figure 11: South America Pre-charge Relay Revenue Share (%), by Types 2025 & 2033
- Figure 12: South America Pre-charge Relay Revenue (million), by Country 2025 & 2033
- Figure 13: South America Pre-charge Relay Revenue Share (%), by Country 2025 & 2033
- Figure 14: Europe Pre-charge Relay Revenue (million), by Application 2025 & 2033
- Figure 15: Europe Pre-charge Relay Revenue Share (%), by Application 2025 & 2033
- Figure 16: Europe Pre-charge Relay Revenue (million), by Types 2025 & 2033
- Figure 17: Europe Pre-charge Relay Revenue Share (%), by Types 2025 & 2033
- Figure 18: Europe Pre-charge Relay Revenue (million), by Country 2025 & 2033
- Figure 19: Europe Pre-charge Relay Revenue Share (%), by Country 2025 & 2033
- Figure 20: Middle East & Africa Pre-charge Relay Revenue (million), by Application 2025 & 2033
- Figure 21: Middle East & Africa Pre-charge Relay Revenue Share (%), by Application 2025 & 2033
- Figure 22: Middle East & Africa Pre-charge Relay Revenue (million), by Types 2025 & 2033
- Figure 23: Middle East & Africa Pre-charge Relay Revenue Share (%), by Types 2025 & 2033
- Figure 24: Middle East & Africa Pre-charge Relay Revenue (million), by Country 2025 & 2033
- Figure 25: Middle East & Africa Pre-charge Relay Revenue Share (%), by Country 2025 & 2033
- Figure 26: Asia Pacific Pre-charge Relay Revenue (million), by Application 2025 & 2033
- Figure 27: Asia Pacific Pre-charge Relay Revenue Share (%), by Application 2025 & 2033
- Figure 28: Asia Pacific Pre-charge Relay Revenue (million), by Types 2025 & 2033
- Figure 29: Asia Pacific Pre-charge Relay Revenue Share (%), by Types 2025 & 2033
- Figure 30: Asia Pacific Pre-charge Relay Revenue (million), by Country 2025 & 2033
- Figure 31: Asia Pacific Pre-charge Relay Revenue Share (%), by Country 2025 & 2033
List of Tables
- Table 1: Global Pre-charge Relay Revenue million Forecast, by Application 2020 & 2033
- Table 2: Global Pre-charge Relay Revenue million Forecast, by Types 2020 & 2033
- Table 3: Global Pre-charge Relay Revenue million Forecast, by Region 2020 & 2033
- Table 4: Global Pre-charge Relay Revenue million Forecast, by Application 2020 & 2033
- Table 5: Global Pre-charge Relay Revenue million Forecast, by Types 2020 & 2033
- Table 6: Global Pre-charge Relay Revenue million Forecast, by Country 2020 & 2033
- Table 7: United States Pre-charge Relay Revenue (million) Forecast, by Application 2020 & 2033
- Table 8: Canada Pre-charge Relay Revenue (million) Forecast, by Application 2020 & 2033
- Table 9: Mexico Pre-charge Relay Revenue (million) Forecast, by Application 2020 & 2033
- Table 10: Global Pre-charge Relay Revenue million Forecast, by Application 2020 & 2033
- Table 11: Global Pre-charge Relay Revenue million Forecast, by Types 2020 & 2033
- Table 12: Global Pre-charge Relay Revenue million Forecast, by Country 2020 & 2033
- Table 13: Brazil Pre-charge Relay Revenue (million) Forecast, by Application 2020 & 2033
- Table 14: Argentina Pre-charge Relay Revenue (million) Forecast, by Application 2020 & 2033
- Table 15: Rest of South America Pre-charge Relay Revenue (million) Forecast, by Application 2020 & 2033
- Table 16: Global Pre-charge Relay Revenue million Forecast, by Application 2020 & 2033
- Table 17: Global Pre-charge Relay Revenue million Forecast, by Types 2020 & 2033
- Table 18: Global Pre-charge Relay Revenue million Forecast, by Country 2020 & 2033
- Table 19: United Kingdom Pre-charge Relay Revenue (million) Forecast, by Application 2020 & 2033
- Table 20: Germany Pre-charge Relay Revenue (million) Forecast, by Application 2020 & 2033
- Table 21: France Pre-charge Relay Revenue (million) Forecast, by Application 2020 & 2033
- Table 22: Italy Pre-charge Relay Revenue (million) Forecast, by Application 2020 & 2033
- Table 23: Spain Pre-charge Relay Revenue (million) Forecast, by Application 2020 & 2033
- Table 24: Russia Pre-charge Relay Revenue (million) Forecast, by Application 2020 & 2033
- Table 25: Benelux Pre-charge Relay Revenue (million) Forecast, by Application 2020 & 2033
- Table 26: Nordics Pre-charge Relay Revenue (million) Forecast, by Application 2020 & 2033
- Table 27: Rest of Europe Pre-charge Relay Revenue (million) Forecast, by Application 2020 & 2033
- Table 28: Global Pre-charge Relay Revenue million Forecast, by Application 2020 & 2033
- Table 29: Global Pre-charge Relay Revenue million Forecast, by Types 2020 & 2033
- Table 30: Global Pre-charge Relay Revenue million Forecast, by Country 2020 & 2033
- Table 31: Turkey Pre-charge Relay Revenue (million) Forecast, by Application 2020 & 2033
- Table 32: Israel Pre-charge Relay Revenue (million) Forecast, by Application 2020 & 2033
- Table 33: GCC Pre-charge Relay Revenue (million) Forecast, by Application 2020 & 2033
- Table 34: North Africa Pre-charge Relay Revenue (million) Forecast, by Application 2020 & 2033
- Table 35: South Africa Pre-charge Relay Revenue (million) Forecast, by Application 2020 & 2033
- Table 36: Rest of Middle East & Africa Pre-charge Relay Revenue (million) Forecast, by Application 2020 & 2033
- Table 37: Global Pre-charge Relay Revenue million Forecast, by Application 2020 & 2033
- Table 38: Global Pre-charge Relay Revenue million Forecast, by Types 2020 & 2033
- Table 39: Global Pre-charge Relay Revenue million Forecast, by Country 2020 & 2033
- Table 40: China Pre-charge Relay Revenue (million) Forecast, by Application 2020 & 2033
- Table 41: India Pre-charge Relay Revenue (million) Forecast, by Application 2020 & 2033
- Table 42: Japan Pre-charge Relay Revenue (million) Forecast, by Application 2020 & 2033
- Table 43: South Korea Pre-charge Relay Revenue (million) Forecast, by Application 2020 & 2033
- Table 44: ASEAN Pre-charge Relay Revenue (million) Forecast, by Application 2020 & 2033
- Table 45: Oceania Pre-charge Relay Revenue (million) Forecast, by Application 2020 & 2033
- Table 46: Rest of Asia Pacific Pre-charge Relay Revenue (million) Forecast, by Application 2020 & 2033
Frequently Asked Questions
1. What is the projected Compound Annual Growth Rate (CAGR) of the Pre-charge Relay?
The projected CAGR is approximately XX%.
2. Which companies are prominent players in the Pre-charge Relay?
Key companies in the market include TE Connectivity, Siemens, Omron, Panasonic Corporation, Schneider Electric, Littelfuse, Eaton, Curtis Instruments, Tyco Electronics, Shanghai Xi'e Electric, Zhuhai Hanglian Technology, Wuxi Kaiweilian Hydraulic Machinery.
3. What are the main segments of the Pre-charge Relay?
The market segments include Application, Types.
4. Can you provide details about the market size?
The market size is estimated to be USD XXX million as of 2022.
5. What are some drivers contributing to market growth?
N/A
6. What are the notable trends driving market growth?
N/A
7. Are there any restraints impacting market growth?
N/A
8. Can you provide examples of recent developments in the market?
N/A
9. What pricing options are available for accessing the report?
Pricing options include single-user, multi-user, and enterprise licenses priced at USD 4900.00, USD 7350.00, and USD 9800.00 respectively.
10. Is the market size provided in terms of value or volume?
The market size is provided in terms of value, measured in million.
11. Are there any specific market keywords associated with the report?
Yes, the market keyword associated with the report is "Pre-charge Relay," which aids in identifying and referencing the specific market segment covered.
12. How do I determine which pricing option suits my needs best?
The pricing options vary based on user requirements and access needs. Individual users may opt for single-user licenses, while businesses requiring broader access may choose multi-user or enterprise licenses for cost-effective access to the report.
13. Are there any additional resources or data provided in the Pre-charge Relay report?
While the report offers comprehensive insights, it's advisable to review the specific contents or supplementary materials provided to ascertain if additional resources or data are available.
14. How can I stay updated on further developments or reports in the Pre-charge Relay?
To stay informed about further developments, trends, and reports in the Pre-charge Relay, consider subscribing to industry newsletters, following relevant companies and organizations, or regularly checking reputable industry news sources and publications.
Methodology
Step 1 - Identification of Relevant Samples Size from Population Database


Step 2 - Approaches for Defining Global Market Size (Value, Volume* & Price*)

Note*: In applicable scenarios
Step 3 - Data Sources
Primary Research
- Web Analytics
- Survey Reports
- Research Institute
- Latest Research Reports
- Opinion Leaders
Secondary Research
- Annual Reports
- White Paper
- Latest Press Release
- Industry Association
- Paid Database
- Investor Presentations

Step 4 - Data Triangulation
Involves using different sources of information in order to increase the validity of a study
These sources are likely to be stakeholders in a program - participants, other researchers, program staff, other community members, and so on.
Then we put all data in single framework & apply various statistical tools to find out the dynamic on the market.
During the analysis stage, feedback from the stakeholder groups would be compared to determine areas of agreement as well as areas of divergence