

Key Insights
The global Reverse Engineering Tools market is experiencing robust growth, projected to reach a significant USD 639 million by 2025, with a Compound Annual Growth Rate (CAGR) of 9.3% over the forecast period of 2025-2033. This expansion is primarily driven by the escalating demand for advanced cybersecurity solutions to combat sophisticated cyber threats. As digital landscapes become more complex and the volume of malware and exploit techniques continues to rise, organizations are increasingly relying on reverse engineering tools to understand, analyze, and defend against these threats. The growing need for software and hardware integrity checks, intellectual property protection, and the development of countermeasures further fuels market adoption. Moreover, the proliferation of IoT devices and the expanding mobile application ecosystem present new frontiers for reverse engineering, creating further opportunities for market players.
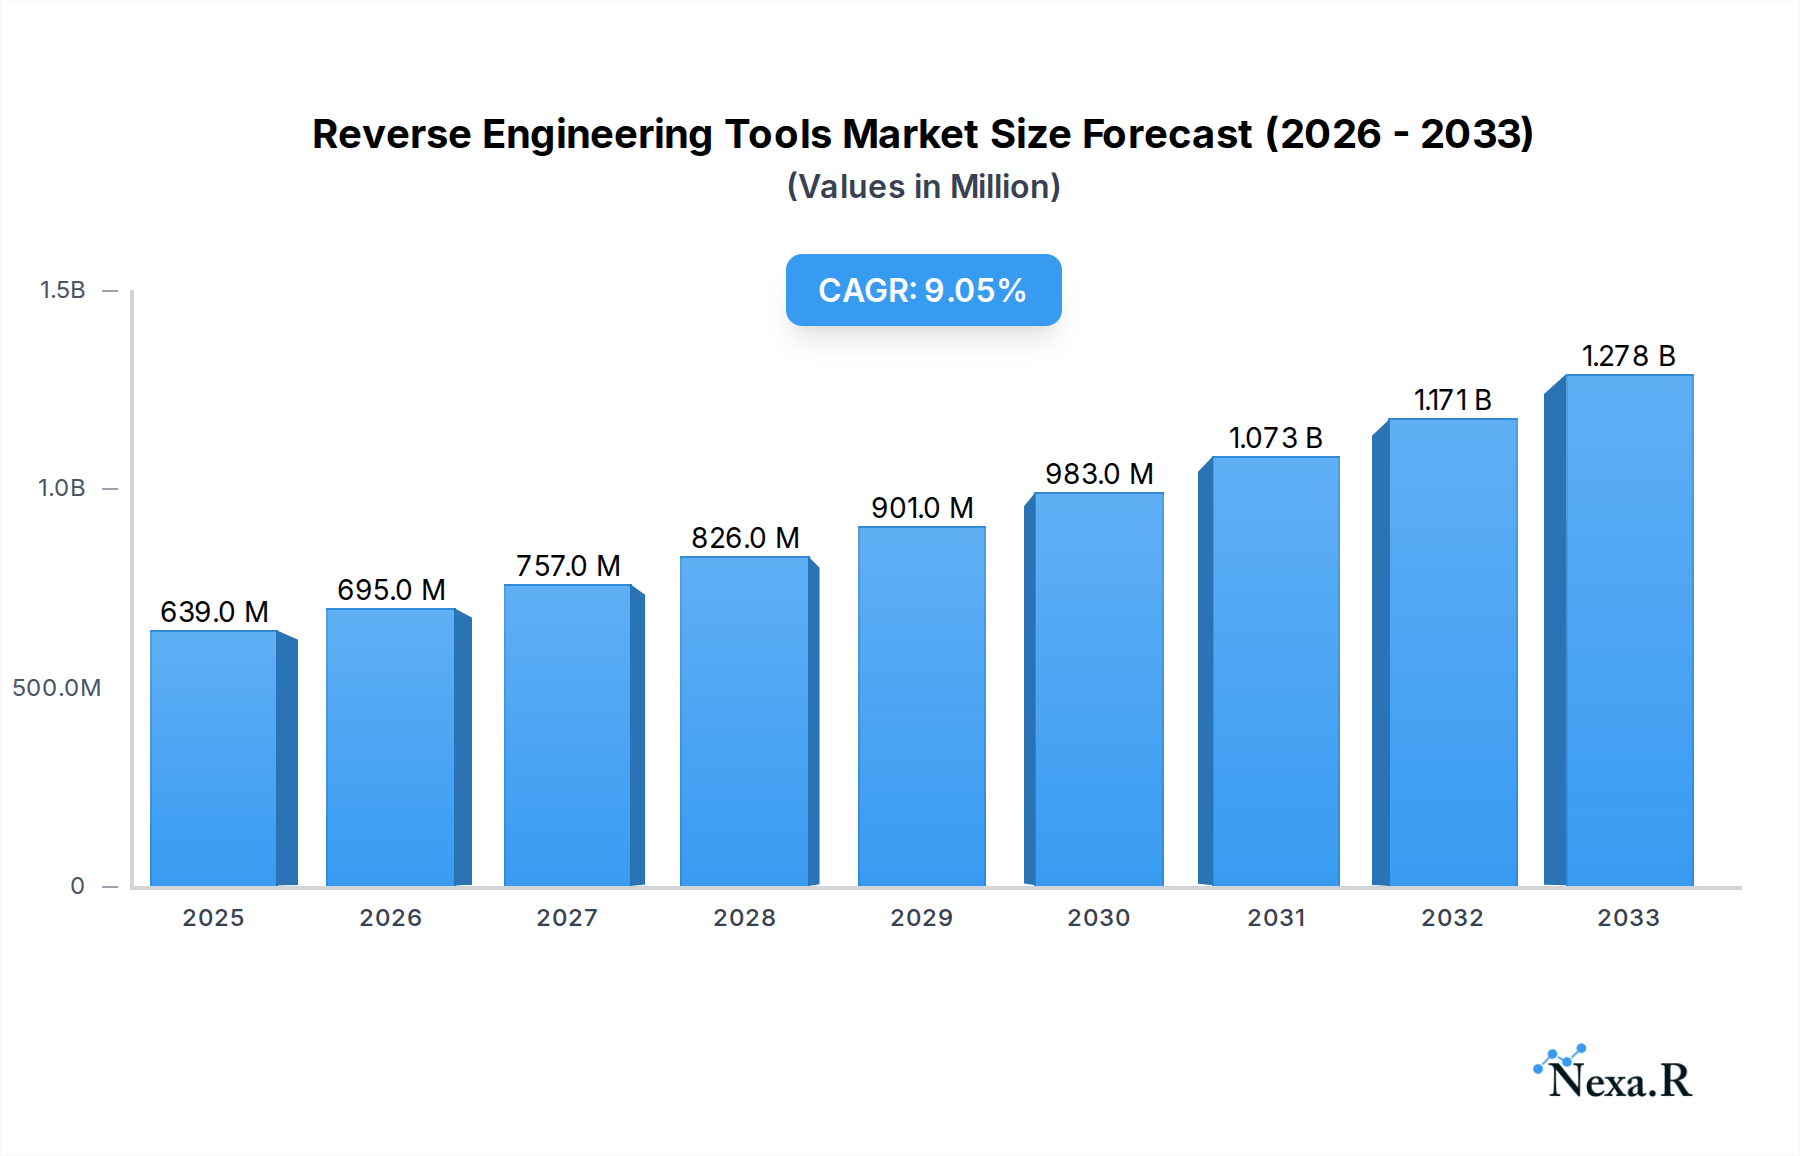
Reverse Engineering Tools Market Size (In Million)
The market is segmented into various applications, with Cybersecurity Professionals, Software Developers, and Hardware Engineers forming the core user base, leveraging these tools for vulnerability assessment, code deciphering, and system diagnostics. The market also categorizes tools by type, including Static Analysis Tools, which examine code without execution, and Dynamic Analysis Tools, which observe program behavior during runtime. Leading companies such as Google, FireEye, Malwarebytes, and Trend Micro are actively innovating, introducing advanced features and more intuitive interfaces to cater to the evolving needs of users. Geographically, North America, with its mature technological infrastructure and high cybersecurity spending, is expected to lead the market. However, the Asia Pacific region, driven by rapid digitalization and a burgeoning software development sector, is poised for substantial growth, presenting significant opportunities for market expansion in the coming years.

Reverse Engineering Tools Company Market Share
Reverse Engineering Tools Market Report: Unveiling Insights for Cybersecurity and Software Development
This comprehensive report delves into the dynamic Reverse Engineering Tools market, providing in-depth analysis and strategic insights for industry professionals. Leveraging advanced methodologies and extensive data, we project market evolution, identify key growth drivers, and pinpoint emerging opportunities. This report is meticulously crafted for cybersecurity professionals, software developers, hardware engineers, and other stakeholders seeking to navigate this critical technology landscape.
Reverse Engineering Tools Market Dynamics & Structure
The global Reverse Engineering Tools market exhibits a moderately concentrated structure, with a blend of large enterprises and specialized niche players contributing to its dynamic ecosystem. Technological innovation is the primary driver, fueled by the escalating sophistication of cyber threats and the continuous evolution of software and hardware. Regulatory frameworks, particularly those related to intellectual property protection and national security, play a significant role in shaping market access and product development. Competitive product substitutes, though limited in direct overlap, emerge from broader security testing and vulnerability assessment solutions. End-user demographics are expanding beyond traditional cybersecurity professionals to encompass software developers seeking to understand complex codebases and hardware engineers analyzing integrated circuits. Mergers and acquisitions (M&A) are a recurring theme, as established players seek to consolidate market share and acquire innovative technologies. For instance, the historical period saw an average of 2-3 significant M&A deals per year, with an estimated deal value range of $50 million to $200 million per acquisition. This trend is anticipated to continue as the market matures, with companies like Google, Core Security Technologies, and Vector35 actively involved in strategic integrations. Innovation barriers include the high cost of research and development and the complexity of reverse engineering sophisticated proprietary systems.
- Market Concentration: Moderately concentrated, featuring both large-scale providers and specialized niche players.
- Technological Innovation: Driven by escalating cyber threats and evolving software/hardware complexity.
- Regulatory Frameworks: Influence IP protection and national security-related market access.
- Competitive Substitutes: Emerging from broader security testing and vulnerability assessment tools.
- End-User Demographics: Expanding beyond cybersecurity to software and hardware engineering.
- M&A Trends: Characterized by consolidation of market share and acquisition of innovative technologies, with an average of 2-3 deals annually valued between $50 million and $200 million.
- Innovation Barriers: High R&D costs and the intricate nature of proprietary systems.
Reverse Engineering Tools Growth Trends & Insights
The Reverse Engineering Tools market is poised for significant expansion over the forecast period, driven by a confluence of escalating cyber threats, the increasing complexity of digital systems, and a growing demand for skilled professionals capable of understanding and dissecting them. The market size, estimated at $2,500 million in the base year 2025, is projected to experience a robust Compound Annual Growth Rate (CAGR) of 12.5% through 2033. This growth is underpinned by a rising adoption rate across various sectors, including government, defense, and enterprise IT, as organizations proactively seek to bolster their security postures and gain deeper insights into malicious code. Technological disruptions, such as advancements in artificial intelligence (AI) for automated code analysis and the development of more sophisticated static and dynamic analysis techniques, are acting as powerful catalysts. Consumer behavior shifts are also playing a crucial role, with a greater emphasis on proactive threat intelligence and a demand for tools that can efficiently uncover vulnerabilities before they are exploited. The market penetration of advanced reverse engineering solutions is expected to increase from approximately 20% in 2025 to over 45% by 2033. Key industry developments observed during the historical period (2019-2024) include the proliferation of ransomware, sophisticated APT attacks, and the increasing use of reverse engineering in firmware analysis, leading to an average market growth of 9.8% CAGR. The integration of AI-powered malware analysis, the rise of cloud-based reverse engineering platforms, and the growing need for binary analysis of IoT devices are significant trends that will shape market trajectory.
Dominant Regions, Countries, or Segments in Reverse Engineering Tools
The Application: Cybersecurity Professionals segment is currently the dominant force driving growth within the global Reverse Engineering Tools market. This is primarily attributed to the escalating sophistication and volume of cyber threats that necessitate advanced analytical capabilities for threat detection, incident response, and digital forensics. The increasing adoption of these tools by cybersecurity firms, government agencies, and enterprise security operations centers (SOCs) underscores their critical role in safeguarding digital assets. Geographically, North America is emerging as the leading region, driven by substantial investments in cybersecurity research and development, a robust presence of leading technology companies, and a high awareness of cyber risks. The United States, in particular, accounts for a significant portion of the global market share due to its advanced technological infrastructure and its position at the forefront of cybersecurity innovation.
- Dominant Application Segment: Cybersecurity Professionals, accounting for an estimated 55% of the market share in 2025.
- Key Drivers: Escalating cyber threats, demand for advanced threat detection and incident response, and proactive vulnerability analysis.
- Market Penetration: High adoption rate among enterprises, government agencies, and cybersecurity firms.
- Dominant Geographic Region: North America, holding an estimated 38% of the global market share in 2025.
- Key Drivers: Substantial investments in cybersecurity R&D, presence of leading technology companies, and high cyber risk awareness.
- Growth Potential: Continued expansion driven by governmental mandates and private sector investment in advanced security solutions.
- Leading Country (within North America): United States, contributing approximately 70% of the North American market share.
- Dominance Factors: Advanced technological infrastructure, leading cybersecurity innovation ecosystem, and strong regulatory support for cyber defense.
- Type Segment Growth: While Cybersecurity Professionals lead, the Type: Static Analysis Tools segment is experiencing substantial growth, projected at a CAGR of 13.2%, due to its non-intrusive nature and ability to analyze code without execution, crucial for malware analysis and vulnerability assessment. Dynamic analysis tools are also growing in tandem, with a projected CAGR of 11.8%, for their ability to observe runtime behavior.
Reverse Engineering Tools Product Landscape
The product landscape for Reverse Engineering Tools is characterized by continuous innovation, with a strong emphasis on enhanced accuracy, speed, and automation. Solutions range from sophisticated disassemblers and decompilers like Hex-Rays and Zynamics, enabling deep code understanding, to dynamic analysis platforms from companies like Cellebrite and Malwarebytes, which monitor software execution in controlled environments. Emerging products are integrating AI and machine learning for more efficient malware signature identification and behavioral analysis. Applications span from uncovering sophisticated malware, analyzing proprietary software for intellectual property theft, to debugging complex embedded systems and identifying hardware vulnerabilities. Unique selling propositions often lie in the breadth of supported architectures, the intuitiveness of user interfaces, and the comprehensive reporting capabilities. Technological advancements are pushing towards cloud-based, collaborative platforms that allow for seamless sharing of analysis results and enhanced threat intelligence.
Key Drivers, Barriers & Challenges in Reverse Engineering Tools
Key Drivers:
- Escalating Cyber Threats: The continuous evolution and sophistication of malware, ransomware, and advanced persistent threats (APTs) are the primary drivers, necessitating robust reverse engineering capabilities for understanding and mitigating these attacks.
- Demand for Vulnerability Assessment: Increasing regulatory pressure and the proactive security needs of organizations drive the demand for tools that can identify software and hardware vulnerabilities before they are exploited.
- Intellectual Property Protection: Companies are increasingly investing in reverse engineering tools to protect their intellectual property and identify instances of software piracy or unauthorized replication.
Barriers & Challenges:
- Complexity of Modern Systems: The intricate nature of modern software, particularly with obfuscation techniques and anti-reversing measures, presents significant challenges for analysis.
- Skilled Workforce Shortage: A critical shortage of highly skilled reverse engineers and malware analysts limits the effective utilization of available tools.
- Ethical and Legal Considerations: The dual-use nature of reverse engineering tools raises ethical and legal concerns regarding their potential misuse for malicious purposes, leading to stringent export controls and licensing requirements.
- Cost of Advanced Tools: The high cost of sophisticated reverse engineering solutions can be a barrier for smaller organizations and independent researchers, with the market size for specialized tools ranging from $50 million to $150 million annually, representing a significant investment.
Emerging Opportunities in Reverse Engineering Tools
Emerging opportunities in the Reverse Engineering Tools market lie in the development of AI-powered automated analysis platforms that can significantly reduce the time and effort required for manual code dissection. The growing Internet of Things (IoT) ecosystem presents a vast untapped market for reverse engineering tools capable of analyzing firmware and hardware vulnerabilities in connected devices, an area with an estimated untapped market potential of $300 million. Furthermore, the increasing demand for secure software development lifecycle (SDLC) integration means opportunities for tools that can be seamlessly embedded into CI/CD pipelines for continuous security testing. The rise of blockchain technology also opens avenues for tools to analyze smart contracts for vulnerabilities.
Growth Accelerators in the Reverse Engineering Tools Industry
Long-term growth in the Reverse Engineering Tools industry will be significantly accelerated by advancements in machine learning and artificial intelligence, enabling more efficient and accurate automated code analysis and threat detection. Strategic partnerships between tool vendors and cybersecurity training institutions will address the skilled workforce shortage, fostering a new generation of reverse engineering experts. Market expansion strategies will focus on developing localized versions of tools and offering tiered pricing models to cater to diverse market segments, including emerging economies. The increasing trend of open-source intelligence (OSINT) integration within reverse engineering platforms will also foster collaborative threat analysis and accelerate knowledge sharing, driving further innovation and adoption.
Key Players Shaping the Reverse Engineering Tools Market
- Core Security Technologies
- Vector35
- FireEye
- Cellebrite
- Malwarebytes
- Whitehat Security
- Veracode
- Keysight Technologies
- Bromium
- Hex-Rays
- Zynamics
- Offensive Security
- F-Secure
- Trend Micro
- AhnLab
Notable Milestones in Reverse Engineering Tools Sector
- 2019: Widespread adoption of AI-driven malware analysis techniques by leading antivirus vendors.
- 2020: Increased focus on firmware reverse engineering due to the rise of IoT device vulnerabilities.
- 2021: Major cybersecurity firms begin integrating static and dynamic analysis capabilities into unified platforms.
- 2022: Significant advancements in deobfuscation techniques for malware analysis.
- 2023: Growing demand for cloud-based reverse engineering solutions for collaborative threat intelligence sharing.
- 2024: Emergence of specialized tools for analyzing vulnerabilities in emerging technologies like quantum computing (early stages).
In-Depth Reverse Engineering Tools Market Outlook
The outlook for the Reverse Engineering Tools market is exceptionally positive, driven by persistent and evolving cybersecurity threats. Growth accelerators, including AI integration, strategic partnerships for talent development, and global market expansion, will fuel sustained expansion. The increasing emphasis on proactive security measures and the growing complexity of digital infrastructures ensure a continuous demand for sophisticated reverse engineering capabilities. The market is expected to witness significant innovation in automated analysis, cloud-based collaboration, and specialized tools for niche applications like IoT and blockchain, solidifying its position as an indispensable component of modern cybersecurity strategies. The total market value is projected to reach over $6,500 million by 2033.
Reverse Engineering Tools Segmentation
-
1. Application
- 1.1. Cybersecurity Professionals
- 1.2. Software Developers
- 1.3. Hardware Engineers
- 1.4. Others
-
2. Type
- 2.1. Static Analysis Tools
- 2.2. Dynamic Analysis Tools
Reverse Engineering Tools Segmentation By Geography
-
1. North America
- 1.1. United States
- 1.2. Canada
- 1.3. Mexico
-
2. South America
- 2.1. Brazil
- 2.2. Argentina
- 2.3. Rest of South America
-
3. Europe
- 3.1. United Kingdom
- 3.2. Germany
- 3.3. France
- 3.4. Italy
- 3.5. Spain
- 3.6. Russia
- 3.7. Benelux
- 3.8. Nordics
- 3.9. Rest of Europe
-
4. Middle East & Africa
- 4.1. Turkey
- 4.2. Israel
- 4.3. GCC
- 4.4. North Africa
- 4.5. South Africa
- 4.6. Rest of Middle East & Africa
-
5. Asia Pacific
- 5.1. China
- 5.2. India
- 5.3. Japan
- 5.4. South Korea
- 5.5. ASEAN
- 5.6. Oceania
- 5.7. Rest of Asia Pacific

Reverse Engineering Tools Regional Market Share
Geographic Coverage of Reverse Engineering Tools
Reverse Engineering Tools REPORT HIGHLIGHTS
| Aspects | Details |
|---|---|
| Study Period | 2020-2034 |
| Base Year | 2025 |
| Estimated Year | 2026 |
| Forecast Period | 2026-2034 |
| Historical Period | 2020-2025 |
| Growth Rate | CAGR of 9.3% from 2020-2034 |
| Segmentation |
|
Table of Contents
- 1. Introduction
- 1.1. Research Scope
- 1.2. Market Segmentation
- 1.3. Research Methodology
- 1.4. Definitions and Assumptions
- 2. Executive Summary
- 2.1. Introduction
- 3. Market Dynamics
- 3.1. Introduction
- 3.2. Market Drivers
- 3.3. Market Restrains
- 3.4. Market Trends
- 4. Market Factor Analysis
- 4.1. Porters Five Forces
- 4.2. Supply/Value Chain
- 4.3. PESTEL analysis
- 4.4. Market Entropy
- 4.5. Patent/Trademark Analysis
- 5. Global Reverse Engineering Tools Analysis, Insights and Forecast, 2020-2032
- 5.1. Market Analysis, Insights and Forecast - by Application
- 5.1.1. Cybersecurity Professionals
- 5.1.2. Software Developers
- 5.1.3. Hardware Engineers
- 5.1.4. Others
- 5.2. Market Analysis, Insights and Forecast - by Type
- 5.2.1. Static Analysis Tools
- 5.2.2. Dynamic Analysis Tools
- 5.3. Market Analysis, Insights and Forecast - by Region
- 5.3.1. North America
- 5.3.2. South America
- 5.3.3. Europe
- 5.3.4. Middle East & Africa
- 5.3.5. Asia Pacific
- 5.1. Market Analysis, Insights and Forecast - by Application
- 6. North America Reverse Engineering Tools Analysis, Insights and Forecast, 2020-2032
- 6.1. Market Analysis, Insights and Forecast - by Application
- 6.1.1. Cybersecurity Professionals
- 6.1.2. Software Developers
- 6.1.3. Hardware Engineers
- 6.1.4. Others
- 6.2. Market Analysis, Insights and Forecast - by Type
- 6.2.1. Static Analysis Tools
- 6.2.2. Dynamic Analysis Tools
- 6.1. Market Analysis, Insights and Forecast - by Application
- 7. South America Reverse Engineering Tools Analysis, Insights and Forecast, 2020-2032
- 7.1. Market Analysis, Insights and Forecast - by Application
- 7.1.1. Cybersecurity Professionals
- 7.1.2. Software Developers
- 7.1.3. Hardware Engineers
- 7.1.4. Others
- 7.2. Market Analysis, Insights and Forecast - by Type
- 7.2.1. Static Analysis Tools
- 7.2.2. Dynamic Analysis Tools
- 7.1. Market Analysis, Insights and Forecast - by Application
- 8. Europe Reverse Engineering Tools Analysis, Insights and Forecast, 2020-2032
- 8.1. Market Analysis, Insights and Forecast - by Application
- 8.1.1. Cybersecurity Professionals
- 8.1.2. Software Developers
- 8.1.3. Hardware Engineers
- 8.1.4. Others
- 8.2. Market Analysis, Insights and Forecast - by Type
- 8.2.1. Static Analysis Tools
- 8.2.2. Dynamic Analysis Tools
- 8.1. Market Analysis, Insights and Forecast - by Application
- 9. Middle East & Africa Reverse Engineering Tools Analysis, Insights and Forecast, 2020-2032
- 9.1. Market Analysis, Insights and Forecast - by Application
- 9.1.1. Cybersecurity Professionals
- 9.1.2. Software Developers
- 9.1.3. Hardware Engineers
- 9.1.4. Others
- 9.2. Market Analysis, Insights and Forecast - by Type
- 9.2.1. Static Analysis Tools
- 9.2.2. Dynamic Analysis Tools
- 9.1. Market Analysis, Insights and Forecast - by Application
- 10. Asia Pacific Reverse Engineering Tools Analysis, Insights and Forecast, 2020-2032
- 10.1. Market Analysis, Insights and Forecast - by Application
- 10.1.1. Cybersecurity Professionals
- 10.1.2. Software Developers
- 10.1.3. Hardware Engineers
- 10.1.4. Others
- 10.2. Market Analysis, Insights and Forecast - by Type
- 10.2.1. Static Analysis Tools
- 10.2.2. Dynamic Analysis Tools
- 10.1. Market Analysis, Insights and Forecast - by Application
- 11. Competitive Analysis
- 11.1. Global Market Share Analysis 2025
- 11.2. Company Profiles
- 11.2.1 Google
- 11.2.1.1. Overview
- 11.2.1.2. Products
- 11.2.1.3. SWOT Analysis
- 11.2.1.4. Recent Developments
- 11.2.1.5. Financials (Based on Availability)
- 11.2.2 Core Security Technologies
- 11.2.2.1. Overview
- 11.2.2.2. Products
- 11.2.2.3. SWOT Analysis
- 11.2.2.4. Recent Developments
- 11.2.2.5. Financials (Based on Availability)
- 11.2.3 Vector35
- 11.2.3.1. Overview
- 11.2.3.2. Products
- 11.2.3.3. SWOT Analysis
- 11.2.3.4. Recent Developments
- 11.2.3.5. Financials (Based on Availability)
- 11.2.4 FireEye
- 11.2.4.1. Overview
- 11.2.4.2. Products
- 11.2.4.3. SWOT Analysis
- 11.2.4.4. Recent Developments
- 11.2.4.5. Financials (Based on Availability)
- 11.2.5 Cellebrite
- 11.2.5.1. Overview
- 11.2.5.2. Products
- 11.2.5.3. SWOT Analysis
- 11.2.5.4. Recent Developments
- 11.2.5.5. Financials (Based on Availability)
- 11.2.6 Malwarebytes
- 11.2.6.1. Overview
- 11.2.6.2. Products
- 11.2.6.3. SWOT Analysis
- 11.2.6.4. Recent Developments
- 11.2.6.5. Financials (Based on Availability)
- 11.2.7 Whitehat Security
- 11.2.7.1. Overview
- 11.2.7.2. Products
- 11.2.7.3. SWOT Analysis
- 11.2.7.4. Recent Developments
- 11.2.7.5. Financials (Based on Availability)
- 11.2.8 Veracode
- 11.2.8.1. Overview
- 11.2.8.2. Products
- 11.2.8.3. SWOT Analysis
- 11.2.8.4. Recent Developments
- 11.2.8.5. Financials (Based on Availability)
- 11.2.9 Keysight Technologies
- 11.2.9.1. Overview
- 11.2.9.2. Products
- 11.2.9.3. SWOT Analysis
- 11.2.9.4. Recent Developments
- 11.2.9.5. Financials (Based on Availability)
- 11.2.10 Bromium
- 11.2.10.1. Overview
- 11.2.10.2. Products
- 11.2.10.3. SWOT Analysis
- 11.2.10.4. Recent Developments
- 11.2.10.5. Financials (Based on Availability)
- 11.2.11 Hex-Rays
- 11.2.11.1. Overview
- 11.2.11.2. Products
- 11.2.11.3. SWOT Analysis
- 11.2.11.4. Recent Developments
- 11.2.11.5. Financials (Based on Availability)
- 11.2.12 Zynamics
- 11.2.12.1. Overview
- 11.2.12.2. Products
- 11.2.12.3. SWOT Analysis
- 11.2.12.4. Recent Developments
- 11.2.12.5. Financials (Based on Availability)
- 11.2.13 Offensive Security
- 11.2.13.1. Overview
- 11.2.13.2. Products
- 11.2.13.3. SWOT Analysis
- 11.2.13.4. Recent Developments
- 11.2.13.5. Financials (Based on Availability)
- 11.2.14 F-Secure
- 11.2.14.1. Overview
- 11.2.14.2. Products
- 11.2.14.3. SWOT Analysis
- 11.2.14.4. Recent Developments
- 11.2.14.5. Financials (Based on Availability)
- 11.2.15 Trend Micro
- 11.2.15.1. Overview
- 11.2.15.2. Products
- 11.2.15.3. SWOT Analysis
- 11.2.15.4. Recent Developments
- 11.2.15.5. Financials (Based on Availability)
- 11.2.16 AhnLab
- 11.2.16.1. Overview
- 11.2.16.2. Products
- 11.2.16.3. SWOT Analysis
- 11.2.16.4. Recent Developments
- 11.2.16.5. Financials (Based on Availability)
- 11.2.1 Google
List of Figures
- Figure 1: Global Reverse Engineering Tools Revenue Breakdown (million, %) by Region 2025 & 2033
- Figure 2: North America Reverse Engineering Tools Revenue (million), by Application 2025 & 2033
- Figure 3: North America Reverse Engineering Tools Revenue Share (%), by Application 2025 & 2033
- Figure 4: North America Reverse Engineering Tools Revenue (million), by Type 2025 & 2033
- Figure 5: North America Reverse Engineering Tools Revenue Share (%), by Type 2025 & 2033
- Figure 6: North America Reverse Engineering Tools Revenue (million), by Country 2025 & 2033
- Figure 7: North America Reverse Engineering Tools Revenue Share (%), by Country 2025 & 2033
- Figure 8: South America Reverse Engineering Tools Revenue (million), by Application 2025 & 2033
- Figure 9: South America Reverse Engineering Tools Revenue Share (%), by Application 2025 & 2033
- Figure 10: South America Reverse Engineering Tools Revenue (million), by Type 2025 & 2033
- Figure 11: South America Reverse Engineering Tools Revenue Share (%), by Type 2025 & 2033
- Figure 12: South America Reverse Engineering Tools Revenue (million), by Country 2025 & 2033
- Figure 13: South America Reverse Engineering Tools Revenue Share (%), by Country 2025 & 2033
- Figure 14: Europe Reverse Engineering Tools Revenue (million), by Application 2025 & 2033
- Figure 15: Europe Reverse Engineering Tools Revenue Share (%), by Application 2025 & 2033
- Figure 16: Europe Reverse Engineering Tools Revenue (million), by Type 2025 & 2033
- Figure 17: Europe Reverse Engineering Tools Revenue Share (%), by Type 2025 & 2033
- Figure 18: Europe Reverse Engineering Tools Revenue (million), by Country 2025 & 2033
- Figure 19: Europe Reverse Engineering Tools Revenue Share (%), by Country 2025 & 2033
- Figure 20: Middle East & Africa Reverse Engineering Tools Revenue (million), by Application 2025 & 2033
- Figure 21: Middle East & Africa Reverse Engineering Tools Revenue Share (%), by Application 2025 & 2033
- Figure 22: Middle East & Africa Reverse Engineering Tools Revenue (million), by Type 2025 & 2033
- Figure 23: Middle East & Africa Reverse Engineering Tools Revenue Share (%), by Type 2025 & 2033
- Figure 24: Middle East & Africa Reverse Engineering Tools Revenue (million), by Country 2025 & 2033
- Figure 25: Middle East & Africa Reverse Engineering Tools Revenue Share (%), by Country 2025 & 2033
- Figure 26: Asia Pacific Reverse Engineering Tools Revenue (million), by Application 2025 & 2033
- Figure 27: Asia Pacific Reverse Engineering Tools Revenue Share (%), by Application 2025 & 2033
- Figure 28: Asia Pacific Reverse Engineering Tools Revenue (million), by Type 2025 & 2033
- Figure 29: Asia Pacific Reverse Engineering Tools Revenue Share (%), by Type 2025 & 2033
- Figure 30: Asia Pacific Reverse Engineering Tools Revenue (million), by Country 2025 & 2033
- Figure 31: Asia Pacific Reverse Engineering Tools Revenue Share (%), by Country 2025 & 2033
List of Tables
- Table 1: Global Reverse Engineering Tools Revenue million Forecast, by Application 2020 & 2033
- Table 2: Global Reverse Engineering Tools Revenue million Forecast, by Type 2020 & 2033
- Table 3: Global Reverse Engineering Tools Revenue million Forecast, by Region 2020 & 2033
- Table 4: Global Reverse Engineering Tools Revenue million Forecast, by Application 2020 & 2033
- Table 5: Global Reverse Engineering Tools Revenue million Forecast, by Type 2020 & 2033
- Table 6: Global Reverse Engineering Tools Revenue million Forecast, by Country 2020 & 2033
- Table 7: United States Reverse Engineering Tools Revenue (million) Forecast, by Application 2020 & 2033
- Table 8: Canada Reverse Engineering Tools Revenue (million) Forecast, by Application 2020 & 2033
- Table 9: Mexico Reverse Engineering Tools Revenue (million) Forecast, by Application 2020 & 2033
- Table 10: Global Reverse Engineering Tools Revenue million Forecast, by Application 2020 & 2033
- Table 11: Global Reverse Engineering Tools Revenue million Forecast, by Type 2020 & 2033
- Table 12: Global Reverse Engineering Tools Revenue million Forecast, by Country 2020 & 2033
- Table 13: Brazil Reverse Engineering Tools Revenue (million) Forecast, by Application 2020 & 2033
- Table 14: Argentina Reverse Engineering Tools Revenue (million) Forecast, by Application 2020 & 2033
- Table 15: Rest of South America Reverse Engineering Tools Revenue (million) Forecast, by Application 2020 & 2033
- Table 16: Global Reverse Engineering Tools Revenue million Forecast, by Application 2020 & 2033
- Table 17: Global Reverse Engineering Tools Revenue million Forecast, by Type 2020 & 2033
- Table 18: Global Reverse Engineering Tools Revenue million Forecast, by Country 2020 & 2033
- Table 19: United Kingdom Reverse Engineering Tools Revenue (million) Forecast, by Application 2020 & 2033
- Table 20: Germany Reverse Engineering Tools Revenue (million) Forecast, by Application 2020 & 2033
- Table 21: France Reverse Engineering Tools Revenue (million) Forecast, by Application 2020 & 2033
- Table 22: Italy Reverse Engineering Tools Revenue (million) Forecast, by Application 2020 & 2033
- Table 23: Spain Reverse Engineering Tools Revenue (million) Forecast, by Application 2020 & 2033
- Table 24: Russia Reverse Engineering Tools Revenue (million) Forecast, by Application 2020 & 2033
- Table 25: Benelux Reverse Engineering Tools Revenue (million) Forecast, by Application 2020 & 2033
- Table 26: Nordics Reverse Engineering Tools Revenue (million) Forecast, by Application 2020 & 2033
- Table 27: Rest of Europe Reverse Engineering Tools Revenue (million) Forecast, by Application 2020 & 2033
- Table 28: Global Reverse Engineering Tools Revenue million Forecast, by Application 2020 & 2033
- Table 29: Global Reverse Engineering Tools Revenue million Forecast, by Type 2020 & 2033
- Table 30: Global Reverse Engineering Tools Revenue million Forecast, by Country 2020 & 2033
- Table 31: Turkey Reverse Engineering Tools Revenue (million) Forecast, by Application 2020 & 2033
- Table 32: Israel Reverse Engineering Tools Revenue (million) Forecast, by Application 2020 & 2033
- Table 33: GCC Reverse Engineering Tools Revenue (million) Forecast, by Application 2020 & 2033
- Table 34: North Africa Reverse Engineering Tools Revenue (million) Forecast, by Application 2020 & 2033
- Table 35: South Africa Reverse Engineering Tools Revenue (million) Forecast, by Application 2020 & 2033
- Table 36: Rest of Middle East & Africa Reverse Engineering Tools Revenue (million) Forecast, by Application 2020 & 2033
- Table 37: Global Reverse Engineering Tools Revenue million Forecast, by Application 2020 & 2033
- Table 38: Global Reverse Engineering Tools Revenue million Forecast, by Type 2020 & 2033
- Table 39: Global Reverse Engineering Tools Revenue million Forecast, by Country 2020 & 2033
- Table 40: China Reverse Engineering Tools Revenue (million) Forecast, by Application 2020 & 2033
- Table 41: India Reverse Engineering Tools Revenue (million) Forecast, by Application 2020 & 2033
- Table 42: Japan Reverse Engineering Tools Revenue (million) Forecast, by Application 2020 & 2033
- Table 43: South Korea Reverse Engineering Tools Revenue (million) Forecast, by Application 2020 & 2033
- Table 44: ASEAN Reverse Engineering Tools Revenue (million) Forecast, by Application 2020 & 2033
- Table 45: Oceania Reverse Engineering Tools Revenue (million) Forecast, by Application 2020 & 2033
- Table 46: Rest of Asia Pacific Reverse Engineering Tools Revenue (million) Forecast, by Application 2020 & 2033
Frequently Asked Questions
1. What is the projected Compound Annual Growth Rate (CAGR) of the Reverse Engineering Tools?
The projected CAGR is approximately 9.3%.
2. Which companies are prominent players in the Reverse Engineering Tools?
Key companies in the market include Google, Core Security Technologies, Vector35, FireEye, Cellebrite, Malwarebytes, Whitehat Security, Veracode, Keysight Technologies, Bromium, Hex-Rays, Zynamics, Offensive Security, F-Secure, Trend Micro, AhnLab.
3. What are the main segments of the Reverse Engineering Tools?
The market segments include Application, Type.
4. Can you provide details about the market size?
The market size is estimated to be USD 639 million as of 2022.
5. What are some drivers contributing to market growth?
N/A
6. What are the notable trends driving market growth?
N/A
7. Are there any restraints impacting market growth?
N/A
8. Can you provide examples of recent developments in the market?
N/A
9. What pricing options are available for accessing the report?
Pricing options include single-user, multi-user, and enterprise licenses priced at USD 3950.00, USD 5925.00, and USD 7900.00 respectively.
10. Is the market size provided in terms of value or volume?
The market size is provided in terms of value, measured in million.
11. Are there any specific market keywords associated with the report?
Yes, the market keyword associated with the report is "Reverse Engineering Tools," which aids in identifying and referencing the specific market segment covered.
12. How do I determine which pricing option suits my needs best?
The pricing options vary based on user requirements and access needs. Individual users may opt for single-user licenses, while businesses requiring broader access may choose multi-user or enterprise licenses for cost-effective access to the report.
13. Are there any additional resources or data provided in the Reverse Engineering Tools report?
While the report offers comprehensive insights, it's advisable to review the specific contents or supplementary materials provided to ascertain if additional resources or data are available.
14. How can I stay updated on further developments or reports in the Reverse Engineering Tools?
To stay informed about further developments, trends, and reports in the Reverse Engineering Tools, consider subscribing to industry newsletters, following relevant companies and organizations, or regularly checking reputable industry news sources and publications.
Methodology
Step 1 - Identification of Relevant Samples Size from Population Database


Step 2 - Approaches for Defining Global Market Size (Value, Volume* & Price*)

Note*: In applicable scenarios
Step 3 - Data Sources
Primary Research
- Web Analytics
- Survey Reports
- Research Institute
- Latest Research Reports
- Opinion Leaders
Secondary Research
- Annual Reports
- White Paper
- Latest Press Release
- Industry Association
- Paid Database
- Investor Presentations

Step 4 - Data Triangulation
Involves using different sources of information in order to increase the validity of a study
These sources are likely to be stakeholders in a program - participants, other researchers, program staff, other community members, and so on.
Then we put all data in single framework & apply various statistical tools to find out the dynamic on the market.
During the analysis stage, feedback from the stakeholder groups would be compared to determine areas of agreement as well as areas of divergence