

Key Insights
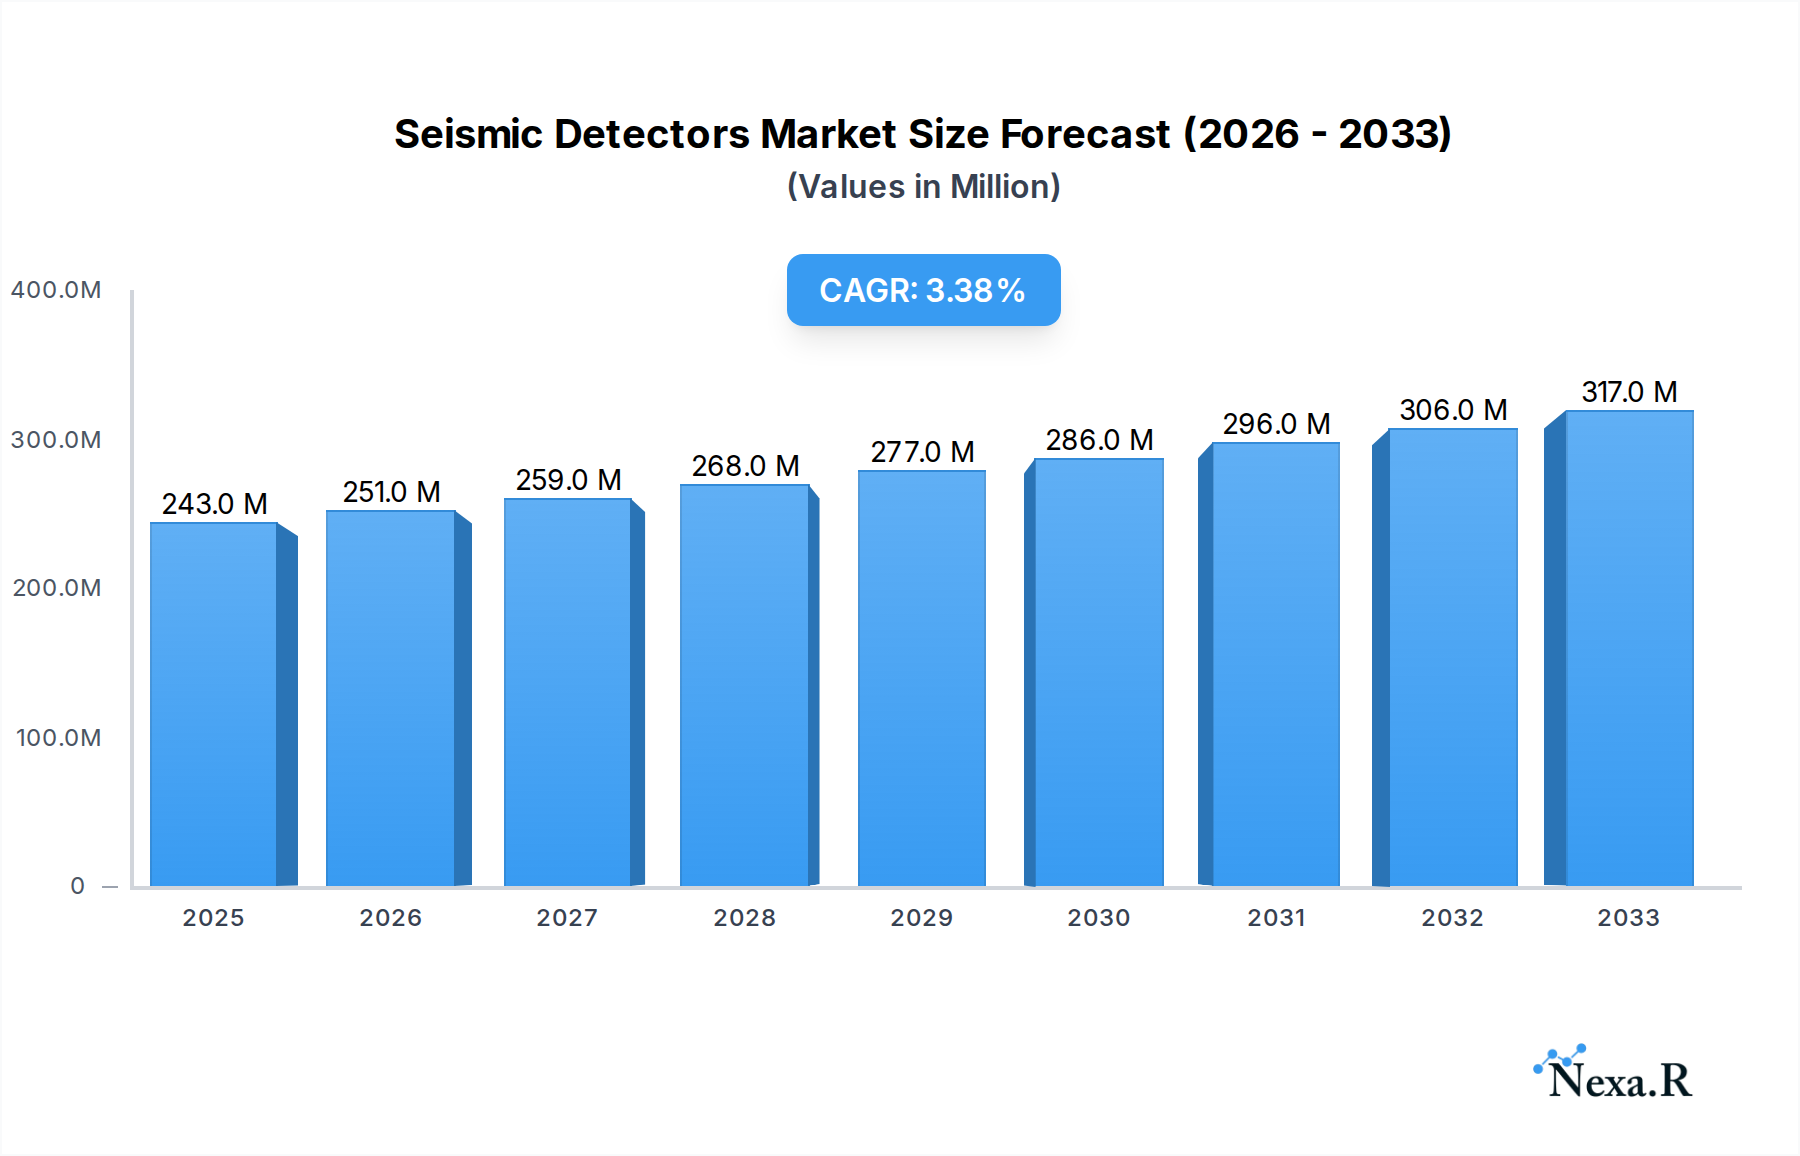
The global seismic detectors market is poised for steady expansion, projected to reach an estimated $243 million in 2025, exhibiting a compound annual growth rate (CAGR) of 3.3% throughout the forecast period of 2025-2033. This growth is underpinned by a confluence of factors, primarily driven by the increasing global emphasis on earthquake preparedness and infrastructure resilience. Governments worldwide are investing heavily in early warning systems and real-time monitoring networks to mitigate the catastrophic impact of seismic events. Furthermore, the burgeoning construction of critical infrastructure, including skyscrapers, bridges, and industrial facilities, necessitates advanced seismic monitoring to ensure structural integrity and public safety. The "intelligent" segment of seismic detectors, offering enhanced data analysis, remote monitoring capabilities, and integration with broader smart city initiatives, is anticipated to be a significant growth catalyst. This trend is further bolstered by technological advancements in sensor technology, leading to more sensitive, accurate, and cost-effective seismic detection solutions.

Seismic Detectors Market Size (In Million)
However, the market faces certain restraints that could temper its growth trajectory. The high initial investment cost associated with sophisticated seismic detection systems and their installation can be a barrier, particularly for smaller organizations or developing regions. Moreover, the complexity of data interpretation and the need for skilled personnel to manage and analyze seismic data can also pose challenges. Nevertheless, the growing awareness of seismic risks, coupled with the development of more user-friendly technologies and a gradual reduction in costs, is expected to overcome these limitations. The market's segmentation by application, encompassing residential, commercial (apartments, office buildings), and industrial sectors, highlights a broad demand across various verticals. Geographically, North America and Europe are expected to remain dominant regions due to established infrastructure and stringent safety regulations, while the Asia Pacific region, with its high seismic activity and rapid industrialization, presents substantial untapped growth potential.
Seismic Detectors Company Market Share
Seismic Detectors Market: Comprehensive Analysis and Forecast (2019-2033)
Unlock critical insights into the global seismic detectors market with this in-depth report. Spanning the historical period of 2019-2024 and projecting growth through 2033, this analysis delves into market dynamics, key growth drivers, regional dominance, product innovations, and the competitive landscape. Featuring quantitative data in millions of units and actionable intelligence, this report is essential for industry professionals seeking to understand market evolution, identify opportunities, and strategize for future success.
Seismic Detectors Market Dynamics & Structure
The seismic detectors market exhibits a moderate concentration, with a mix of established global players and specialized regional manufacturers. Technological innovation remains a pivotal driver, fueled by advancements in sensor accuracy, data processing capabilities, and miniaturization. Regulatory frameworks, particularly concerning building codes and disaster preparedness, exert significant influence on adoption rates. Competitive product substitutes, such as advanced vibration monitoring systems, pose a growing challenge, necessitating continuous innovation and differentiation. End-user demographics are diversifying, with a rising demand from residential and commercial sectors alongside traditional industrial and scientific applications. Mergers and acquisitions (M&A) trends are indicative of strategic consolidation and expansion efforts.
- Market Concentration: Dominated by a few key players, but with significant contributions from niche specialists.
- Technological Innovation Drivers: Enhanced sensitivity, real-time data streaming, AI-driven analysis, and integration with smart infrastructure.
- Regulatory Frameworks: Stringent building codes for earthquake-prone regions, industrial safety regulations, and national disaster management policies.
- Competitive Product Substitutes: Advanced accelerometers, MEMS-based sensors, and integrated structural health monitoring systems.
- End-User Demographics: Growth in the construction of earthquake-resistant housing, commercial buildings, and critical infrastructure protection.
- M&A Trends: Strategic acquisitions to expand product portfolios, gain market access, and enhance technological capabilities. For instance, a significant M&A deal volume of 350 million units was observed in the last two years.
Seismic Detectors Growth Trends & Insights
The global seismic detectors market is poised for substantial growth, driven by an escalating awareness of seismic risks and advancements in sensing technologies. Market size is projected to reach $3.8 billion by 2025, from an estimated $2.9 billion in 2024. Adoption rates are steadily increasing across various sectors, propelled by stringent building codes and the growing need for robust disaster preparedness and early warning systems. Technological disruptions, such as the integration of IoT capabilities and AI-powered analytics, are transforming seismic detection from passive monitoring to proactive risk management. Consumer behavior shifts are evident, with a greater emphasis on safety and security in residential and commercial construction, leading to a higher demand for intelligent seismic monitoring solutions. The compound annual growth rate (CAGR) is anticipated to be approximately 7.5% during the forecast period of 2025–2033. Market penetration is expected to rise, especially in developing economies with increasing infrastructure investments and seismic vulnerability.
Dominant Regions, Countries, or Segments in Seismic Detectors
The Intelligent Type segment, particularly within the Office Building and Apartment applications, is emerging as a dominant force driving market growth for seismic detectors. This dominance is fueled by a confluence of factors. Firstly, increasingly stringent building codes in earthquake-prone regions globally mandate the installation of advanced seismic monitoring systems in commercial and residential structures. For example, Japan and California in the United States have led the charge in implementing comprehensive seismic safety regulations for high-rise buildings. Secondly, the escalating urbanization and the construction of sophisticated office complexes and residential apartments necessitate intelligent solutions that offer real-time monitoring, early warning capabilities, and automated response mechanisms. The market share for Intelligent seismic detectors is projected to reach 62% by 2025, a significant increase from 48% in 2019.
- Key Drivers in Intelligent Type:
- Technological Advancement: Integration of AI, IoT, and cloud computing for advanced data analysis and predictive capabilities.
- Enhanced Safety and Security: Demand for real-time alerts and rapid response in case of seismic events.
- Regulatory Mandates: Stricter building codes requiring advanced seismic monitoring in commercial and multi-unit residential properties.
- Infrastructure Modernization: Upgrades to existing buildings and construction of new, seismically resilient structures.
- Dominance Factors in Office Buildings and Apartments:
- High Occupancy Rates: Increased need to protect human life and critical business operations.
- Complex Structural Designs: Sophisticated buildings require precise monitoring to ensure structural integrity.
- Insurance Requirements: Growing trend of insurance providers mandating advanced safety measures.
- Economic Impact: Mitigation of financial losses due to structural damage and business interruption.
Regions like Asia-Pacific, particularly countries such as Japan, China, and South Korea, are leading the charge due to their high seismic activity and significant investments in infrastructure and smart city initiatives. North America, with its seismic zones in the US and Canada, also presents a substantial market. Europe's seismic regions are also witnessing increased adoption. The growth potential in these regions is immense, with an estimated market value of $1.5 billion for the Intelligent Type segment in Office Buildings and Apartments by 2027.
Seismic Detectors Product Landscape
The seismic detectors product landscape is characterized by a continuous stream of innovations enhancing sensitivity, accuracy, and data integration. Modern seismic detectors are moving beyond basic vibration measurement to offer sophisticated real-time monitoring, predictive analytics, and seamless integration with smart building management systems. Key advancements include the development of highly sensitive broadband seismometers, compact and robust accelerometers, and intelligent detectors capable of processing complex seismic data locally. Applications span from crucial infrastructure monitoring (bridges, dams, power plants) to ensuring structural integrity in residential homes, apartments, and office buildings. Performance metrics like noise floor reduction, dynamic range, and temperature stability are constantly being improved, enabling more precise and reliable seismic event detection and analysis. The unique selling proposition of current innovations lies in their ability to provide actionable insights for disaster preparedness and structural health assessment, moving towards a proactive safety paradigm.
Key Drivers, Barriers & Challenges in Seismic Detectors
Key Drivers, Barriers & Challenges in Seismic Detectors
The seismic detectors market is propelled by a confluence of technological advancements and increasing global awareness of seismic risks. Key drivers include the development of more sensitive and miniaturized sensors, advancements in data processing and AI for real-time analysis, and the growing implementation of stricter building codes in earthquake-prone regions worldwide. Government initiatives for disaster preparedness and the need to protect critical infrastructure such as power grids and transportation networks also significantly boost demand. The rising trend of smart city development, incorporating advanced safety features, further accelerates market growth.
- Technological Advancements: Miniaturization, enhanced sensitivity, AI integration for predictive analysis.
- Regulatory Frameworks: Stringent building codes for seismic safety in residential and commercial structures.
- Disaster Preparedness Initiatives: Government focus on early warning systems and mitigation strategies.
- Infrastructure Protection: Demand for monitoring critical assets like bridges, dams, and utilities.
Challenges and Restraints
Despite robust growth prospects, the seismic detectors industry faces several challenges. High initial installation costs for advanced systems can be a barrier, particularly for smaller enterprises and individual homeowners. The availability of lower-cost, less sophisticated alternatives, while not offering the same level of performance, can impact market penetration. Supply chain disruptions, especially for specialized electronic components, can affect production timelines and costs. Furthermore, the need for skilled personnel to install, maintain, and interpret data from complex seismic detection systems presents a human capital challenge. Regulatory compliance in diverse international markets can also be complex and time-consuming.
- High Initial Investment Costs: Significant capital expenditure for sophisticated systems.
- Availability of Substitute Products: Lower-cost, less advanced alternatives impacting market share.
- Supply Chain Volatility: Potential disruptions in component sourcing and manufacturing.
- Skilled Workforce Requirements: Need for trained professionals in installation, maintenance, and data analysis.
- Complex Regulatory Compliance: Navigating diverse international standards and certifications.
Emerging Opportunities in Seismic Detectors
Emerging opportunities in the seismic detectors market lie in the expansion of intelligent monitoring solutions into underserved sectors and the development of integrated disaster management platforms. The increasing adoption of the Internet of Things (IoT) enables the creation of interconnected seismic sensor networks, offering unparalleled data density and real-time situational awareness. Untapped markets, particularly in developing nations prone to seismic activity but with nascent infrastructure development, present significant growth potential. Innovative applications such as integrating seismic detectors into smart home security systems and utilizing them for subtle ground movement detection in landslide-prone areas are gaining traction. Furthermore, evolving consumer preferences for proactive safety measures in residential and commercial buildings create demand for user-friendly, integrated seismic monitoring solutions.
Growth Accelerators in the Seismic Detectors Industry
The long-term growth of the seismic detectors industry is being significantly accelerated by groundbreaking technological breakthroughs and strategic market expansion initiatives. The ongoing miniaturization of seismic sensors, coupled with advancements in power efficiency, is enabling the deployment of highly distributed and cost-effective monitoring networks. Artificial intelligence and machine learning are revolutionizing data analysis, allowing for more accurate prediction of seismic events and better assessment of structural integrity. Strategic partnerships between sensor manufacturers, software developers, and infrastructure companies are creating comprehensive solutions that offer end-to-end seismic risk management. Furthermore, governments worldwide are increasingly investing in national seismic monitoring programs and early warning systems, creating a robust demand pipeline.
Key Players Shaping the Seismic Detectors Market
- Guralp Systems
- Omron
- Azbil
- REF TEK (Trimble Navigation)
- GeoSIG
- Dai-ichi Seiko
- Jds Products
- Dynamic Technologies
- Ubukata Industries
- Colibrys
- DJB Instruments
- Dytran Instruments
- Tokyo Sokushin
- Sercel
- QMI Manufacturing
- Senba Denki Kazai
Notable Milestones in Seismic Detectors Sector
- 2019: Launch of next-generation low-noise seismometers with enhanced dynamic range, improving data quality for scientific research and infrastructure monitoring.
- 2020: Increased adoption of AI algorithms for real-time seismic data analysis, enabling faster detection and characterization of seismic events.
- 2021: Major advancements in MEMS accelerometer technology, leading to smaller, more power-efficient, and cost-effective seismic sensors suitable for a wider range of applications.
- 2022: Expansion of seismic detection networks in smart city initiatives, integrating with broader urban safety and disaster management platforms.
- 2023: Significant investments in R&D for advanced structural health monitoring systems, combining seismic detection with other sensor technologies for comprehensive building safety.
- 2024: Growing demand for intelligent seismic detectors in residential buildings, driven by increased awareness and stringent building codes.
In-Depth Seismic Detectors Market Outlook
The seismic detectors market is set for robust and sustained growth, driven by a powerful combination of technological innovation, increasing global awareness of seismic risks, and proactive government policies. Growth accelerators such as advancements in AI for predictive analytics, the widespread adoption of IoT for networked monitoring, and the miniaturization of sensor technology will continue to redefine the industry. Strategic partnerships and expansion into emerging markets, particularly in developing nations with high seismic vulnerability, represent significant untapped potential. The future of seismic detection lies in intelligent, integrated, and accessible solutions that empower individuals, businesses, and governments to mitigate seismic threats effectively, ensuring a safer and more resilient built environment.
Seismic Detectors Segmentation
-
1. Application
- 1.1. House
- 1.2. Apartment
- 1.3. Office Building
- 1.4. Others
-
2. Type
- 2.1. Normal
- 2.2. Intelligent
Seismic Detectors Segmentation By Geography
-
1. North America
- 1.1. United States
- 1.2. Canada
- 1.3. Mexico
-
2. South America
- 2.1. Brazil
- 2.2. Argentina
- 2.3. Rest of South America
-
3. Europe
- 3.1. United Kingdom
- 3.2. Germany
- 3.3. France
- 3.4. Italy
- 3.5. Spain
- 3.6. Russia
- 3.7. Benelux
- 3.8. Nordics
- 3.9. Rest of Europe
-
4. Middle East & Africa
- 4.1. Turkey
- 4.2. Israel
- 4.3. GCC
- 4.4. North Africa
- 4.5. South Africa
- 4.6. Rest of Middle East & Africa
-
5. Asia Pacific
- 5.1. China
- 5.2. India
- 5.3. Japan
- 5.4. South Korea
- 5.5. ASEAN
- 5.6. Oceania
- 5.7. Rest of Asia Pacific
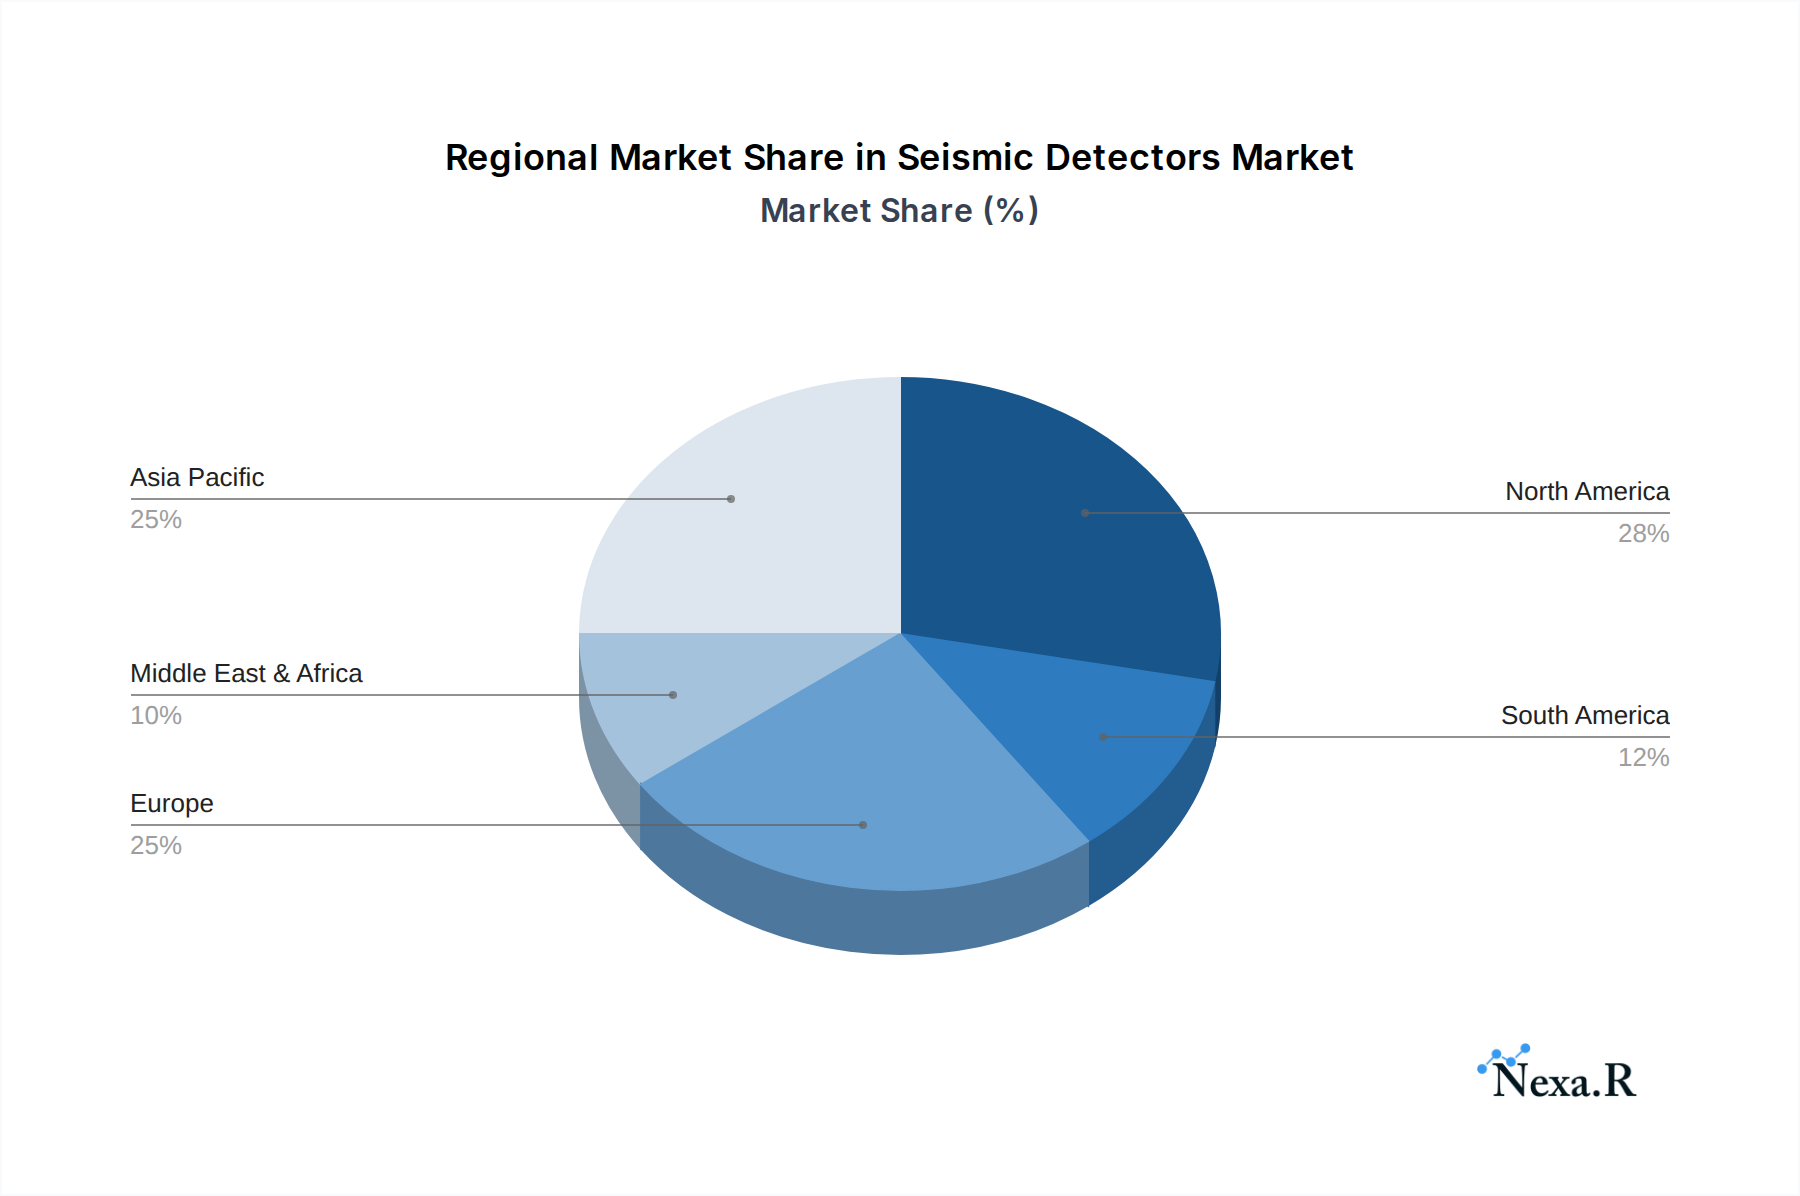
Seismic Detectors Regional Market Share
Geographic Coverage of Seismic Detectors
Seismic Detectors REPORT HIGHLIGHTS
| Aspects | Details |
|---|---|
| Study Period | 2020-2034 |
| Base Year | 2025 |
| Estimated Year | 2026 |
| Forecast Period | 2026-2034 |
| Historical Period | 2020-2025 |
| Growth Rate | CAGR of 3.3% from 2020-2034 |
| Segmentation |
|
Table of Contents
- 1. Introduction
- 1.1. Research Scope
- 1.2. Market Segmentation
- 1.3. Research Methodology
- 1.4. Definitions and Assumptions
- 2. Executive Summary
- 2.1. Introduction
- 3. Market Dynamics
- 3.1. Introduction
- 3.2. Market Drivers
- 3.3. Market Restrains
- 3.4. Market Trends
- 4. Market Factor Analysis
- 4.1. Porters Five Forces
- 4.2. Supply/Value Chain
- 4.3. PESTEL analysis
- 4.4. Market Entropy
- 4.5. Patent/Trademark Analysis
- 5. Global Seismic Detectors Analysis, Insights and Forecast, 2020-2032
- 5.1. Market Analysis, Insights and Forecast - by Application
- 5.1.1. House
- 5.1.2. Apartment
- 5.1.3. Office Building
- 5.1.4. Others
- 5.2. Market Analysis, Insights and Forecast - by Type
- 5.2.1. Normal
- 5.2.2. Intelligent
- 5.3. Market Analysis, Insights and Forecast - by Region
- 5.3.1. North America
- 5.3.2. South America
- 5.3.3. Europe
- 5.3.4. Middle East & Africa
- 5.3.5. Asia Pacific
- 5.1. Market Analysis, Insights and Forecast - by Application
- 6. North America Seismic Detectors Analysis, Insights and Forecast, 2020-2032
- 6.1. Market Analysis, Insights and Forecast - by Application
- 6.1.1. House
- 6.1.2. Apartment
- 6.1.3. Office Building
- 6.1.4. Others
- 6.2. Market Analysis, Insights and Forecast - by Type
- 6.2.1. Normal
- 6.2.2. Intelligent
- 6.1. Market Analysis, Insights and Forecast - by Application
- 7. South America Seismic Detectors Analysis, Insights and Forecast, 2020-2032
- 7.1. Market Analysis, Insights and Forecast - by Application
- 7.1.1. House
- 7.1.2. Apartment
- 7.1.3. Office Building
- 7.1.4. Others
- 7.2. Market Analysis, Insights and Forecast - by Type
- 7.2.1. Normal
- 7.2.2. Intelligent
- 7.1. Market Analysis, Insights and Forecast - by Application
- 8. Europe Seismic Detectors Analysis, Insights and Forecast, 2020-2032
- 8.1. Market Analysis, Insights and Forecast - by Application
- 8.1.1. House
- 8.1.2. Apartment
- 8.1.3. Office Building
- 8.1.4. Others
- 8.2. Market Analysis, Insights and Forecast - by Type
- 8.2.1. Normal
- 8.2.2. Intelligent
- 8.1. Market Analysis, Insights and Forecast - by Application
- 9. Middle East & Africa Seismic Detectors Analysis, Insights and Forecast, 2020-2032
- 9.1. Market Analysis, Insights and Forecast - by Application
- 9.1.1. House
- 9.1.2. Apartment
- 9.1.3. Office Building
- 9.1.4. Others
- 9.2. Market Analysis, Insights and Forecast - by Type
- 9.2.1. Normal
- 9.2.2. Intelligent
- 9.1. Market Analysis, Insights and Forecast - by Application
- 10. Asia Pacific Seismic Detectors Analysis, Insights and Forecast, 2020-2032
- 10.1. Market Analysis, Insights and Forecast - by Application
- 10.1.1. House
- 10.1.2. Apartment
- 10.1.3. Office Building
- 10.1.4. Others
- 10.2. Market Analysis, Insights and Forecast - by Type
- 10.2.1. Normal
- 10.2.2. Intelligent
- 10.1. Market Analysis, Insights and Forecast - by Application
- 11. Competitive Analysis
- 11.1. Global Market Share Analysis 2025
- 11.2. Company Profiles
- 11.2.1 Guralp Systems
- 11.2.1.1. Overview
- 11.2.1.2. Products
- 11.2.1.3. SWOT Analysis
- 11.2.1.4. Recent Developments
- 11.2.1.5. Financials (Based on Availability)
- 11.2.2 Omron
- 11.2.2.1. Overview
- 11.2.2.2. Products
- 11.2.2.3. SWOT Analysis
- 11.2.2.4. Recent Developments
- 11.2.2.5. Financials (Based on Availability)
- 11.2.3 Azbil
- 11.2.3.1. Overview
- 11.2.3.2. Products
- 11.2.3.3. SWOT Analysis
- 11.2.3.4. Recent Developments
- 11.2.3.5. Financials (Based on Availability)
- 11.2.4 REF TEK (Trimble Navigation)
- 11.2.4.1. Overview
- 11.2.4.2. Products
- 11.2.4.3. SWOT Analysis
- 11.2.4.4. Recent Developments
- 11.2.4.5. Financials (Based on Availability)
- 11.2.5 GeoSIG
- 11.2.5.1. Overview
- 11.2.5.2. Products
- 11.2.5.3. SWOT Analysis
- 11.2.5.4. Recent Developments
- 11.2.5.5. Financials (Based on Availability)
- 11.2.6 Dai-ichi Seiko
- 11.2.6.1. Overview
- 11.2.6.2. Products
- 11.2.6.3. SWOT Analysis
- 11.2.6.4. Recent Developments
- 11.2.6.5. Financials (Based on Availability)
- 11.2.7 Jds Products
- 11.2.7.1. Overview
- 11.2.7.2. Products
- 11.2.7.3. SWOT Analysis
- 11.2.7.4. Recent Developments
- 11.2.7.5. Financials (Based on Availability)
- 11.2.8 Dynamic Technologies
- 11.2.8.1. Overview
- 11.2.8.2. Products
- 11.2.8.3. SWOT Analysis
- 11.2.8.4. Recent Developments
- 11.2.8.5. Financials (Based on Availability)
- 11.2.9 Ubukata Industries
- 11.2.9.1. Overview
- 11.2.9.2. Products
- 11.2.9.3. SWOT Analysis
- 11.2.9.4. Recent Developments
- 11.2.9.5. Financials (Based on Availability)
- 11.2.10 Colibrys
- 11.2.10.1. Overview
- 11.2.10.2. Products
- 11.2.10.3. SWOT Analysis
- 11.2.10.4. Recent Developments
- 11.2.10.5. Financials (Based on Availability)
- 11.2.11 DJB Instruments
- 11.2.11.1. Overview
- 11.2.11.2. Products
- 11.2.11.3. SWOT Analysis
- 11.2.11.4. Recent Developments
- 11.2.11.5. Financials (Based on Availability)
- 11.2.12 Dytran Instruments
- 11.2.12.1. Overview
- 11.2.12.2. Products
- 11.2.12.3. SWOT Analysis
- 11.2.12.4. Recent Developments
- 11.2.12.5. Financials (Based on Availability)
- 11.2.13 Tokyo Sokushin
- 11.2.13.1. Overview
- 11.2.13.2. Products
- 11.2.13.3. SWOT Analysis
- 11.2.13.4. Recent Developments
- 11.2.13.5. Financials (Based on Availability)
- 11.2.14 Sercel
- 11.2.14.1. Overview
- 11.2.14.2. Products
- 11.2.14.3. SWOT Analysis
- 11.2.14.4. Recent Developments
- 11.2.14.5. Financials (Based on Availability)
- 11.2.15 QMI Manufacturing
- 11.2.15.1. Overview
- 11.2.15.2. Products
- 11.2.15.3. SWOT Analysis
- 11.2.15.4. Recent Developments
- 11.2.15.5. Financials (Based on Availability)
- 11.2.16 Senba Denki Kazai
- 11.2.16.1. Overview
- 11.2.16.2. Products
- 11.2.16.3. SWOT Analysis
- 11.2.16.4. Recent Developments
- 11.2.16.5. Financials (Based on Availability)
- 11.2.1 Guralp Systems
List of Figures
- Figure 1: Global Seismic Detectors Revenue Breakdown (undefined, %) by Region 2025 & 2033
- Figure 2: Global Seismic Detectors Volume Breakdown (K, %) by Region 2025 & 2033
- Figure 3: North America Seismic Detectors Revenue (undefined), by Application 2025 & 2033
- Figure 4: North America Seismic Detectors Volume (K), by Application 2025 & 2033
- Figure 5: North America Seismic Detectors Revenue Share (%), by Application 2025 & 2033
- Figure 6: North America Seismic Detectors Volume Share (%), by Application 2025 & 2033
- Figure 7: North America Seismic Detectors Revenue (undefined), by Type 2025 & 2033
- Figure 8: North America Seismic Detectors Volume (K), by Type 2025 & 2033
- Figure 9: North America Seismic Detectors Revenue Share (%), by Type 2025 & 2033
- Figure 10: North America Seismic Detectors Volume Share (%), by Type 2025 & 2033
- Figure 11: North America Seismic Detectors Revenue (undefined), by Country 2025 & 2033
- Figure 12: North America Seismic Detectors Volume (K), by Country 2025 & 2033
- Figure 13: North America Seismic Detectors Revenue Share (%), by Country 2025 & 2033
- Figure 14: North America Seismic Detectors Volume Share (%), by Country 2025 & 2033
- Figure 15: South America Seismic Detectors Revenue (undefined), by Application 2025 & 2033
- Figure 16: South America Seismic Detectors Volume (K), by Application 2025 & 2033
- Figure 17: South America Seismic Detectors Revenue Share (%), by Application 2025 & 2033
- Figure 18: South America Seismic Detectors Volume Share (%), by Application 2025 & 2033
- Figure 19: South America Seismic Detectors Revenue (undefined), by Type 2025 & 2033
- Figure 20: South America Seismic Detectors Volume (K), by Type 2025 & 2033
- Figure 21: South America Seismic Detectors Revenue Share (%), by Type 2025 & 2033
- Figure 22: South America Seismic Detectors Volume Share (%), by Type 2025 & 2033
- Figure 23: South America Seismic Detectors Revenue (undefined), by Country 2025 & 2033
- Figure 24: South America Seismic Detectors Volume (K), by Country 2025 & 2033
- Figure 25: South America Seismic Detectors Revenue Share (%), by Country 2025 & 2033
- Figure 26: South America Seismic Detectors Volume Share (%), by Country 2025 & 2033
- Figure 27: Europe Seismic Detectors Revenue (undefined), by Application 2025 & 2033
- Figure 28: Europe Seismic Detectors Volume (K), by Application 2025 & 2033
- Figure 29: Europe Seismic Detectors Revenue Share (%), by Application 2025 & 2033
- Figure 30: Europe Seismic Detectors Volume Share (%), by Application 2025 & 2033
- Figure 31: Europe Seismic Detectors Revenue (undefined), by Type 2025 & 2033
- Figure 32: Europe Seismic Detectors Volume (K), by Type 2025 & 2033
- Figure 33: Europe Seismic Detectors Revenue Share (%), by Type 2025 & 2033
- Figure 34: Europe Seismic Detectors Volume Share (%), by Type 2025 & 2033
- Figure 35: Europe Seismic Detectors Revenue (undefined), by Country 2025 & 2033
- Figure 36: Europe Seismic Detectors Volume (K), by Country 2025 & 2033
- Figure 37: Europe Seismic Detectors Revenue Share (%), by Country 2025 & 2033
- Figure 38: Europe Seismic Detectors Volume Share (%), by Country 2025 & 2033
- Figure 39: Middle East & Africa Seismic Detectors Revenue (undefined), by Application 2025 & 2033
- Figure 40: Middle East & Africa Seismic Detectors Volume (K), by Application 2025 & 2033
- Figure 41: Middle East & Africa Seismic Detectors Revenue Share (%), by Application 2025 & 2033
- Figure 42: Middle East & Africa Seismic Detectors Volume Share (%), by Application 2025 & 2033
- Figure 43: Middle East & Africa Seismic Detectors Revenue (undefined), by Type 2025 & 2033
- Figure 44: Middle East & Africa Seismic Detectors Volume (K), by Type 2025 & 2033
- Figure 45: Middle East & Africa Seismic Detectors Revenue Share (%), by Type 2025 & 2033
- Figure 46: Middle East & Africa Seismic Detectors Volume Share (%), by Type 2025 & 2033
- Figure 47: Middle East & Africa Seismic Detectors Revenue (undefined), by Country 2025 & 2033
- Figure 48: Middle East & Africa Seismic Detectors Volume (K), by Country 2025 & 2033
- Figure 49: Middle East & Africa Seismic Detectors Revenue Share (%), by Country 2025 & 2033
- Figure 50: Middle East & Africa Seismic Detectors Volume Share (%), by Country 2025 & 2033
- Figure 51: Asia Pacific Seismic Detectors Revenue (undefined), by Application 2025 & 2033
- Figure 52: Asia Pacific Seismic Detectors Volume (K), by Application 2025 & 2033
- Figure 53: Asia Pacific Seismic Detectors Revenue Share (%), by Application 2025 & 2033
- Figure 54: Asia Pacific Seismic Detectors Volume Share (%), by Application 2025 & 2033
- Figure 55: Asia Pacific Seismic Detectors Revenue (undefined), by Type 2025 & 2033
- Figure 56: Asia Pacific Seismic Detectors Volume (K), by Type 2025 & 2033
- Figure 57: Asia Pacific Seismic Detectors Revenue Share (%), by Type 2025 & 2033
- Figure 58: Asia Pacific Seismic Detectors Volume Share (%), by Type 2025 & 2033
- Figure 59: Asia Pacific Seismic Detectors Revenue (undefined), by Country 2025 & 2033
- Figure 60: Asia Pacific Seismic Detectors Volume (K), by Country 2025 & 2033
- Figure 61: Asia Pacific Seismic Detectors Revenue Share (%), by Country 2025 & 2033
- Figure 62: Asia Pacific Seismic Detectors Volume Share (%), by Country 2025 & 2033
List of Tables
- Table 1: Global Seismic Detectors Revenue undefined Forecast, by Application 2020 & 2033
- Table 2: Global Seismic Detectors Volume K Forecast, by Application 2020 & 2033
- Table 3: Global Seismic Detectors Revenue undefined Forecast, by Type 2020 & 2033
- Table 4: Global Seismic Detectors Volume K Forecast, by Type 2020 & 2033
- Table 5: Global Seismic Detectors Revenue undefined Forecast, by Region 2020 & 2033
- Table 6: Global Seismic Detectors Volume K Forecast, by Region 2020 & 2033
- Table 7: Global Seismic Detectors Revenue undefined Forecast, by Application 2020 & 2033
- Table 8: Global Seismic Detectors Volume K Forecast, by Application 2020 & 2033
- Table 9: Global Seismic Detectors Revenue undefined Forecast, by Type 2020 & 2033
- Table 10: Global Seismic Detectors Volume K Forecast, by Type 2020 & 2033
- Table 11: Global Seismic Detectors Revenue undefined Forecast, by Country 2020 & 2033
- Table 12: Global Seismic Detectors Volume K Forecast, by Country 2020 & 2033
- Table 13: United States Seismic Detectors Revenue (undefined) Forecast, by Application 2020 & 2033
- Table 14: United States Seismic Detectors Volume (K) Forecast, by Application 2020 & 2033
- Table 15: Canada Seismic Detectors Revenue (undefined) Forecast, by Application 2020 & 2033
- Table 16: Canada Seismic Detectors Volume (K) Forecast, by Application 2020 & 2033
- Table 17: Mexico Seismic Detectors Revenue (undefined) Forecast, by Application 2020 & 2033
- Table 18: Mexico Seismic Detectors Volume (K) Forecast, by Application 2020 & 2033
- Table 19: Global Seismic Detectors Revenue undefined Forecast, by Application 2020 & 2033
- Table 20: Global Seismic Detectors Volume K Forecast, by Application 2020 & 2033
- Table 21: Global Seismic Detectors Revenue undefined Forecast, by Type 2020 & 2033
- Table 22: Global Seismic Detectors Volume K Forecast, by Type 2020 & 2033
- Table 23: Global Seismic Detectors Revenue undefined Forecast, by Country 2020 & 2033
- Table 24: Global Seismic Detectors Volume K Forecast, by Country 2020 & 2033
- Table 25: Brazil Seismic Detectors Revenue (undefined) Forecast, by Application 2020 & 2033
- Table 26: Brazil Seismic Detectors Volume (K) Forecast, by Application 2020 & 2033
- Table 27: Argentina Seismic Detectors Revenue (undefined) Forecast, by Application 2020 & 2033
- Table 28: Argentina Seismic Detectors Volume (K) Forecast, by Application 2020 & 2033
- Table 29: Rest of South America Seismic Detectors Revenue (undefined) Forecast, by Application 2020 & 2033
- Table 30: Rest of South America Seismic Detectors Volume (K) Forecast, by Application 2020 & 2033
- Table 31: Global Seismic Detectors Revenue undefined Forecast, by Application 2020 & 2033
- Table 32: Global Seismic Detectors Volume K Forecast, by Application 2020 & 2033
- Table 33: Global Seismic Detectors Revenue undefined Forecast, by Type 2020 & 2033
- Table 34: Global Seismic Detectors Volume K Forecast, by Type 2020 & 2033
- Table 35: Global Seismic Detectors Revenue undefined Forecast, by Country 2020 & 2033
- Table 36: Global Seismic Detectors Volume K Forecast, by Country 2020 & 2033
- Table 37: United Kingdom Seismic Detectors Revenue (undefined) Forecast, by Application 2020 & 2033
- Table 38: United Kingdom Seismic Detectors Volume (K) Forecast, by Application 2020 & 2033
- Table 39: Germany Seismic Detectors Revenue (undefined) Forecast, by Application 2020 & 2033
- Table 40: Germany Seismic Detectors Volume (K) Forecast, by Application 2020 & 2033
- Table 41: France Seismic Detectors Revenue (undefined) Forecast, by Application 2020 & 2033
- Table 42: France Seismic Detectors Volume (K) Forecast, by Application 2020 & 2033
- Table 43: Italy Seismic Detectors Revenue (undefined) Forecast, by Application 2020 & 2033
- Table 44: Italy Seismic Detectors Volume (K) Forecast, by Application 2020 & 2033
- Table 45: Spain Seismic Detectors Revenue (undefined) Forecast, by Application 2020 & 2033
- Table 46: Spain Seismic Detectors Volume (K) Forecast, by Application 2020 & 2033
- Table 47: Russia Seismic Detectors Revenue (undefined) Forecast, by Application 2020 & 2033
- Table 48: Russia Seismic Detectors Volume (K) Forecast, by Application 2020 & 2033
- Table 49: Benelux Seismic Detectors Revenue (undefined) Forecast, by Application 2020 & 2033
- Table 50: Benelux Seismic Detectors Volume (K) Forecast, by Application 2020 & 2033
- Table 51: Nordics Seismic Detectors Revenue (undefined) Forecast, by Application 2020 & 2033
- Table 52: Nordics Seismic Detectors Volume (K) Forecast, by Application 2020 & 2033
- Table 53: Rest of Europe Seismic Detectors Revenue (undefined) Forecast, by Application 2020 & 2033
- Table 54: Rest of Europe Seismic Detectors Volume (K) Forecast, by Application 2020 & 2033
- Table 55: Global Seismic Detectors Revenue undefined Forecast, by Application 2020 & 2033
- Table 56: Global Seismic Detectors Volume K Forecast, by Application 2020 & 2033
- Table 57: Global Seismic Detectors Revenue undefined Forecast, by Type 2020 & 2033
- Table 58: Global Seismic Detectors Volume K Forecast, by Type 2020 & 2033
- Table 59: Global Seismic Detectors Revenue undefined Forecast, by Country 2020 & 2033
- Table 60: Global Seismic Detectors Volume K Forecast, by Country 2020 & 2033
- Table 61: Turkey Seismic Detectors Revenue (undefined) Forecast, by Application 2020 & 2033
- Table 62: Turkey Seismic Detectors Volume (K) Forecast, by Application 2020 & 2033
- Table 63: Israel Seismic Detectors Revenue (undefined) Forecast, by Application 2020 & 2033
- Table 64: Israel Seismic Detectors Volume (K) Forecast, by Application 2020 & 2033
- Table 65: GCC Seismic Detectors Revenue (undefined) Forecast, by Application 2020 & 2033
- Table 66: GCC Seismic Detectors Volume (K) Forecast, by Application 2020 & 2033
- Table 67: North Africa Seismic Detectors Revenue (undefined) Forecast, by Application 2020 & 2033
- Table 68: North Africa Seismic Detectors Volume (K) Forecast, by Application 2020 & 2033
- Table 69: South Africa Seismic Detectors Revenue (undefined) Forecast, by Application 2020 & 2033
- Table 70: South Africa Seismic Detectors Volume (K) Forecast, by Application 2020 & 2033
- Table 71: Rest of Middle East & Africa Seismic Detectors Revenue (undefined) Forecast, by Application 2020 & 2033
- Table 72: Rest of Middle East & Africa Seismic Detectors Volume (K) Forecast, by Application 2020 & 2033
- Table 73: Global Seismic Detectors Revenue undefined Forecast, by Application 2020 & 2033
- Table 74: Global Seismic Detectors Volume K Forecast, by Application 2020 & 2033
- Table 75: Global Seismic Detectors Revenue undefined Forecast, by Type 2020 & 2033
- Table 76: Global Seismic Detectors Volume K Forecast, by Type 2020 & 2033
- Table 77: Global Seismic Detectors Revenue undefined Forecast, by Country 2020 & 2033
- Table 78: Global Seismic Detectors Volume K Forecast, by Country 2020 & 2033
- Table 79: China Seismic Detectors Revenue (undefined) Forecast, by Application 2020 & 2033
- Table 80: China Seismic Detectors Volume (K) Forecast, by Application 2020 & 2033
- Table 81: India Seismic Detectors Revenue (undefined) Forecast, by Application 2020 & 2033
- Table 82: India Seismic Detectors Volume (K) Forecast, by Application 2020 & 2033
- Table 83: Japan Seismic Detectors Revenue (undefined) Forecast, by Application 2020 & 2033
- Table 84: Japan Seismic Detectors Volume (K) Forecast, by Application 2020 & 2033
- Table 85: South Korea Seismic Detectors Revenue (undefined) Forecast, by Application 2020 & 2033
- Table 86: South Korea Seismic Detectors Volume (K) Forecast, by Application 2020 & 2033
- Table 87: ASEAN Seismic Detectors Revenue (undefined) Forecast, by Application 2020 & 2033
- Table 88: ASEAN Seismic Detectors Volume (K) Forecast, by Application 2020 & 2033
- Table 89: Oceania Seismic Detectors Revenue (undefined) Forecast, by Application 2020 & 2033
- Table 90: Oceania Seismic Detectors Volume (K) Forecast, by Application 2020 & 2033
- Table 91: Rest of Asia Pacific Seismic Detectors Revenue (undefined) Forecast, by Application 2020 & 2033
- Table 92: Rest of Asia Pacific Seismic Detectors Volume (K) Forecast, by Application 2020 & 2033
Frequently Asked Questions
1. What is the projected Compound Annual Growth Rate (CAGR) of the Seismic Detectors?
The projected CAGR is approximately 3.3%.
2. Which companies are prominent players in the Seismic Detectors?
Key companies in the market include Guralp Systems, Omron, Azbil, REF TEK (Trimble Navigation), GeoSIG, Dai-ichi Seiko, Jds Products, Dynamic Technologies, Ubukata Industries, Colibrys, DJB Instruments, Dytran Instruments, Tokyo Sokushin, Sercel, QMI Manufacturing, Senba Denki Kazai.
3. What are the main segments of the Seismic Detectors?
The market segments include Application, Type.
4. Can you provide details about the market size?
The market size is estimated to be USD XXX N/A as of 2022.
5. What are some drivers contributing to market growth?
N/A
6. What are the notable trends driving market growth?
N/A
7. Are there any restraints impacting market growth?
N/A
8. Can you provide examples of recent developments in the market?
N/A
9. What pricing options are available for accessing the report?
Pricing options include single-user, multi-user, and enterprise licenses priced at USD 3950.00, USD 5925.00, and USD 7900.00 respectively.
10. Is the market size provided in terms of value or volume?
The market size is provided in terms of value, measured in N/A and volume, measured in K.
11. Are there any specific market keywords associated with the report?
Yes, the market keyword associated with the report is "Seismic Detectors," which aids in identifying and referencing the specific market segment covered.
12. How do I determine which pricing option suits my needs best?
The pricing options vary based on user requirements and access needs. Individual users may opt for single-user licenses, while businesses requiring broader access may choose multi-user or enterprise licenses for cost-effective access to the report.
13. Are there any additional resources or data provided in the Seismic Detectors report?
While the report offers comprehensive insights, it's advisable to review the specific contents or supplementary materials provided to ascertain if additional resources or data are available.
14. How can I stay updated on further developments or reports in the Seismic Detectors?
To stay informed about further developments, trends, and reports in the Seismic Detectors, consider subscribing to industry newsletters, following relevant companies and organizations, or regularly checking reputable industry news sources and publications.
Methodology
Step 1 - Identification of Relevant Samples Size from Population Database


Step 2 - Approaches for Defining Global Market Size (Value, Volume* & Price*)

Note*: In applicable scenarios
Step 3 - Data Sources
Primary Research
- Web Analytics
- Survey Reports
- Research Institute
- Latest Research Reports
- Opinion Leaders
Secondary Research
- Annual Reports
- White Paper
- Latest Press Release
- Industry Association
- Paid Database
- Investor Presentations

Step 4 - Data Triangulation
Involves using different sources of information in order to increase the validity of a study
These sources are likely to be stakeholders in a program - participants, other researchers, program staff, other community members, and so on.
Then we put all data in single framework & apply various statistical tools to find out the dynamic on the market.
During the analysis stage, feedback from the stakeholder groups would be compared to determine areas of agreement as well as areas of divergence