

Key Insights
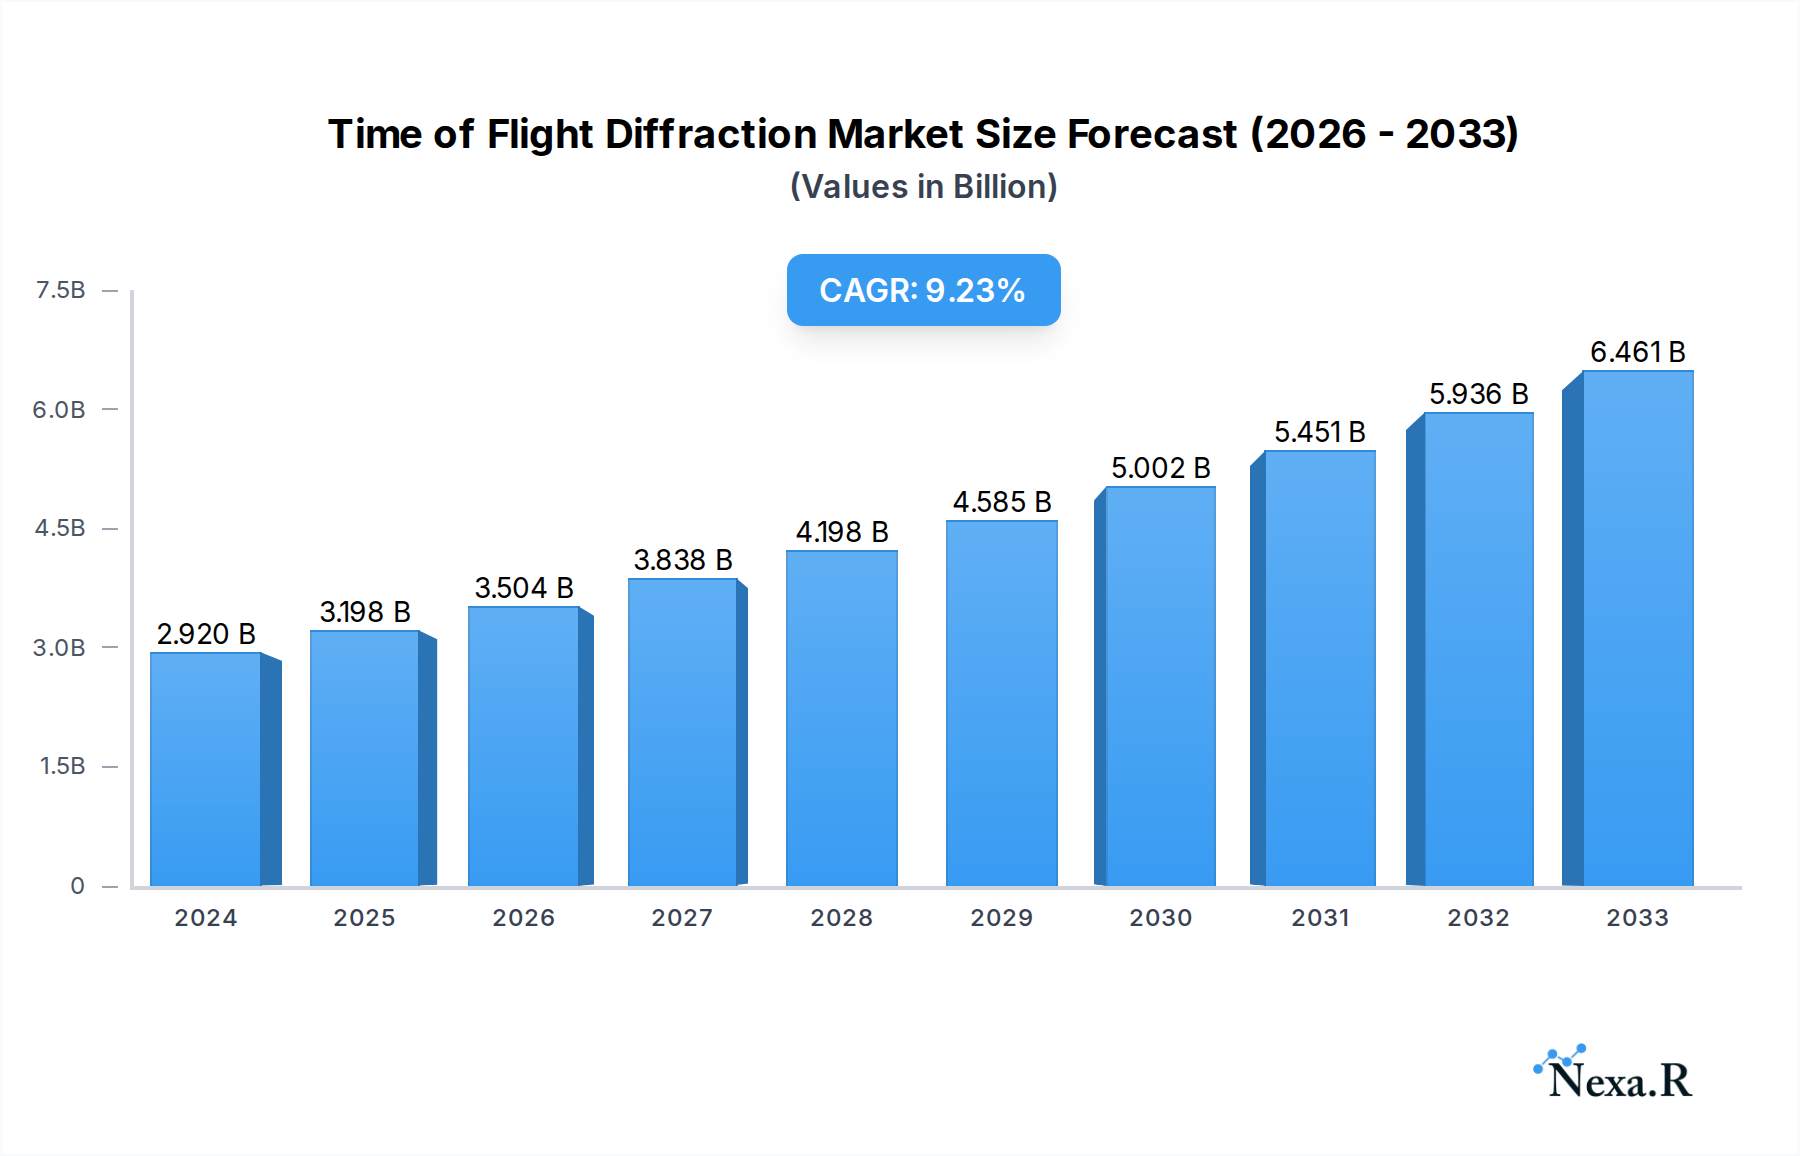
The global Time of Flight Diffraction (ToFD) market is experiencing robust expansion, projected to reach a valuation of approximately $2.92 billion by 2024. This growth is fueled by an increasing demand for advanced non-destructive testing (NDT) solutions across a multitude of critical industries. The Compound Annual Growth Rate (CAGR) of 9.5% from 2025 to 2033 signifies a dynamic and expanding market, driven by the inherent advantages of ToFD technology, including its precision in detecting sub-surface defects and its suitability for a wide range of materials. Key sectors like Automotive, Aerospace & Defense, and Oil & Gas are significant contributors, leveraging ToFD for stringent quality control and safety assurance. Furthermore, the growing emphasis on infrastructure development and maintenance, particularly in government projects, is a substantial driver. The increasing adoption of digitalization and smart manufacturing principles is also propelling the demand for sophisticated NDT techniques like ToFD.

Time of Flight Diffraction Market Size (In Billion)
The market's trajectory is further shaped by ongoing technological advancements within the hardware, software, and services segments of ToFD solutions. Innovations in sensor technology, data processing algorithms, and cloud-based analytics are enhancing the capabilities and accessibility of ToFD systems. While the market presents a promising outlook, potential restraints such as the initial capital investment for advanced equipment and the need for skilled personnel to operate and interpret results warrant consideration. However, the long-term benefits of improved safety, reduced downtime, and enhanced product integrity are expected to outweigh these challenges, ensuring sustained market growth. Leading companies like GE Measurement & Control Solutions, Olympus Corporation, and Mistras Group, Inc. are at the forefront of innovation, contributing to market expansion and the development of next-generation ToFD technologies.
Time of Flight Diffraction Company Market Share
This in-depth report delivers a meticulously researched analysis of the global Time of Flight Diffraction (ToFD) market, a critical Non-Destructive Testing (NDT) technology. Spanning from 2019 to 2033, with a base and estimated year of 2025, this report provides actionable insights for stakeholders across the Automotive, Aerospace & Defense, Oil & Gas, Construction Industry, Government Infrastructure, General Manufacturing, Marine, and Power Generation sectors. The analysis delves into the market's structure, growth trends, dominant regions, product landscape, key drivers, challenges, emerging opportunities, and future outlook, leveraging high-traffic keywords like "ultrasonic testing," "NDT solutions," "advanced materials inspection," and "predictive maintenance." We will also explore the parent market of Non-Destructive Testing and the child market of advanced ultrasonic testing techniques.
Time of Flight Diffraction Market Dynamics & Structure
The Time of Flight Diffraction (ToFD) market exhibits a moderately concentrated structure, with a few key players holding significant market share. Technological innovation remains a primary driver, fueled by the continuous demand for higher precision, faster inspection speeds, and improved defect characterization in critical industries. Regulatory frameworks, particularly those emphasizing safety and quality control in sectors like Aerospace & Defense and Oil & Gas, actively promote the adoption of advanced NDT methods like ToFD. Competitive product substitutes, primarily other ultrasonic testing techniques (e.g., Phased Array UT) and radiographic testing, present ongoing challenges, though ToFD's superior sizing and localization capabilities offer distinct advantages. End-user demographics are increasingly sophisticated, demanding integrated solutions that combine Hardware, Software, and Services for comprehensive data analysis and reporting. Merger and acquisition (M&A) trends are evident as larger NDT service providers consolidate their offerings and expand their technological portfolios. For instance, the Oil & Gas sector alone accounts for approximately 25% of the global ToFD market share, with M&A activity in this segment representing an estimated 2.5 billion USD in deal volumes over the historical period. Innovation barriers include the high cost of R&D for advanced algorithms and the need for specialized training for skilled operators.
- Market Concentration: Moderate, with key players like GE Measurement & Control Solutions and Olympus Corporation holding substantial market influence.
- Technological Innovation Drivers: Demand for enhanced defect sizing accuracy, real-time data acquisition, and integration with digital platforms.
- Regulatory Frameworks: Strict safety and quality standards in Aerospace & Defense and Oil & Gas mandate the use of advanced NDT.
- Competitive Product Substitutes: Phased Array UT, Eddy Current Testing, Radiographic Testing.
- End-User Demographics: Growing demand for integrated NDT solutions and data analytics.
- M&A Trends: Consolidation for expanded service offerings and market reach.
- Innovation Barriers: High R&D investment, need for skilled workforce development.
Time of Flight Diffraction Growth Trends & Insights
The global Time of Flight Diffraction market is poised for robust growth, projected to expand at a compound annual growth rate (CAGR) of approximately 6.8% during the forecast period of 2025–2033. This upward trajectory is intrinsically linked to the expanding parent market of Non-Destructive Testing, estimated to reach over $10 billion by 2025, with ToFD representing a significant and rapidly growing child market within advanced ultrasonic techniques. The base year of 2025 sees the ToFD market valued at an estimated $1.2 billion, with projections indicating a reach of over $2.1 billion by 2033. Adoption rates are steadily increasing across various industries, driven by the imperative for enhanced safety, quality assurance, and the prevention of costly failures. Technological disruptions, such as advancements in transducer technology, signal processing algorithms, and artificial intelligence for data interpretation, are further accelerating market penetration. Consumer behavior shifts are evident, with a growing preference for automated and portable ToFD systems that reduce inspection time and improve operator efficiency. The Aerospace & Defense sector, with its stringent quality demands and continuous innovation in materials, is a key contributor to these adoption rates, accounting for an estimated 20% of the ToFD market share in 2025. Similarly, the Oil & Gas industry's focus on asset integrity and predictive maintenance further fuels demand. The market penetration of ToFD, while already significant in mature economies, is expected to see substantial growth in emerging markets as industrialization and infrastructure development accelerate.
Dominant Regions, Countries, or Segments in Time of Flight Diffraction
North America currently dominates the Time of Flight Diffraction market, driven by its highly developed industrial base, particularly in the Aerospace & Defense, Oil & Gas, and Government Infrastructure sectors. The region's strong emphasis on safety regulations and the presence of leading NDT service providers like Mistras Group, Inc. and Amerapex Corporation contribute to its leading position. The United States, in particular, accounts for a substantial share of the regional market, estimated at over 60% in 2025. Key drivers in this region include significant government investment in infrastructure upgrades and the continuous need for asset integrity management in the extensive oil and gas pipeline network. The Aerospace & Defense segment within North America is a major growth engine, with an estimated market share of 25% of the total ToFD application market in 2025, driven by the manufacturing of advanced aircraft and defense systems that demand the highest levels of material inspection. The Hardware segment within the ToFD market is also robust in North America, with companies like Olympus Corporation and Sonatest Ltd. offering a wide range of advanced ultrasonic equipment.
Europe follows closely behind North America, with strong contributions from countries like Germany, the United Kingdom, and France. The region's advanced manufacturing capabilities, stringent environmental regulations, and a mature Oil & Gas sector are significant growth factors. The Construction Industry in Europe also presents a substantial opportunity for ToFD adoption, particularly in the inspection of critical infrastructure. The Services segment is particularly strong in Europe, with companies like Applus+ and SGS SA providing comprehensive NDT solutions.
Asia Pacific is emerging as the fastest-growing region, propelled by rapid industrialization, increasing foreign direct investment, and a burgeoning manufacturing sector in countries like China and India. The General Manufacturing and Power Generation segments are witnessing significant growth in ToFD adoption. The government's focus on improving infrastructure and the growing demand for advanced inspection techniques in emerging economies are key catalysts. The Oil & Gas sector in the Middle East, while geographically distinct, also contributes significantly to the global demand for ToFD solutions, with an estimated market share of 18% in 2025.
- Dominant Region: North America, driven by robust industrial sectors and stringent safety standards.
- Leading Country: United States, due to its advanced infrastructure and established NDT market.
- Key Application Segments: Aerospace & Defense, Oil & Gas, Government Infrastructure.
- Dominant Type Segment: Hardware, with a strong presence of advanced ultrasonic equipment manufacturers.
- Growth Drivers: Government investments, stringent safety regulations, industrial expansion.
- Market Share (Application): Aerospace & Defense (25%), Oil & Gas (25% - including Middle East), Construction Industry (15%), Government Infrastructure (12%), General Manufacturing (10%), Power Generation (8%), Marine (3%), Other (2%).
- Market Share (Type): Hardware (55%), Services (30%), Software (15%).
Time of Flight Diffraction Product Landscape
The Time of Flight Diffraction product landscape is characterized by continuous innovation focused on enhancing resolution, portability, and data processing capabilities. Leading manufacturers are developing integrated systems that combine advanced ultrasonic transducers with sophisticated software for real-time analysis and defect sizing. Notable product advancements include phased array probes for faster scanning and improved coverage, as well as the integration of Artificial Intelligence (AI) algorithms for automated defect recognition and characterization. These innovations are crucial for meeting the stringent inspection requirements in industries such as Aerospace & Defense, where the detection of minute flaws in critical components is paramount. Performance metrics such as improved probability of detection (POD) and reduced false call rates are key selling propositions, ensuring the reliability and efficiency of ToFD inspections. The market is also seeing a trend towards wireless connectivity and cloud-based data management, facilitating seamless integration with digital inspection workflows.
Key Drivers, Barriers & Challenges in Time of Flight Diffraction
Key Drivers:
- Increasing demand for enhanced safety and quality assurance: Industries like Aerospace & Defense and Oil & Gas face stringent regulatory requirements and the critical need to prevent catastrophic failures, driving the adoption of high-precision NDT methods.
- Technological advancements in ultrasonic probes and software: Continuous innovation in transducer technology and sophisticated algorithms improves defect detection and sizing accuracy.
- Growth in infrastructure development and maintenance: Investments in new construction and the upkeep of existing infrastructure, particularly in emerging economies, create significant demand for inspection services.
- Shift towards predictive maintenance: Industries are moving from reactive to proactive maintenance strategies, necessitating reliable asset integrity monitoring.
Barriers & Challenges:
- High initial cost of advanced ToFD equipment and training: The capital investment for sophisticated ToFD systems and the specialized skills required for operation can be a barrier for smaller organizations.
- Availability of skilled technicians: A shortage of highly trained and experienced NDT professionals can hinder widespread adoption and effective implementation.
- Competition from alternative NDT methods: While ToFD offers distinct advantages, other NDT techniques can be more cost-effective for certain applications, creating competitive pressure.
- Complexity of integration with existing systems: Integrating new ToFD solutions into legacy industrial systems can present technical challenges and require significant effort.
- Supply chain disruptions: Global supply chain issues can impact the availability and cost of specialized components for ToFD equipment.
Emerging Opportunities in Time of Flight Diffraction
Emerging opportunities in the Time of Flight Diffraction market lie in the expansion of its application in novel materials and advanced manufacturing processes. The increasing use of composites and additive manufactured parts in Aerospace & Defense and automotive industries presents a significant growth avenue for ToFD, which is adept at detecting subsurface defects in these complex materials. The development of miniaturized and portable ToFD systems is opening up possibilities for on-site inspections in remote locations and for smaller infrastructure projects. Furthermore, the integration of ToFD with drone technology and robotic inspection platforms is creating opportunities for automated and more efficient inspections of large structures, such as bridges and wind turbines. The growing focus on Industry 4.0 and smart factories also presents an opportunity for ToFD data to be seamlessly integrated into digital twins and predictive maintenance platforms, offering enhanced asset management and operational efficiency.
Growth Accelerators in the Time of Flight Diffraction Industry
Several key factors are acting as growth accelerators for the Time of Flight Diffraction industry. Technological breakthroughs in signal processing and data analytics are enabling faster and more accurate defect identification, making ToFD a more attractive solution. Strategic partnerships between equipment manufacturers, software developers, and NDT service providers are fostering the development of comprehensive and integrated solutions, thereby expanding market reach. Market expansion strategies focused on emerging economies, where industrialization and infrastructure development are rapidly increasing, are crucial for long-term growth. The growing emphasis on asset lifecycle management and the need to extend the operational life of critical infrastructure are also significant accelerators, driving demand for reliable inspection technologies like ToFD.
Key Players Shaping the Time of Flight Diffraction Market
- GE Measurement & Control Solutions
- Olympus Corporation
- Mistras Group, Inc.
- Amerapex Corporation
- Applied Technical Services Inc.
- Tecscan Systems Inc.
- NDT Systems Inc.
- Sonatest Ltd.
- Sonotron NDT
- Ashtead Technology Ltd.
- Applus+
- Intertek Group plc
- FORCE TECHNOLOGY
- RINA S.p.A.
- SGS SA
- TüV Rheinland
Notable Milestones in Time of Flight Diffraction Sector
- 2019: Launch of advanced phased array ToFD probes offering wider scan angles and improved defect resolution.
- 2020: Increased adoption of portable and wireless ToFD systems for field inspections.
- 2021: Integration of AI-powered software for automated defect analysis and reporting.
- 2022: Development of specialized ToFD solutions for composite materials in the aerospace industry.
- 2023: Growing trend towards cloud-based data management and remote monitoring of ToFD inspections.
- 2024: Significant investments in R&D for enhanced sizing accuracy and probability of detection.
In-Depth Time of Flight Diffraction Market Outlook
The future outlook for the Time of Flight Diffraction market is exceptionally promising, driven by a confluence of factors that position it as an indispensable technology for critical asset integrity management. Continued investment in research and development will undoubtedly lead to even more sophisticated and user-friendly ToFD systems, further solidifying its market position. The increasing global emphasis on safety, infrastructure resilience, and operational efficiency across key sectors like Oil & Gas, Aerospace & Defense, and Government Infrastructure will sustain and amplify demand. Emerging markets present vast untapped potential, and as these economies mature, the adoption of advanced NDT technologies like ToFD will accelerate exponentially. Strategic collaborations and the integration of ToFD data into broader digital transformation initiatives will unlock new avenues for growth and innovation, ensuring its continued relevance and expansion in the coming decade.
Time of Flight Diffraction Segmentation
-
1. Application
- 1.1. Automotive
- 1.2. Aerospace & Defense
- 1.3. Oil & Gas
- 1.4. Construction Industry
- 1.5. Government Infrastructure
- 1.6. General Manufacturing
- 1.7. Marine
- 1.8. Power Generation
- 1.9. Other
-
2. Types
- 2.1. Hardware
- 2.2. Software
- 2.3. Services
Time of Flight Diffraction Segmentation By Geography
-
1. North America
- 1.1. United States
- 1.2. Canada
- 1.3. Mexico
-
2. South America
- 2.1. Brazil
- 2.2. Argentina
- 2.3. Rest of South America
-
3. Europe
- 3.1. United Kingdom
- 3.2. Germany
- 3.3. France
- 3.4. Italy
- 3.5. Spain
- 3.6. Russia
- 3.7. Benelux
- 3.8. Nordics
- 3.9. Rest of Europe
-
4. Middle East & Africa
- 4.1. Turkey
- 4.2. Israel
- 4.3. GCC
- 4.4. North Africa
- 4.5. South Africa
- 4.6. Rest of Middle East & Africa
-
5. Asia Pacific
- 5.1. China
- 5.2. India
- 5.3. Japan
- 5.4. South Korea
- 5.5. ASEAN
- 5.6. Oceania
- 5.7. Rest of Asia Pacific
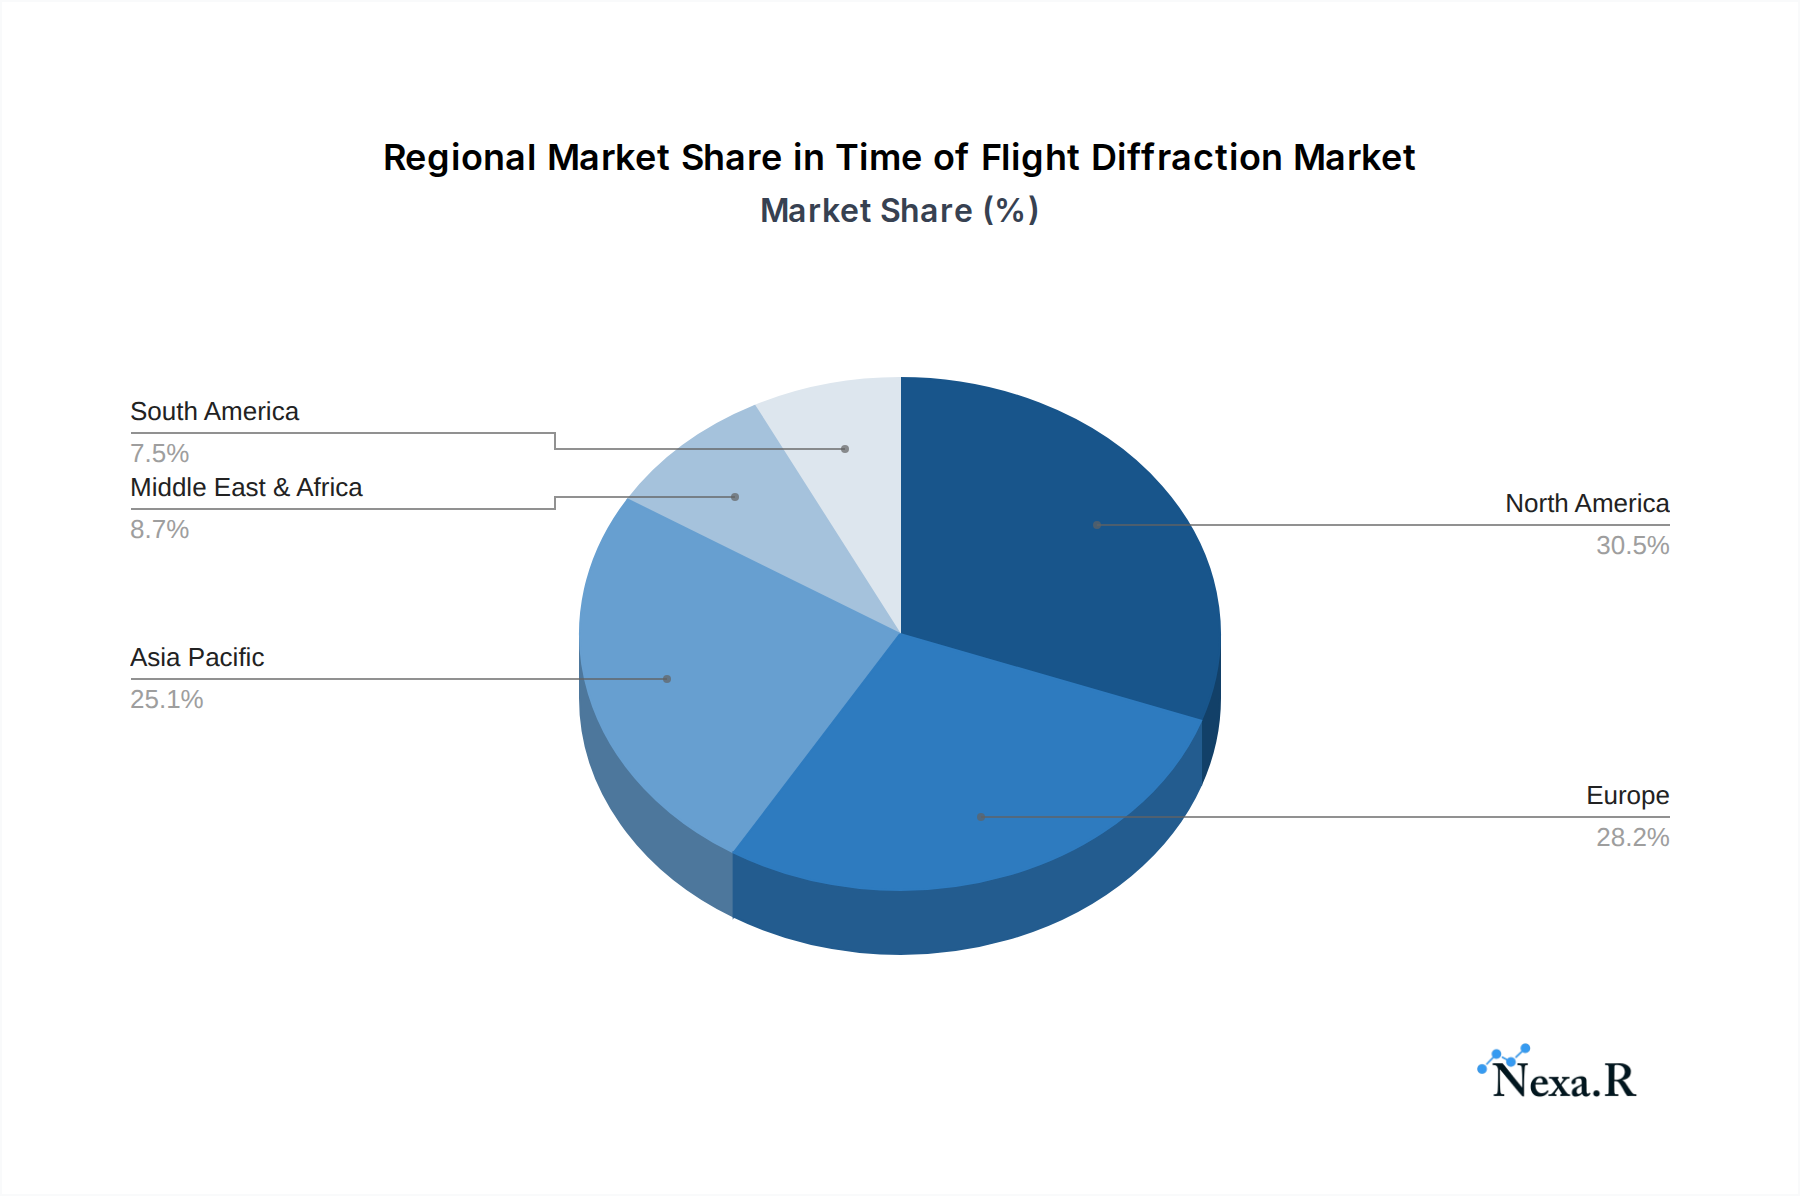
Time of Flight Diffraction Regional Market Share
Geographic Coverage of Time of Flight Diffraction
Time of Flight Diffraction REPORT HIGHLIGHTS
| Aspects | Details |
|---|---|
| Study Period | 2020-2034 |
| Base Year | 2025 |
| Estimated Year | 2026 |
| Forecast Period | 2026-2034 |
| Historical Period | 2020-2025 |
| Growth Rate | CAGR of 9.5% from 2020-2034 |
| Segmentation |
|
Table of Contents
- 1. Introduction
- 1.1. Research Scope
- 1.2. Market Segmentation
- 1.3. Research Methodology
- 1.4. Definitions and Assumptions
- 2. Executive Summary
- 2.1. Introduction
- 3. Market Dynamics
- 3.1. Introduction
- 3.2. Market Drivers
- 3.3. Market Restrains
- 3.4. Market Trends
- 4. Market Factor Analysis
- 4.1. Porters Five Forces
- 4.2. Supply/Value Chain
- 4.3. PESTEL analysis
- 4.4. Market Entropy
- 4.5. Patent/Trademark Analysis
- 5. Global Time of Flight Diffraction Analysis, Insights and Forecast, 2020-2032
- 5.1. Market Analysis, Insights and Forecast - by Application
- 5.1.1. Automotive
- 5.1.2. Aerospace & Defense
- 5.1.3. Oil & Gas
- 5.1.4. Construction Industry
- 5.1.5. Government Infrastructure
- 5.1.6. General Manufacturing
- 5.1.7. Marine
- 5.1.8. Power Generation
- 5.1.9. Other
- 5.2. Market Analysis, Insights and Forecast - by Types
- 5.2.1. Hardware
- 5.2.2. Software
- 5.2.3. Services
- 5.3. Market Analysis, Insights and Forecast - by Region
- 5.3.1. North America
- 5.3.2. South America
- 5.3.3. Europe
- 5.3.4. Middle East & Africa
- 5.3.5. Asia Pacific
- 5.1. Market Analysis, Insights and Forecast - by Application
- 6. North America Time of Flight Diffraction Analysis, Insights and Forecast, 2020-2032
- 6.1. Market Analysis, Insights and Forecast - by Application
- 6.1.1. Automotive
- 6.1.2. Aerospace & Defense
- 6.1.3. Oil & Gas
- 6.1.4. Construction Industry
- 6.1.5. Government Infrastructure
- 6.1.6. General Manufacturing
- 6.1.7. Marine
- 6.1.8. Power Generation
- 6.1.9. Other
- 6.2. Market Analysis, Insights and Forecast - by Types
- 6.2.1. Hardware
- 6.2.2. Software
- 6.2.3. Services
- 6.1. Market Analysis, Insights and Forecast - by Application
- 7. South America Time of Flight Diffraction Analysis, Insights and Forecast, 2020-2032
- 7.1. Market Analysis, Insights and Forecast - by Application
- 7.1.1. Automotive
- 7.1.2. Aerospace & Defense
- 7.1.3. Oil & Gas
- 7.1.4. Construction Industry
- 7.1.5. Government Infrastructure
- 7.1.6. General Manufacturing
- 7.1.7. Marine
- 7.1.8. Power Generation
- 7.1.9. Other
- 7.2. Market Analysis, Insights and Forecast - by Types
- 7.2.1. Hardware
- 7.2.2. Software
- 7.2.3. Services
- 7.1. Market Analysis, Insights and Forecast - by Application
- 8. Europe Time of Flight Diffraction Analysis, Insights and Forecast, 2020-2032
- 8.1. Market Analysis, Insights and Forecast - by Application
- 8.1.1. Automotive
- 8.1.2. Aerospace & Defense
- 8.1.3. Oil & Gas
- 8.1.4. Construction Industry
- 8.1.5. Government Infrastructure
- 8.1.6. General Manufacturing
- 8.1.7. Marine
- 8.1.8. Power Generation
- 8.1.9. Other
- 8.2. Market Analysis, Insights and Forecast - by Types
- 8.2.1. Hardware
- 8.2.2. Software
- 8.2.3. Services
- 8.1. Market Analysis, Insights and Forecast - by Application
- 9. Middle East & Africa Time of Flight Diffraction Analysis, Insights and Forecast, 2020-2032
- 9.1. Market Analysis, Insights and Forecast - by Application
- 9.1.1. Automotive
- 9.1.2. Aerospace & Defense
- 9.1.3. Oil & Gas
- 9.1.4. Construction Industry
- 9.1.5. Government Infrastructure
- 9.1.6. General Manufacturing
- 9.1.7. Marine
- 9.1.8. Power Generation
- 9.1.9. Other
- 9.2. Market Analysis, Insights and Forecast - by Types
- 9.2.1. Hardware
- 9.2.2. Software
- 9.2.3. Services
- 9.1. Market Analysis, Insights and Forecast - by Application
- 10. Asia Pacific Time of Flight Diffraction Analysis, Insights and Forecast, 2020-2032
- 10.1. Market Analysis, Insights and Forecast - by Application
- 10.1.1. Automotive
- 10.1.2. Aerospace & Defense
- 10.1.3. Oil & Gas
- 10.1.4. Construction Industry
- 10.1.5. Government Infrastructure
- 10.1.6. General Manufacturing
- 10.1.7. Marine
- 10.1.8. Power Generation
- 10.1.9. Other
- 10.2. Market Analysis, Insights and Forecast - by Types
- 10.2.1. Hardware
- 10.2.2. Software
- 10.2.3. Services
- 10.1. Market Analysis, Insights and Forecast - by Application
- 11. Competitive Analysis
- 11.1. Global Market Share Analysis 2025
- 11.2. Company Profiles
- 11.2.1 GE Measurement & Control Solutions
- 11.2.1.1. Overview
- 11.2.1.2. Products
- 11.2.1.3. SWOT Analysis
- 11.2.1.4. Recent Developments
- 11.2.1.5. Financials (Based on Availability)
- 11.2.2 Olympus Corporation
- 11.2.2.1. Overview
- 11.2.2.2. Products
- 11.2.2.3. SWOT Analysis
- 11.2.2.4. Recent Developments
- 11.2.2.5. Financials (Based on Availability)
- 11.2.3 Mistras Group
- 11.2.3.1. Overview
- 11.2.3.2. Products
- 11.2.3.3. SWOT Analysis
- 11.2.3.4. Recent Developments
- 11.2.3.5. Financials (Based on Availability)
- 11.2.4 Inc.
- 11.2.4.1. Overview
- 11.2.4.2. Products
- 11.2.4.3. SWOT Analysis
- 11.2.4.4. Recent Developments
- 11.2.4.5. Financials (Based on Availability)
- 11.2.5 Amerapex Corporation
- 11.2.5.1. Overview
- 11.2.5.2. Products
- 11.2.5.3. SWOT Analysis
- 11.2.5.4. Recent Developments
- 11.2.5.5. Financials (Based on Availability)
- 11.2.6 Applied Technical Services Inc.
- 11.2.6.1. Overview
- 11.2.6.2. Products
- 11.2.6.3. SWOT Analysis
- 11.2.6.4. Recent Developments
- 11.2.6.5. Financials (Based on Availability)
- 11.2.7 Tecscan Systems Inc.
- 11.2.7.1. Overview
- 11.2.7.2. Products
- 11.2.7.3. SWOT Analysis
- 11.2.7.4. Recent Developments
- 11.2.7.5. Financials (Based on Availability)
- 11.2.8 NDT Systems Inc.
- 11.2.8.1. Overview
- 11.2.8.2. Products
- 11.2.8.3. SWOT Analysis
- 11.2.8.4. Recent Developments
- 11.2.8.5. Financials (Based on Availability)
- 11.2.9 Sonatest Ltd.
- 11.2.9.1. Overview
- 11.2.9.2. Products
- 11.2.9.3. SWOT Analysis
- 11.2.9.4. Recent Developments
- 11.2.9.5. Financials (Based on Availability)
- 11.2.10 Sonotron NDT
- 11.2.10.1. Overview
- 11.2.10.2. Products
- 11.2.10.3. SWOT Analysis
- 11.2.10.4. Recent Developments
- 11.2.10.5. Financials (Based on Availability)
- 11.2.11 Ashtead Technology Ltd.
- 11.2.11.1. Overview
- 11.2.11.2. Products
- 11.2.11.3. SWOT Analysis
- 11.2.11.4. Recent Developments
- 11.2.11.5. Financials (Based on Availability)
- 11.2.12 Applus+
- 11.2.12.1. Overview
- 11.2.12.2. Products
- 11.2.12.3. SWOT Analysis
- 11.2.12.4. Recent Developments
- 11.2.12.5. Financials (Based on Availability)
- 11.2.13 Intertek Group plc
- 11.2.13.1. Overview
- 11.2.13.2. Products
- 11.2.13.3. SWOT Analysis
- 11.2.13.4. Recent Developments
- 11.2.13.5. Financials (Based on Availability)
- 11.2.14 FORCE TECHNOLOGY
- 11.2.14.1. Overview
- 11.2.14.2. Products
- 11.2.14.3. SWOT Analysis
- 11.2.14.4. Recent Developments
- 11.2.14.5. Financials (Based on Availability)
- 11.2.15 RINA S.p.A.
- 11.2.15.1. Overview
- 11.2.15.2. Products
- 11.2.15.3. SWOT Analysis
- 11.2.15.4. Recent Developments
- 11.2.15.5. Financials (Based on Availability)
- 11.2.16 SGS SA
- 11.2.16.1. Overview
- 11.2.16.2. Products
- 11.2.16.3. SWOT Analysis
- 11.2.16.4. Recent Developments
- 11.2.16.5. Financials (Based on Availability)
- 11.2.17 TüV Rheinland
- 11.2.17.1. Overview
- 11.2.17.2. Products
- 11.2.17.3. SWOT Analysis
- 11.2.17.4. Recent Developments
- 11.2.17.5. Financials (Based on Availability)
- 11.2.1 GE Measurement & Control Solutions
List of Figures
- Figure 1: Global Time of Flight Diffraction Revenue Breakdown (undefined, %) by Region 2025 & 2033
- Figure 2: North America Time of Flight Diffraction Revenue (undefined), by Application 2025 & 2033
- Figure 3: North America Time of Flight Diffraction Revenue Share (%), by Application 2025 & 2033
- Figure 4: North America Time of Flight Diffraction Revenue (undefined), by Types 2025 & 2033
- Figure 5: North America Time of Flight Diffraction Revenue Share (%), by Types 2025 & 2033
- Figure 6: North America Time of Flight Diffraction Revenue (undefined), by Country 2025 & 2033
- Figure 7: North America Time of Flight Diffraction Revenue Share (%), by Country 2025 & 2033
- Figure 8: South America Time of Flight Diffraction Revenue (undefined), by Application 2025 & 2033
- Figure 9: South America Time of Flight Diffraction Revenue Share (%), by Application 2025 & 2033
- Figure 10: South America Time of Flight Diffraction Revenue (undefined), by Types 2025 & 2033
- Figure 11: South America Time of Flight Diffraction Revenue Share (%), by Types 2025 & 2033
- Figure 12: South America Time of Flight Diffraction Revenue (undefined), by Country 2025 & 2033
- Figure 13: South America Time of Flight Diffraction Revenue Share (%), by Country 2025 & 2033
- Figure 14: Europe Time of Flight Diffraction Revenue (undefined), by Application 2025 & 2033
- Figure 15: Europe Time of Flight Diffraction Revenue Share (%), by Application 2025 & 2033
- Figure 16: Europe Time of Flight Diffraction Revenue (undefined), by Types 2025 & 2033
- Figure 17: Europe Time of Flight Diffraction Revenue Share (%), by Types 2025 & 2033
- Figure 18: Europe Time of Flight Diffraction Revenue (undefined), by Country 2025 & 2033
- Figure 19: Europe Time of Flight Diffraction Revenue Share (%), by Country 2025 & 2033
- Figure 20: Middle East & Africa Time of Flight Diffraction Revenue (undefined), by Application 2025 & 2033
- Figure 21: Middle East & Africa Time of Flight Diffraction Revenue Share (%), by Application 2025 & 2033
- Figure 22: Middle East & Africa Time of Flight Diffraction Revenue (undefined), by Types 2025 & 2033
- Figure 23: Middle East & Africa Time of Flight Diffraction Revenue Share (%), by Types 2025 & 2033
- Figure 24: Middle East & Africa Time of Flight Diffraction Revenue (undefined), by Country 2025 & 2033
- Figure 25: Middle East & Africa Time of Flight Diffraction Revenue Share (%), by Country 2025 & 2033
- Figure 26: Asia Pacific Time of Flight Diffraction Revenue (undefined), by Application 2025 & 2033
- Figure 27: Asia Pacific Time of Flight Diffraction Revenue Share (%), by Application 2025 & 2033
- Figure 28: Asia Pacific Time of Flight Diffraction Revenue (undefined), by Types 2025 & 2033
- Figure 29: Asia Pacific Time of Flight Diffraction Revenue Share (%), by Types 2025 & 2033
- Figure 30: Asia Pacific Time of Flight Diffraction Revenue (undefined), by Country 2025 & 2033
- Figure 31: Asia Pacific Time of Flight Diffraction Revenue Share (%), by Country 2025 & 2033
List of Tables
- Table 1: Global Time of Flight Diffraction Revenue undefined Forecast, by Application 2020 & 2033
- Table 2: Global Time of Flight Diffraction Revenue undefined Forecast, by Types 2020 & 2033
- Table 3: Global Time of Flight Diffraction Revenue undefined Forecast, by Region 2020 & 2033
- Table 4: Global Time of Flight Diffraction Revenue undefined Forecast, by Application 2020 & 2033
- Table 5: Global Time of Flight Diffraction Revenue undefined Forecast, by Types 2020 & 2033
- Table 6: Global Time of Flight Diffraction Revenue undefined Forecast, by Country 2020 & 2033
- Table 7: United States Time of Flight Diffraction Revenue (undefined) Forecast, by Application 2020 & 2033
- Table 8: Canada Time of Flight Diffraction Revenue (undefined) Forecast, by Application 2020 & 2033
- Table 9: Mexico Time of Flight Diffraction Revenue (undefined) Forecast, by Application 2020 & 2033
- Table 10: Global Time of Flight Diffraction Revenue undefined Forecast, by Application 2020 & 2033
- Table 11: Global Time of Flight Diffraction Revenue undefined Forecast, by Types 2020 & 2033
- Table 12: Global Time of Flight Diffraction Revenue undefined Forecast, by Country 2020 & 2033
- Table 13: Brazil Time of Flight Diffraction Revenue (undefined) Forecast, by Application 2020 & 2033
- Table 14: Argentina Time of Flight Diffraction Revenue (undefined) Forecast, by Application 2020 & 2033
- Table 15: Rest of South America Time of Flight Diffraction Revenue (undefined) Forecast, by Application 2020 & 2033
- Table 16: Global Time of Flight Diffraction Revenue undefined Forecast, by Application 2020 & 2033
- Table 17: Global Time of Flight Diffraction Revenue undefined Forecast, by Types 2020 & 2033
- Table 18: Global Time of Flight Diffraction Revenue undefined Forecast, by Country 2020 & 2033
- Table 19: United Kingdom Time of Flight Diffraction Revenue (undefined) Forecast, by Application 2020 & 2033
- Table 20: Germany Time of Flight Diffraction Revenue (undefined) Forecast, by Application 2020 & 2033
- Table 21: France Time of Flight Diffraction Revenue (undefined) Forecast, by Application 2020 & 2033
- Table 22: Italy Time of Flight Diffraction Revenue (undefined) Forecast, by Application 2020 & 2033
- Table 23: Spain Time of Flight Diffraction Revenue (undefined) Forecast, by Application 2020 & 2033
- Table 24: Russia Time of Flight Diffraction Revenue (undefined) Forecast, by Application 2020 & 2033
- Table 25: Benelux Time of Flight Diffraction Revenue (undefined) Forecast, by Application 2020 & 2033
- Table 26: Nordics Time of Flight Diffraction Revenue (undefined) Forecast, by Application 2020 & 2033
- Table 27: Rest of Europe Time of Flight Diffraction Revenue (undefined) Forecast, by Application 2020 & 2033
- Table 28: Global Time of Flight Diffraction Revenue undefined Forecast, by Application 2020 & 2033
- Table 29: Global Time of Flight Diffraction Revenue undefined Forecast, by Types 2020 & 2033
- Table 30: Global Time of Flight Diffraction Revenue undefined Forecast, by Country 2020 & 2033
- Table 31: Turkey Time of Flight Diffraction Revenue (undefined) Forecast, by Application 2020 & 2033
- Table 32: Israel Time of Flight Diffraction Revenue (undefined) Forecast, by Application 2020 & 2033
- Table 33: GCC Time of Flight Diffraction Revenue (undefined) Forecast, by Application 2020 & 2033
- Table 34: North Africa Time of Flight Diffraction Revenue (undefined) Forecast, by Application 2020 & 2033
- Table 35: South Africa Time of Flight Diffraction Revenue (undefined) Forecast, by Application 2020 & 2033
- Table 36: Rest of Middle East & Africa Time of Flight Diffraction Revenue (undefined) Forecast, by Application 2020 & 2033
- Table 37: Global Time of Flight Diffraction Revenue undefined Forecast, by Application 2020 & 2033
- Table 38: Global Time of Flight Diffraction Revenue undefined Forecast, by Types 2020 & 2033
- Table 39: Global Time of Flight Diffraction Revenue undefined Forecast, by Country 2020 & 2033
- Table 40: China Time of Flight Diffraction Revenue (undefined) Forecast, by Application 2020 & 2033
- Table 41: India Time of Flight Diffraction Revenue (undefined) Forecast, by Application 2020 & 2033
- Table 42: Japan Time of Flight Diffraction Revenue (undefined) Forecast, by Application 2020 & 2033
- Table 43: South Korea Time of Flight Diffraction Revenue (undefined) Forecast, by Application 2020 & 2033
- Table 44: ASEAN Time of Flight Diffraction Revenue (undefined) Forecast, by Application 2020 & 2033
- Table 45: Oceania Time of Flight Diffraction Revenue (undefined) Forecast, by Application 2020 & 2033
- Table 46: Rest of Asia Pacific Time of Flight Diffraction Revenue (undefined) Forecast, by Application 2020 & 2033
Frequently Asked Questions
1. What is the projected Compound Annual Growth Rate (CAGR) of the Time of Flight Diffraction?
The projected CAGR is approximately 9.5%.
2. Which companies are prominent players in the Time of Flight Diffraction?
Key companies in the market include GE Measurement & Control Solutions, Olympus Corporation, Mistras Group, Inc., Amerapex Corporation, Applied Technical Services Inc., Tecscan Systems Inc., NDT Systems Inc., Sonatest Ltd., Sonotron NDT, Ashtead Technology Ltd., Applus+, Intertek Group plc, FORCE TECHNOLOGY, RINA S.p.A., SGS SA, TüV Rheinland.
3. What are the main segments of the Time of Flight Diffraction?
The market segments include Application, Types.
4. Can you provide details about the market size?
The market size is estimated to be USD XXX N/A as of 2022.
5. What are some drivers contributing to market growth?
N/A
6. What are the notable trends driving market growth?
N/A
7. Are there any restraints impacting market growth?
N/A
8. Can you provide examples of recent developments in the market?
N/A
9. What pricing options are available for accessing the report?
Pricing options include single-user, multi-user, and enterprise licenses priced at USD 3350.00, USD 5025.00, and USD 6700.00 respectively.
10. Is the market size provided in terms of value or volume?
The market size is provided in terms of value, measured in N/A.
11. Are there any specific market keywords associated with the report?
Yes, the market keyword associated with the report is "Time of Flight Diffraction," which aids in identifying and referencing the specific market segment covered.
12. How do I determine which pricing option suits my needs best?
The pricing options vary based on user requirements and access needs. Individual users may opt for single-user licenses, while businesses requiring broader access may choose multi-user or enterprise licenses for cost-effective access to the report.
13. Are there any additional resources or data provided in the Time of Flight Diffraction report?
While the report offers comprehensive insights, it's advisable to review the specific contents or supplementary materials provided to ascertain if additional resources or data are available.
14. How can I stay updated on further developments or reports in the Time of Flight Diffraction?
To stay informed about further developments, trends, and reports in the Time of Flight Diffraction, consider subscribing to industry newsletters, following relevant companies and organizations, or regularly checking reputable industry news sources and publications.
Methodology
Step 1 - Identification of Relevant Samples Size from Population Database


Step 2 - Approaches for Defining Global Market Size (Value, Volume* & Price*)

Note*: In applicable scenarios
Step 3 - Data Sources
Primary Research
- Web Analytics
- Survey Reports
- Research Institute
- Latest Research Reports
- Opinion Leaders
Secondary Research
- Annual Reports
- White Paper
- Latest Press Release
- Industry Association
- Paid Database
- Investor Presentations

Step 4 - Data Triangulation
Involves using different sources of information in order to increase the validity of a study
These sources are likely to be stakeholders in a program - participants, other researchers, program staff, other community members, and so on.
Then we put all data in single framework & apply various statistical tools to find out the dynamic on the market.
During the analysis stage, feedback from the stakeholder groups would be compared to determine areas of agreement as well as areas of divergence