

Key Insights
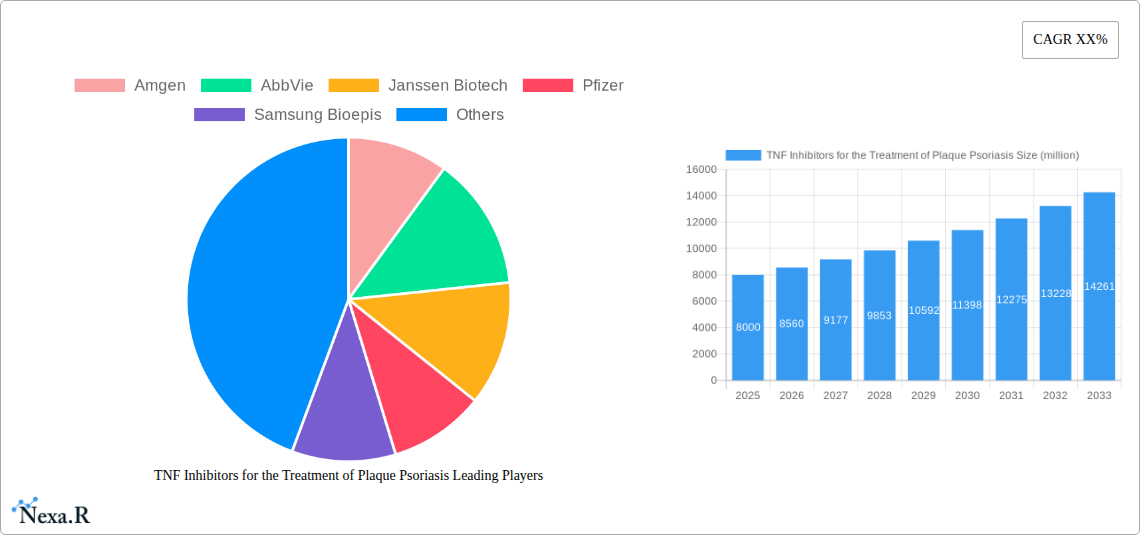
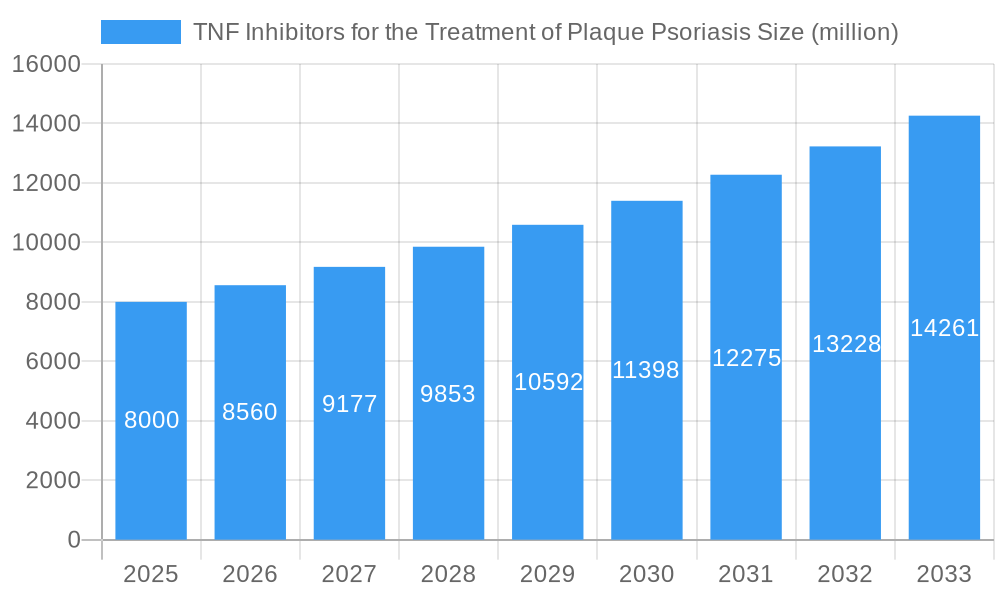
The global market for TNF inhibitors in the treatment of plaque psoriasis is experiencing robust growth, driven by increasing prevalence of the disease, a rising geriatric population, and the efficacy of these biologics in achieving disease remission. The market, estimated at $8 billion in 2025, is projected to exhibit a Compound Annual Growth Rate (CAGR) of approximately 7% from 2025 to 2033, reaching a value exceeding $13 billion by the end of the forecast period. Several factors contribute to this growth trajectory. Firstly, improved diagnosis and awareness of plaque psoriasis are leading to earlier and more frequent treatment initiation. Secondly, the development of biosimilar TNF inhibitors is increasing competition, potentially driving down prices and expanding access to these therapies for a wider patient population. However, the market faces some restraints, including the potential for adverse events associated with TNF inhibitors, the emergence of novel treatment modalities (e.g., JAK inhibitors, IL-17 inhibitors), and variations in healthcare reimbursement policies across different regions. Key players in the market, such as Amgen, AbbVie, Janssen Biotech, and Pfizer, are actively engaged in research and development to enhance their product portfolios and maintain a competitive edge. Furthermore, the rise of biosimilar manufacturers like Samsung Bioepis and Celltrion presents both opportunities and challenges for the established players.
TNF Inhibitors for the Treatment of Plaque Psoriasis Market Size (In Billion)
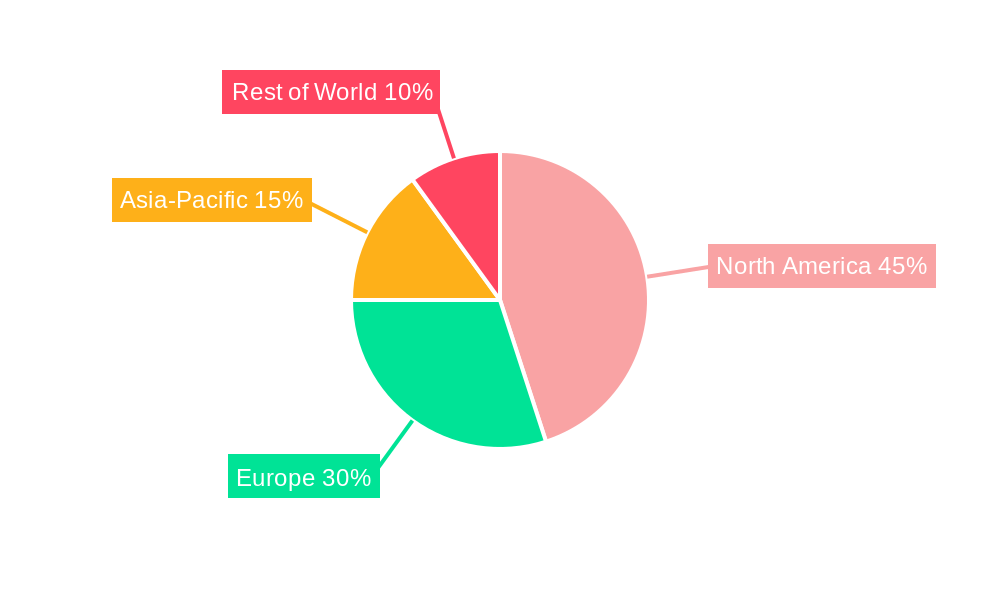
The segmentation of the market reflects different administration routes (e.g., subcutaneous injection, intravenous infusion) and specific TNF inhibitor brands. Geographical analysis reveals substantial variations in market size and growth rates across different regions, primarily due to differences in healthcare infrastructure, affordability of medications, and prevalence of plaque psoriasis. North America and Europe currently dominate the market, but emerging economies in Asia-Pacific are expected to demonstrate significant growth potential in the coming years, driven by factors such as increasing healthcare spending and growing awareness of treatment options. Strategic partnerships, mergers and acquisitions, and the continuous development of innovative products and delivery systems will likely shape the competitive landscape over the forecast period. The overall outlook remains positive, with TNF inhibitors anticipated to retain a significant role in the management of plaque psoriasis for the foreseeable future.
TNF Inhibitors for the Treatment of Plaque Psoriasis Company Market Share
TNF Inhibitors for the Treatment of Plaque Psoriasis: A Comprehensive Market Report (2019-2033)
This comprehensive report provides a detailed analysis of the TNF Inhibitors for the Treatment of Plaque Psoriasis market, encompassing market dynamics, growth trends, regional dominance, product landscape, key players, and future outlook. The report covers the parent market of biologic drugs for psoriasis and the child market of TNF inhibitor therapy for plaque psoriasis. The study period spans 2019-2033, with 2025 as the base and estimated year. The forecast period is 2025-2033, and the historical period is 2019-2024. Market values are presented in million units.
TNF Inhibitors for the Treatment of Plaque Psoriasis Market Dynamics & Structure
This section analyzes the market structure, focusing on concentration, innovation, regulation, competition, end-users, and M&A activity. The global market for TNF inhibitors in plaque psoriasis treatment exhibits a moderately concentrated structure, with a few major players holding significant market share. Technological innovation, driven by the need for improved efficacy and reduced side effects, is a key driver. Regulatory approvals and reimbursement policies significantly impact market access. The market faces competition from alternative therapies such as IL-17 inhibitors and Janus kinase (JAK) inhibitors. The aging population and increasing prevalence of psoriasis are key demographic drivers. M&A activity has been moderate, with strategic acquisitions aiming to expand product portfolios and market reach.
- Market Concentration: Top 5 players hold approximately xx% market share in 2025.
- Technological Innovation: Focus on biosimilar development and improved delivery systems.
- Regulatory Framework: Stringent regulatory approvals influence market entry and pricing.
- Competitive Substitutes: Growth of IL-17 and JAK inhibitors creates competitive pressure.
- End-User Demographics: Aging population and rising psoriasis prevalence fuel market growth.
- M&A Trends: xx M&A deals in the last 5 years, focusing on biosimilar acquisitions.
TNF Inhibitors for the Treatment of Plaque Psoriasis Growth Trends & Insights
This section analyzes market size evolution, adoption rates, technological disruptions, and consumer behavior shifts. Utilizing advanced analytical techniques, the report reveals a steady growth trajectory for the TNF inhibitor market in plaque psoriasis treatment. The market is expected to grow at a CAGR of xx% during the forecast period (2025-2033), driven by factors such as increasing prevalence of psoriasis, rising healthcare expenditure, and growing awareness among patients. Adoption rates are influenced by factors such as efficacy, safety profile, and treatment costs. Technological advancements, such as the development of biosimilars, are expected to further drive market growth. Changes in consumer behavior, such as increased preference for convenient and effective treatments, also influence market dynamics. Market penetration is projected to reach xx% by 2033.
Dominant Regions, Countries, or Segments in TNF Inhibitors for the Treatment of Plaque Psoriasis
This section identifies leading regions and segments driving market growth. North America currently dominates the market, followed by Europe and Asia-Pacific. The dominance of North America is attributed to high healthcare expenditure, well-established healthcare infrastructure, and a large patient population. Europe is experiencing steady growth, driven by increasing prevalence of psoriasis and favorable reimbursement policies. The Asia-Pacific region is expected to witness significant growth in the coming years, driven by rising healthcare expenditure, improving healthcare infrastructure, and increasing awareness about psoriasis.
- North America: High healthcare spending and established healthcare infrastructure drive market dominance.
- Europe: Increasing prevalence of psoriasis and favorable reimbursement policies fuel growth.
- Asia-Pacific: Rapid economic growth and rising healthcare expenditure contribute to significant growth potential.
TNF Inhibitors for the Treatment of Plaque Psoriasis Product Landscape
The TNF inhibitor landscape includes both originator biologics and biosimilars. Originator biologics, while offering established efficacy, face increasing competition from biosimilars entering the market. These biosimilars provide cost-effective alternatives without compromising efficacy, driving market expansion and increasing access to treatment. Technological advancements focus on improving delivery methods and reducing side effects. Unique selling propositions focus on superior efficacy, safety profiles, and improved convenience.
Key Drivers, Barriers & Challenges in TNF Inhibitors for the Treatment of Plaque Psoriasis
Key Drivers: Increasing prevalence of plaque psoriasis, rising healthcare expenditure, and the launch of biosimilars are major drivers. Favorable regulatory approvals and rising patient awareness further contribute to market growth.
Key Challenges: High treatment costs, potential for adverse effects, and the emergence of competing therapies (e.g., IL-17 inhibitors, JAK inhibitors) present challenges. Supply chain disruptions and stringent regulatory requirements also impact market growth. Biosimilar competition could impact the pricing and market share of originator biologics.
Emerging Opportunities in TNF Inhibitors for the Treatment of Plaque Psoriasis
Emerging opportunities lie in the development of novel delivery systems (e.g., subcutaneous injections), personalized medicine approaches, and expanding market penetration in emerging economies. Untapped markets in developing countries represent substantial growth potential. Innovative applications, like combination therapies, could further improve treatment outcomes. Evolving patient preferences for convenient and effective therapies offer new avenues for innovation.
Growth Accelerators in the TNF Inhibitors for the Treatment of Plaque Psoriasis Industry
Technological advancements, strategic partnerships, and expansion into new geographical markets are key growth catalysts. The development of next-generation TNF inhibitors with improved safety profiles will propel market growth. Collaborative efforts between pharmaceutical companies and research institutions will foster innovation. Penetration into underserved markets will unlock significant growth potential.
Key Players Shaping the TNF Inhibitors for the Treatment of Plaque Psoriasis Market
- Amgen
- AbbVie
- Janssen Biotech
- Pfizer
- Samsung Bioepis
- UCB
- Sandoz
- Boehringer Ingelheim Pharmaceuticals
- Biocon Biologics
- Coherus BioSciences
- YL Biologics
- Celltrion
- Teva
- Innovent Biologics
- Bio-Thera Solutions
- Sino Cell Technologies
- Hangzhou Bozhirui Biopharmaceuticals
- Chia Tai Tianqing Pharmaceutical
- Hisun Pharmaceuticals
Notable Milestones in TNF Inhibitors for the Treatment of Plaque Psoriasis Sector
- 2020: Launch of a new biosimilar TNF inhibitor by [Company Name].
- 2021: Approval of a novel TNF inhibitor formulation with improved delivery system by [Company Name].
- 2022: Acquisition of a small biotechnology company specializing in TNF inhibitor research by [Company Name].
- 2023: Publication of key clinical trial data demonstrating improved efficacy of a novel TNF inhibitor. (Further milestones can be added here as needed).
In-Depth TNF Inhibitors for the Treatment of Plaque Psoriasis Market Outlook
The TNF inhibitor market for plaque psoriasis is poised for continued growth, driven by persistent unmet medical needs and technological advancements. Opportunities lie in expanding access to treatment in emerging economies and developing next-generation therapies with enhanced efficacy and safety. Strategic partnerships and collaborations will be crucial in accelerating innovation and driving market expansion. The long-term outlook remains positive, with potential for significant market expansion driven by continued innovation and rising healthcare expenditure globally.
TNF Inhibitors for the Treatment of Plaque Psoriasis Segmentation
-
1. Application
- 1.1. Hospital and Clinic
- 1.2. Retail Pharmacies
- 1.3. Other
-
2. Types
- 2.1. Etanercept
- 2.2. Infliximab
- 2.3. Adalimumab
- 2.4. Certolizumab pegol
- 2.5. Other
TNF Inhibitors for the Treatment of Plaque Psoriasis Segmentation By Geography
-
1. North America
- 1.1. United States
- 1.2. Canada
- 1.3. Mexico
-
2. South America
- 2.1. Brazil
- 2.2. Argentina
- 2.3. Rest of South America
-
3. Europe
- 3.1. United Kingdom
- 3.2. Germany
- 3.3. France
- 3.4. Italy
- 3.5. Spain
- 3.6. Russia
- 3.7. Benelux
- 3.8. Nordics
- 3.9. Rest of Europe
-
4. Middle East & Africa
- 4.1. Turkey
- 4.2. Israel
- 4.3. GCC
- 4.4. North Africa
- 4.5. South Africa
- 4.6. Rest of Middle East & Africa
-
5. Asia Pacific
- 5.1. China
- 5.2. India
- 5.3. Japan
- 5.4. South Korea
- 5.5. ASEAN
- 5.6. Oceania
- 5.7. Rest of Asia Pacific
TNF Inhibitors for the Treatment of Plaque Psoriasis Regional Market Share
Geographic Coverage of TNF Inhibitors for the Treatment of Plaque Psoriasis
TNF Inhibitors for the Treatment of Plaque Psoriasis REPORT HIGHLIGHTS
| Aspects | Details |
|---|---|
| Study Period | 2020-2034 |
| Base Year | 2025 |
| Estimated Year | 2026 |
| Forecast Period | 2026-2034 |
| Historical Period | 2020-2025 |
| Growth Rate | CAGR of 10.9% from 2020-2034 |
| Segmentation |
|
Table of Contents
- 1. Introduction
- 1.1. Research Scope
- 1.2. Market Segmentation
- 1.3. Research Methodology
- 1.4. Definitions and Assumptions
- 2. Executive Summary
- 2.1. Introduction
- 3. Market Dynamics
- 3.1. Introduction
- 3.2. Market Drivers
- 3.3. Market Restrains
- 3.4. Market Trends
- 4. Market Factor Analysis
- 4.1. Porters Five Forces
- 4.2. Supply/Value Chain
- 4.3. PESTEL analysis
- 4.4. Market Entropy
- 4.5. Patent/Trademark Analysis
- 5. Global TNF Inhibitors for the Treatment of Plaque Psoriasis Analysis, Insights and Forecast, 2020-2032
- 5.1. Market Analysis, Insights and Forecast - by Application
- 5.1.1. Hospital and Clinic
- 5.1.2. Retail Pharmacies
- 5.1.3. Other
- 5.2. Market Analysis, Insights and Forecast - by Types
- 5.2.1. Etanercept
- 5.2.2. Infliximab
- 5.2.3. Adalimumab
- 5.2.4. Certolizumab pegol
- 5.2.5. Other
- 5.3. Market Analysis, Insights and Forecast - by Region
- 5.3.1. North America
- 5.3.2. South America
- 5.3.3. Europe
- 5.3.4. Middle East & Africa
- 5.3.5. Asia Pacific
- 5.1. Market Analysis, Insights and Forecast - by Application
- 6. North America TNF Inhibitors for the Treatment of Plaque Psoriasis Analysis, Insights and Forecast, 2020-2032
- 6.1. Market Analysis, Insights and Forecast - by Application
- 6.1.1. Hospital and Clinic
- 6.1.2. Retail Pharmacies
- 6.1.3. Other
- 6.2. Market Analysis, Insights and Forecast - by Types
- 6.2.1. Etanercept
- 6.2.2. Infliximab
- 6.2.3. Adalimumab
- 6.2.4. Certolizumab pegol
- 6.2.5. Other
- 6.1. Market Analysis, Insights and Forecast - by Application
- 7. South America TNF Inhibitors for the Treatment of Plaque Psoriasis Analysis, Insights and Forecast, 2020-2032
- 7.1. Market Analysis, Insights and Forecast - by Application
- 7.1.1. Hospital and Clinic
- 7.1.2. Retail Pharmacies
- 7.1.3. Other
- 7.2. Market Analysis, Insights and Forecast - by Types
- 7.2.1. Etanercept
- 7.2.2. Infliximab
- 7.2.3. Adalimumab
- 7.2.4. Certolizumab pegol
- 7.2.5. Other
- 7.1. Market Analysis, Insights and Forecast - by Application
- 8. Europe TNF Inhibitors for the Treatment of Plaque Psoriasis Analysis, Insights and Forecast, 2020-2032
- 8.1. Market Analysis, Insights and Forecast - by Application
- 8.1.1. Hospital and Clinic
- 8.1.2. Retail Pharmacies
- 8.1.3. Other
- 8.2. Market Analysis, Insights and Forecast - by Types
- 8.2.1. Etanercept
- 8.2.2. Infliximab
- 8.2.3. Adalimumab
- 8.2.4. Certolizumab pegol
- 8.2.5. Other
- 8.1. Market Analysis, Insights and Forecast - by Application
- 9. Middle East & Africa TNF Inhibitors for the Treatment of Plaque Psoriasis Analysis, Insights and Forecast, 2020-2032
- 9.1. Market Analysis, Insights and Forecast - by Application
- 9.1.1. Hospital and Clinic
- 9.1.2. Retail Pharmacies
- 9.1.3. Other
- 9.2. Market Analysis, Insights and Forecast - by Types
- 9.2.1. Etanercept
- 9.2.2. Infliximab
- 9.2.3. Adalimumab
- 9.2.4. Certolizumab pegol
- 9.2.5. Other
- 9.1. Market Analysis, Insights and Forecast - by Application
- 10. Asia Pacific TNF Inhibitors for the Treatment of Plaque Psoriasis Analysis, Insights and Forecast, 2020-2032
- 10.1. Market Analysis, Insights and Forecast - by Application
- 10.1.1. Hospital and Clinic
- 10.1.2. Retail Pharmacies
- 10.1.3. Other
- 10.2. Market Analysis, Insights and Forecast - by Types
- 10.2.1. Etanercept
- 10.2.2. Infliximab
- 10.2.3. Adalimumab
- 10.2.4. Certolizumab pegol
- 10.2.5. Other
- 10.1. Market Analysis, Insights and Forecast - by Application
- 11. Competitive Analysis
- 11.1. Global Market Share Analysis 2025
- 11.2. Company Profiles
- 11.2.1 Amgen
- 11.2.1.1. Overview
- 11.2.1.2. Products
- 11.2.1.3. SWOT Analysis
- 11.2.1.4. Recent Developments
- 11.2.1.5. Financials (Based on Availability)
- 11.2.2 AbbVie
- 11.2.2.1. Overview
- 11.2.2.2. Products
- 11.2.2.3. SWOT Analysis
- 11.2.2.4. Recent Developments
- 11.2.2.5. Financials (Based on Availability)
- 11.2.3 Janssen Biotech
- 11.2.3.1. Overview
- 11.2.3.2. Products
- 11.2.3.3. SWOT Analysis
- 11.2.3.4. Recent Developments
- 11.2.3.5. Financials (Based on Availability)
- 11.2.4 Pfizer
- 11.2.4.1. Overview
- 11.2.4.2. Products
- 11.2.4.3. SWOT Analysis
- 11.2.4.4. Recent Developments
- 11.2.4.5. Financials (Based on Availability)
- 11.2.5 Samsung Bioepis
- 11.2.5.1. Overview
- 11.2.5.2. Products
- 11.2.5.3. SWOT Analysis
- 11.2.5.4. Recent Developments
- 11.2.5.5. Financials (Based on Availability)
- 11.2.6 UCB
- 11.2.6.1. Overview
- 11.2.6.2. Products
- 11.2.6.3. SWOT Analysis
- 11.2.6.4. Recent Developments
- 11.2.6.5. Financials (Based on Availability)
- 11.2.7 Sandoz
- 11.2.7.1. Overview
- 11.2.7.2. Products
- 11.2.7.3. SWOT Analysis
- 11.2.7.4. Recent Developments
- 11.2.7.5. Financials (Based on Availability)
- 11.2.8 Boehringer Ingelheim Pharmaceuticals
- 11.2.8.1. Overview
- 11.2.8.2. Products
- 11.2.8.3. SWOT Analysis
- 11.2.8.4. Recent Developments
- 11.2.8.5. Financials (Based on Availability)
- 11.2.9 Biocon Biologics
- 11.2.9.1. Overview
- 11.2.9.2. Products
- 11.2.9.3. SWOT Analysis
- 11.2.9.4. Recent Developments
- 11.2.9.5. Financials (Based on Availability)
- 11.2.10 Coherus BioSciences
- 11.2.10.1. Overview
- 11.2.10.2. Products
- 11.2.10.3. SWOT Analysis
- 11.2.10.4. Recent Developments
- 11.2.10.5. Financials (Based on Availability)
- 11.2.11 YL Biologics
- 11.2.11.1. Overview
- 11.2.11.2. Products
- 11.2.11.3. SWOT Analysis
- 11.2.11.4. Recent Developments
- 11.2.11.5. Financials (Based on Availability)
- 11.2.12 Celltrion
- 11.2.12.1. Overview
- 11.2.12.2. Products
- 11.2.12.3. SWOT Analysis
- 11.2.12.4. Recent Developments
- 11.2.12.5. Financials (Based on Availability)
- 11.2.13 Teva
- 11.2.13.1. Overview
- 11.2.13.2. Products
- 11.2.13.3. SWOT Analysis
- 11.2.13.4. Recent Developments
- 11.2.13.5. Financials (Based on Availability)
- 11.2.14 Innovent Biologics
- 11.2.14.1. Overview
- 11.2.14.2. Products
- 11.2.14.3. SWOT Analysis
- 11.2.14.4. Recent Developments
- 11.2.14.5. Financials (Based on Availability)
- 11.2.15 Bio-Thera Solutions
- 11.2.15.1. Overview
- 11.2.15.2. Products
- 11.2.15.3. SWOT Analysis
- 11.2.15.4. Recent Developments
- 11.2.15.5. Financials (Based on Availability)
- 11.2.16 Sino Cell Technologies
- 11.2.16.1. Overview
- 11.2.16.2. Products
- 11.2.16.3. SWOT Analysis
- 11.2.16.4. Recent Developments
- 11.2.16.5. Financials (Based on Availability)
- 11.2.17 Hangzhou Bozhirui Biopharmaceuticals
- 11.2.17.1. Overview
- 11.2.17.2. Products
- 11.2.17.3. SWOT Analysis
- 11.2.17.4. Recent Developments
- 11.2.17.5. Financials (Based on Availability)
- 11.2.18 Chia Tai Tianqing Pharmaceutical
- 11.2.18.1. Overview
- 11.2.18.2. Products
- 11.2.18.3. SWOT Analysis
- 11.2.18.4. Recent Developments
- 11.2.18.5. Financials (Based on Availability)
- 11.2.19 Hisun Pharmaceuticals
- 11.2.19.1. Overview
- 11.2.19.2. Products
- 11.2.19.3. SWOT Analysis
- 11.2.19.4. Recent Developments
- 11.2.19.5. Financials (Based on Availability)
- 11.2.1 Amgen
List of Figures
- Figure 1: Global TNF Inhibitors for the Treatment of Plaque Psoriasis Revenue Breakdown (undefined, %) by Region 2025 & 2033
- Figure 2: North America TNF Inhibitors for the Treatment of Plaque Psoriasis Revenue (undefined), by Application 2025 & 2033
- Figure 3: North America TNF Inhibitors for the Treatment of Plaque Psoriasis Revenue Share (%), by Application 2025 & 2033
- Figure 4: North America TNF Inhibitors for the Treatment of Plaque Psoriasis Revenue (undefined), by Types 2025 & 2033
- Figure 5: North America TNF Inhibitors for the Treatment of Plaque Psoriasis Revenue Share (%), by Types 2025 & 2033
- Figure 6: North America TNF Inhibitors for the Treatment of Plaque Psoriasis Revenue (undefined), by Country 2025 & 2033
- Figure 7: North America TNF Inhibitors for the Treatment of Plaque Psoriasis Revenue Share (%), by Country 2025 & 2033
- Figure 8: South America TNF Inhibitors for the Treatment of Plaque Psoriasis Revenue (undefined), by Application 2025 & 2033
- Figure 9: South America TNF Inhibitors for the Treatment of Plaque Psoriasis Revenue Share (%), by Application 2025 & 2033
- Figure 10: South America TNF Inhibitors for the Treatment of Plaque Psoriasis Revenue (undefined), by Types 2025 & 2033
- Figure 11: South America TNF Inhibitors for the Treatment of Plaque Psoriasis Revenue Share (%), by Types 2025 & 2033
- Figure 12: South America TNF Inhibitors for the Treatment of Plaque Psoriasis Revenue (undefined), by Country 2025 & 2033
- Figure 13: South America TNF Inhibitors for the Treatment of Plaque Psoriasis Revenue Share (%), by Country 2025 & 2033
- Figure 14: Europe TNF Inhibitors for the Treatment of Plaque Psoriasis Revenue (undefined), by Application 2025 & 2033
- Figure 15: Europe TNF Inhibitors for the Treatment of Plaque Psoriasis Revenue Share (%), by Application 2025 & 2033
- Figure 16: Europe TNF Inhibitors for the Treatment of Plaque Psoriasis Revenue (undefined), by Types 2025 & 2033
- Figure 17: Europe TNF Inhibitors for the Treatment of Plaque Psoriasis Revenue Share (%), by Types 2025 & 2033
- Figure 18: Europe TNF Inhibitors for the Treatment of Plaque Psoriasis Revenue (undefined), by Country 2025 & 2033
- Figure 19: Europe TNF Inhibitors for the Treatment of Plaque Psoriasis Revenue Share (%), by Country 2025 & 2033
- Figure 20: Middle East & Africa TNF Inhibitors for the Treatment of Plaque Psoriasis Revenue (undefined), by Application 2025 & 2033
- Figure 21: Middle East & Africa TNF Inhibitors for the Treatment of Plaque Psoriasis Revenue Share (%), by Application 2025 & 2033
- Figure 22: Middle East & Africa TNF Inhibitors for the Treatment of Plaque Psoriasis Revenue (undefined), by Types 2025 & 2033
- Figure 23: Middle East & Africa TNF Inhibitors for the Treatment of Plaque Psoriasis Revenue Share (%), by Types 2025 & 2033
- Figure 24: Middle East & Africa TNF Inhibitors for the Treatment of Plaque Psoriasis Revenue (undefined), by Country 2025 & 2033
- Figure 25: Middle East & Africa TNF Inhibitors for the Treatment of Plaque Psoriasis Revenue Share (%), by Country 2025 & 2033
- Figure 26: Asia Pacific TNF Inhibitors for the Treatment of Plaque Psoriasis Revenue (undefined), by Application 2025 & 2033
- Figure 27: Asia Pacific TNF Inhibitors for the Treatment of Plaque Psoriasis Revenue Share (%), by Application 2025 & 2033
- Figure 28: Asia Pacific TNF Inhibitors for the Treatment of Plaque Psoriasis Revenue (undefined), by Types 2025 & 2033
- Figure 29: Asia Pacific TNF Inhibitors for the Treatment of Plaque Psoriasis Revenue Share (%), by Types 2025 & 2033
- Figure 30: Asia Pacific TNF Inhibitors for the Treatment of Plaque Psoriasis Revenue (undefined), by Country 2025 & 2033
- Figure 31: Asia Pacific TNF Inhibitors for the Treatment of Plaque Psoriasis Revenue Share (%), by Country 2025 & 2033
List of Tables
- Table 1: Global TNF Inhibitors for the Treatment of Plaque Psoriasis Revenue undefined Forecast, by Application 2020 & 2033
- Table 2: Global TNF Inhibitors for the Treatment of Plaque Psoriasis Revenue undefined Forecast, by Types 2020 & 2033
- Table 3: Global TNF Inhibitors for the Treatment of Plaque Psoriasis Revenue undefined Forecast, by Region 2020 & 2033
- Table 4: Global TNF Inhibitors for the Treatment of Plaque Psoriasis Revenue undefined Forecast, by Application 2020 & 2033
- Table 5: Global TNF Inhibitors for the Treatment of Plaque Psoriasis Revenue undefined Forecast, by Types 2020 & 2033
- Table 6: Global TNF Inhibitors for the Treatment of Plaque Psoriasis Revenue undefined Forecast, by Country 2020 & 2033
- Table 7: United States TNF Inhibitors for the Treatment of Plaque Psoriasis Revenue (undefined) Forecast, by Application 2020 & 2033
- Table 8: Canada TNF Inhibitors for the Treatment of Plaque Psoriasis Revenue (undefined) Forecast, by Application 2020 & 2033
- Table 9: Mexico TNF Inhibitors for the Treatment of Plaque Psoriasis Revenue (undefined) Forecast, by Application 2020 & 2033
- Table 10: Global TNF Inhibitors for the Treatment of Plaque Psoriasis Revenue undefined Forecast, by Application 2020 & 2033
- Table 11: Global TNF Inhibitors for the Treatment of Plaque Psoriasis Revenue undefined Forecast, by Types 2020 & 2033
- Table 12: Global TNF Inhibitors for the Treatment of Plaque Psoriasis Revenue undefined Forecast, by Country 2020 & 2033
- Table 13: Brazil TNF Inhibitors for the Treatment of Plaque Psoriasis Revenue (undefined) Forecast, by Application 2020 & 2033
- Table 14: Argentina TNF Inhibitors for the Treatment of Plaque Psoriasis Revenue (undefined) Forecast, by Application 2020 & 2033
- Table 15: Rest of South America TNF Inhibitors for the Treatment of Plaque Psoriasis Revenue (undefined) Forecast, by Application 2020 & 2033
- Table 16: Global TNF Inhibitors for the Treatment of Plaque Psoriasis Revenue undefined Forecast, by Application 2020 & 2033
- Table 17: Global TNF Inhibitors for the Treatment of Plaque Psoriasis Revenue undefined Forecast, by Types 2020 & 2033
- Table 18: Global TNF Inhibitors for the Treatment of Plaque Psoriasis Revenue undefined Forecast, by Country 2020 & 2033
- Table 19: United Kingdom TNF Inhibitors for the Treatment of Plaque Psoriasis Revenue (undefined) Forecast, by Application 2020 & 2033
- Table 20: Germany TNF Inhibitors for the Treatment of Plaque Psoriasis Revenue (undefined) Forecast, by Application 2020 & 2033
- Table 21: France TNF Inhibitors for the Treatment of Plaque Psoriasis Revenue (undefined) Forecast, by Application 2020 & 2033
- Table 22: Italy TNF Inhibitors for the Treatment of Plaque Psoriasis Revenue (undefined) Forecast, by Application 2020 & 2033
- Table 23: Spain TNF Inhibitors for the Treatment of Plaque Psoriasis Revenue (undefined) Forecast, by Application 2020 & 2033
- Table 24: Russia TNF Inhibitors for the Treatment of Plaque Psoriasis Revenue (undefined) Forecast, by Application 2020 & 2033
- Table 25: Benelux TNF Inhibitors for the Treatment of Plaque Psoriasis Revenue (undefined) Forecast, by Application 2020 & 2033
- Table 26: Nordics TNF Inhibitors for the Treatment of Plaque Psoriasis Revenue (undefined) Forecast, by Application 2020 & 2033
- Table 27: Rest of Europe TNF Inhibitors for the Treatment of Plaque Psoriasis Revenue (undefined) Forecast, by Application 2020 & 2033
- Table 28: Global TNF Inhibitors for the Treatment of Plaque Psoriasis Revenue undefined Forecast, by Application 2020 & 2033
- Table 29: Global TNF Inhibitors for the Treatment of Plaque Psoriasis Revenue undefined Forecast, by Types 2020 & 2033
- Table 30: Global TNF Inhibitors for the Treatment of Plaque Psoriasis Revenue undefined Forecast, by Country 2020 & 2033
- Table 31: Turkey TNF Inhibitors for the Treatment of Plaque Psoriasis Revenue (undefined) Forecast, by Application 2020 & 2033
- Table 32: Israel TNF Inhibitors for the Treatment of Plaque Psoriasis Revenue (undefined) Forecast, by Application 2020 & 2033
- Table 33: GCC TNF Inhibitors for the Treatment of Plaque Psoriasis Revenue (undefined) Forecast, by Application 2020 & 2033
- Table 34: North Africa TNF Inhibitors for the Treatment of Plaque Psoriasis Revenue (undefined) Forecast, by Application 2020 & 2033
- Table 35: South Africa TNF Inhibitors for the Treatment of Plaque Psoriasis Revenue (undefined) Forecast, by Application 2020 & 2033
- Table 36: Rest of Middle East & Africa TNF Inhibitors for the Treatment of Plaque Psoriasis Revenue (undefined) Forecast, by Application 2020 & 2033
- Table 37: Global TNF Inhibitors for the Treatment of Plaque Psoriasis Revenue undefined Forecast, by Application 2020 & 2033
- Table 38: Global TNF Inhibitors for the Treatment of Plaque Psoriasis Revenue undefined Forecast, by Types 2020 & 2033
- Table 39: Global TNF Inhibitors for the Treatment of Plaque Psoriasis Revenue undefined Forecast, by Country 2020 & 2033
- Table 40: China TNF Inhibitors for the Treatment of Plaque Psoriasis Revenue (undefined) Forecast, by Application 2020 & 2033
- Table 41: India TNF Inhibitors for the Treatment of Plaque Psoriasis Revenue (undefined) Forecast, by Application 2020 & 2033
- Table 42: Japan TNF Inhibitors for the Treatment of Plaque Psoriasis Revenue (undefined) Forecast, by Application 2020 & 2033
- Table 43: South Korea TNF Inhibitors for the Treatment of Plaque Psoriasis Revenue (undefined) Forecast, by Application 2020 & 2033
- Table 44: ASEAN TNF Inhibitors for the Treatment of Plaque Psoriasis Revenue (undefined) Forecast, by Application 2020 & 2033
- Table 45: Oceania TNF Inhibitors for the Treatment of Plaque Psoriasis Revenue (undefined) Forecast, by Application 2020 & 2033
- Table 46: Rest of Asia Pacific TNF Inhibitors for the Treatment of Plaque Psoriasis Revenue (undefined) Forecast, by Application 2020 & 2033
Frequently Asked Questions
1. What is the projected Compound Annual Growth Rate (CAGR) of the TNF Inhibitors for the Treatment of Plaque Psoriasis?
The projected CAGR is approximately 10.9%.
2. Which companies are prominent players in the TNF Inhibitors for the Treatment of Plaque Psoriasis?
Key companies in the market include Amgen, AbbVie, Janssen Biotech, Pfizer, Samsung Bioepis, UCB, Sandoz, Boehringer Ingelheim Pharmaceuticals, Biocon Biologics, Coherus BioSciences, YL Biologics, Celltrion, Teva, Innovent Biologics, Bio-Thera Solutions, Sino Cell Technologies, Hangzhou Bozhirui Biopharmaceuticals, Chia Tai Tianqing Pharmaceutical, Hisun Pharmaceuticals.
3. What are the main segments of the TNF Inhibitors for the Treatment of Plaque Psoriasis?
The market segments include Application, Types.
4. Can you provide details about the market size?
The market size is estimated to be USD XXX N/A as of 2022.
5. What are some drivers contributing to market growth?
N/A
6. What are the notable trends driving market growth?
N/A
7. Are there any restraints impacting market growth?
N/A
8. Can you provide examples of recent developments in the market?
N/A
9. What pricing options are available for accessing the report?
Pricing options include single-user, multi-user, and enterprise licenses priced at USD 4900.00, USD 7350.00, and USD 9800.00 respectively.
10. Is the market size provided in terms of value or volume?
The market size is provided in terms of value, measured in N/A.
11. Are there any specific market keywords associated with the report?
Yes, the market keyword associated with the report is "TNF Inhibitors for the Treatment of Plaque Psoriasis," which aids in identifying and referencing the specific market segment covered.
12. How do I determine which pricing option suits my needs best?
The pricing options vary based on user requirements and access needs. Individual users may opt for single-user licenses, while businesses requiring broader access may choose multi-user or enterprise licenses for cost-effective access to the report.
13. Are there any additional resources or data provided in the TNF Inhibitors for the Treatment of Plaque Psoriasis report?
While the report offers comprehensive insights, it's advisable to review the specific contents or supplementary materials provided to ascertain if additional resources or data are available.
14. How can I stay updated on further developments or reports in the TNF Inhibitors for the Treatment of Plaque Psoriasis?
To stay informed about further developments, trends, and reports in the TNF Inhibitors for the Treatment of Plaque Psoriasis, consider subscribing to industry newsletters, following relevant companies and organizations, or regularly checking reputable industry news sources and publications.
Methodology
Step 1 - Identification of Relevant Samples Size from Population Database


Step 2 - Approaches for Defining Global Market Size (Value, Volume* & Price*)

Note*: In applicable scenarios
Step 3 - Data Sources
Primary Research
- Web Analytics
- Survey Reports
- Research Institute
- Latest Research Reports
- Opinion Leaders
Secondary Research
- Annual Reports
- White Paper
- Latest Press Release
- Industry Association
- Paid Database
- Investor Presentations

Step 4 - Data Triangulation
Involves using different sources of information in order to increase the validity of a study
These sources are likely to be stakeholders in a program - participants, other researchers, program staff, other community members, and so on.
Then we put all data in single framework & apply various statistical tools to find out the dynamic on the market.
During the analysis stage, feedback from the stakeholder groups would be compared to determine areas of agreement as well as areas of divergence