

Key Insights
The urinary system drugs market is a significant and expanding sector within the pharmaceutical industry. While precise market sizing data is unavailable, considering the presence of major pharmaceutical players like Johnson & Johnson, Pfizer, and Novartis, alongside numerous generic manufacturers, and the persistent prevalence of urinary tract infections (UTIs) and other conditions affecting the urinary system, a conservative estimate for the 2025 market size could be placed in the range of $25 billion to $30 billion USD. This market is experiencing substantial growth, driven by factors such as the rising global prevalence of chronic kidney disease (CKD), an aging global population increasing susceptibility to urinary tract infections and other age-related conditions, and the development of novel therapeutic agents targeting specific urinary system disorders. The increasing awareness and diagnosis of these conditions further fuel market growth.
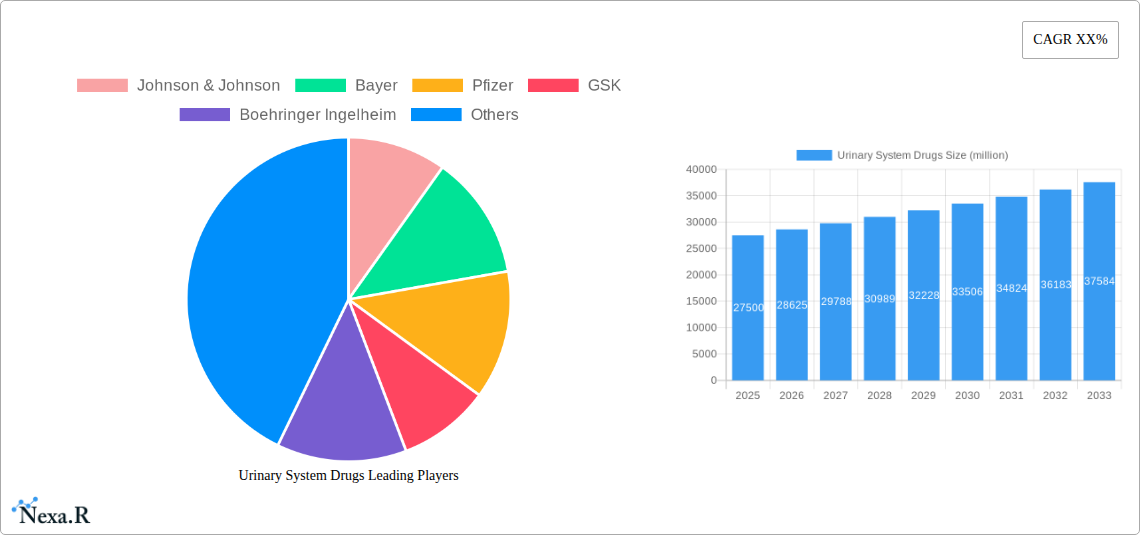
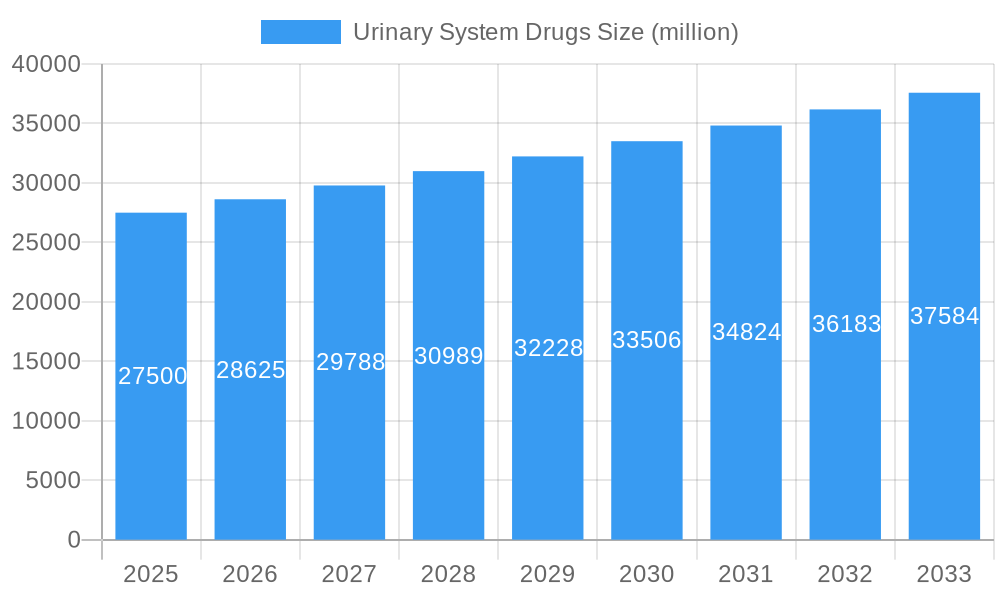
Urinary System Drugs Market Size (In Billion)
However, market growth faces challenges. The complexities of developing effective treatments for certain urinary system diseases, along with rigorous regulatory pathways, pose significant restraints. Furthermore, the patent expirations for several key drugs are leading to increased generic competition, which could potentially impact the pricing and profitability of established players. Future market expansion will likely be influenced by the successful launch of innovative therapies, the development of more targeted treatments to address specific disease sub-types, and the rising adoption of preventative care measures and earlier diagnosis strategies. The market is segmented by drug type (antibiotics, antispasmodics, etc.), by therapeutic area (UTIs, bladder control issues, kidney diseases), and geographic region, offering opportunities for specialized companies to carve out niches within this dynamic landscape. The competitive landscape remains intense, with both established pharmaceutical giants and emerging players vying for market share.
Urinary System Drugs Company Market Share
Urinary System Drugs Market Report: 2019-2033
This comprehensive report provides an in-depth analysis of the Urinary System Drugs market, encompassing market dynamics, growth trends, regional analysis, product landscape, key players, and future outlook. The report covers the period 2019-2033, with a focus on the 2025-2033 forecast period and a base year of 2025. The study includes detailed analysis of the parent market (Pharmaceuticals) and child market (Urological Drugs). This report is essential for pharmaceutical companies, investors, researchers, and regulatory bodies seeking to understand and navigate this dynamic market. Market size values are presented in million units.
Urinary System Drugs Market Dynamics & Structure
The urinary system drugs market is characterized by moderate concentration, with a few major players holding significant market share. Technological innovation, particularly in targeted therapies and drug delivery systems, is a key driver. Regulatory frameworks, including approvals and pricing policies, significantly influence market dynamics. Competitive pressures arise from the development of biosimilars and the emergence of novel therapeutic approaches. The market is segmented by drug class (e.g., antibiotics, anti-infectives, analgesics), route of administration (oral, intravenous), and indication (e.g., urinary tract infections, bladder cancer). Mergers and acquisitions (M&A) activity has been moderate, primarily focused on expanding product portfolios and geographic reach.
- Market Concentration: High, with top 5 players holding approximately xx% of the market share in 2025.
- Technological Innovation: Focus on targeted therapies, personalized medicine, and improved drug delivery systems.
- Regulatory Framework: Stringent regulations impacting drug approvals and pricing.
- Competitive Landscape: Intense competition among established players and emerging biosimilar manufacturers.
- M&A Activity: Moderate activity, with xx deals recorded between 2019 and 2024.
Urinary System Drugs Growth Trends & Insights
The urinary system drugs market experienced a CAGR of xx% during the historical period (2019-2024) and is projected to grow at a CAGR of xx% during the forecast period (2025-2033), reaching xx million units by 2033. Growth is driven by factors such as rising prevalence of urinary tract infections (UTIs), increasing geriatric population, technological advancements in drug development, and improved healthcare infrastructure in developing countries. However, factors such as the emergence of antibiotic resistance and cost constraints on healthcare expenditure pose challenges. Market penetration of newer drugs has been gradually increasing, while adoption rates are influenced by physician prescribing patterns and patient preferences.
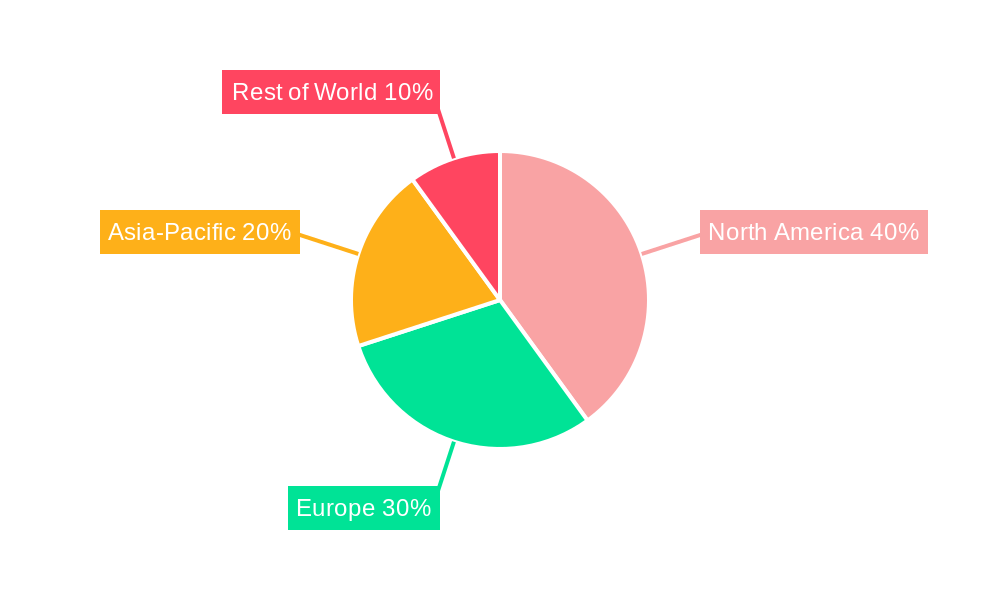
Dominant Regions, Countries, or Segments in Urinary System Drugs
North America currently holds the largest market share, followed by Europe and Asia-Pacific. This dominance is attributable to high healthcare expenditure, advanced healthcare infrastructure, and high prevalence of urinary system diseases. However, the Asia-Pacific region is expected to witness the fastest growth during the forecast period, driven by rising disposable incomes, increasing awareness of urinary health, and expanding healthcare access.
- North America: High market share driven by high healthcare spending and advanced healthcare infrastructure.
- Europe: Significant market presence due to established healthcare systems and aging population.
- Asia-Pacific: Fastest-growing region, driven by increasing disposable income and improved healthcare access.
- Key Drivers: Rising prevalence of UTIs, growing geriatric population, increasing healthcare expenditure.
Urinary System Drugs Product Landscape
The urinary system drugs market offers a diverse range of products, including antibiotics, anti-infectives, analgesics, and other specialized medications. Recent product innovations focus on improving efficacy, reducing side effects, and enhancing patient compliance. Technological advancements such as targeted drug delivery systems and personalized medicine are reshaping the product landscape. Unique selling propositions frequently involve improved bioavailability, reduced treatment durations, and minimized adverse effects.
Key Drivers, Barriers & Challenges in Urinary System Drugs
Key Drivers:
- Increasing prevalence of urinary tract infections (UTIs).
- Growing geriatric population with higher susceptibility to urinary issues.
- Technological advancements leading to the development of more effective and safer drugs.
- Rising healthcare expenditure and improved access to healthcare.
Key Barriers & Challenges:
- Emergence of antibiotic resistance, impacting treatment efficacy.
- High cost of developing and manufacturing new drugs.
- Stringent regulatory requirements for drug approval.
- Intense competition among various pharmaceutical companies.
- Supply chain disruptions potentially impacting drug availability.
Emerging Opportunities in Urinary System Drugs
- Untapped markets in developing countries with growing healthcare needs.
- Development of novel therapies targeting specific urinary system diseases.
- Focus on personalized medicine to improve treatment outcomes.
- Exploration of alternative drug delivery systems for enhanced efficacy and patient compliance.
Growth Accelerators in the Urinary System Drugs Industry
Strategic partnerships and collaborations among pharmaceutical companies can accelerate innovation and market expansion. Technological breakthroughs, such as the development of novel drug delivery systems and personalized therapies, will drive long-term growth. Expansion into untapped markets and investment in research and development are critical to sustain the market's momentum.
Key Players Shaping the Urinary System Drugs Market
- Johnson & Johnson
- Bayer
- Pfizer
- GSK
- Boehringer Ingelheim
- Roche
- Novartis
- AstraZeneca
- Dr. Reddy’s Laboratories
- Mylan
- Sun Pharma
- Cipla
- Merck
- Cubist Pharmaceuticals
- Abbott Laboratories
- Eli Lilly
- Melinta Therapeutics
- Sanofi
- Daiichi Sankyo
- Lupin
- Apogepha
- Astellas Pharma
- Dr. Dunner
- Kowa
- Jiangxi Jimin Kexin Jinshuibao Pharmaceutical
- Tianjin Tongrentang Group
- Jiangsu Hengrui Pharmaceutical
- Hunan Qianjin Xiang River Pharmaceutical
- Kunming Jida Pharmaceutical
- Jiangsu Lianhuan Pharmaceutical
Notable Milestones in Urinary System Drugs Sector
- 2020: FDA approval of a novel antibiotic for complicated UTIs.
- 2022: Launch of a biosimilar of a widely used urinary analgesic.
- 2023: Acquisition of a small biotech company specializing in targeted therapies for bladder cancer. (Further details would need to be added here).
- 2024: Publication of a pivotal clinical trial demonstrating the efficacy of a new drug for interstitial cystitis.
In-Depth Urinary System Drugs Market Outlook
The urinary system drugs market is poised for significant growth over the next decade, driven by factors such as the increasing prevalence of urinary tract infections, the aging global population, and advancements in drug development. Strategic investments in research and development, strategic partnerships, and expansion into emerging markets will shape future growth trajectories. The market will continue to see innovation in drug delivery systems and the development of personalized therapies, potentially leading to more effective and targeted treatments.
Urinary System Drugs Segmentation
-
1. Application
- 1.1. Kidney Disease Medication
- 1.2. Medication For Prostate Disease
- 1.3. Male Dysfunction
- 1.4. Lithotripsy Drug
- 1.5. Others
-
2. Types
- 2.1. Injection
- 2.2. Tablets
- 2.3. Capsule
- 2.4. Suppository
- 2.5. Granules
- 2.6. Powder
- 2.7. Pills
- 2.8. Cream
- 2.9. Others
Urinary System Drugs Segmentation By Geography
-
1. North America
- 1.1. United States
- 1.2. Canada
- 1.3. Mexico
-
2. South America
- 2.1. Brazil
- 2.2. Argentina
- 2.3. Rest of South America
-
3. Europe
- 3.1. United Kingdom
- 3.2. Germany
- 3.3. France
- 3.4. Italy
- 3.5. Spain
- 3.6. Russia
- 3.7. Benelux
- 3.8. Nordics
- 3.9. Rest of Europe
-
4. Middle East & Africa
- 4.1. Turkey
- 4.2. Israel
- 4.3. GCC
- 4.4. North Africa
- 4.5. South Africa
- 4.6. Rest of Middle East & Africa
-
5. Asia Pacific
- 5.1. China
- 5.2. India
- 5.3. Japan
- 5.4. South Korea
- 5.5. ASEAN
- 5.6. Oceania
- 5.7. Rest of Asia Pacific
Urinary System Drugs Regional Market Share
Geographic Coverage of Urinary System Drugs
Urinary System Drugs REPORT HIGHLIGHTS
| Aspects | Details |
|---|---|
| Study Period | 2020-2034 |
| Base Year | 2025 |
| Estimated Year | 2026 |
| Forecast Period | 2026-2034 |
| Historical Period | 2020-2025 |
| Growth Rate | CAGR of XX% from 2020-2034 |
| Segmentation |
|
Table of Contents
- 1. Introduction
- 1.1. Research Scope
- 1.2. Market Segmentation
- 1.3. Research Methodology
- 1.4. Definitions and Assumptions
- 2. Executive Summary
- 2.1. Introduction
- 3. Market Dynamics
- 3.1. Introduction
- 3.2. Market Drivers
- 3.3. Market Restrains
- 3.4. Market Trends
- 4. Market Factor Analysis
- 4.1. Porters Five Forces
- 4.2. Supply/Value Chain
- 4.3. PESTEL analysis
- 4.4. Market Entropy
- 4.5. Patent/Trademark Analysis
- 5. Global Urinary System Drugs Analysis, Insights and Forecast, 2020-2032
- 5.1. Market Analysis, Insights and Forecast - by Application
- 5.1.1. Kidney Disease Medication
- 5.1.2. Medication For Prostate Disease
- 5.1.3. Male Dysfunction
- 5.1.4. Lithotripsy Drug
- 5.1.5. Others
- 5.2. Market Analysis, Insights and Forecast - by Types
- 5.2.1. Injection
- 5.2.2. Tablets
- 5.2.3. Capsule
- 5.2.4. Suppository
- 5.2.5. Granules
- 5.2.6. Powder
- 5.2.7. Pills
- 5.2.8. Cream
- 5.2.9. Others
- 5.3. Market Analysis, Insights and Forecast - by Region
- 5.3.1. North America
- 5.3.2. South America
- 5.3.3. Europe
- 5.3.4. Middle East & Africa
- 5.3.5. Asia Pacific
- 5.1. Market Analysis, Insights and Forecast - by Application
- 6. North America Urinary System Drugs Analysis, Insights and Forecast, 2020-2032
- 6.1. Market Analysis, Insights and Forecast - by Application
- 6.1.1. Kidney Disease Medication
- 6.1.2. Medication For Prostate Disease
- 6.1.3. Male Dysfunction
- 6.1.4. Lithotripsy Drug
- 6.1.5. Others
- 6.2. Market Analysis, Insights and Forecast - by Types
- 6.2.1. Injection
- 6.2.2. Tablets
- 6.2.3. Capsule
- 6.2.4. Suppository
- 6.2.5. Granules
- 6.2.6. Powder
- 6.2.7. Pills
- 6.2.8. Cream
- 6.2.9. Others
- 6.1. Market Analysis, Insights and Forecast - by Application
- 7. South America Urinary System Drugs Analysis, Insights and Forecast, 2020-2032
- 7.1. Market Analysis, Insights and Forecast - by Application
- 7.1.1. Kidney Disease Medication
- 7.1.2. Medication For Prostate Disease
- 7.1.3. Male Dysfunction
- 7.1.4. Lithotripsy Drug
- 7.1.5. Others
- 7.2. Market Analysis, Insights and Forecast - by Types
- 7.2.1. Injection
- 7.2.2. Tablets
- 7.2.3. Capsule
- 7.2.4. Suppository
- 7.2.5. Granules
- 7.2.6. Powder
- 7.2.7. Pills
- 7.2.8. Cream
- 7.2.9. Others
- 7.1. Market Analysis, Insights and Forecast - by Application
- 8. Europe Urinary System Drugs Analysis, Insights and Forecast, 2020-2032
- 8.1. Market Analysis, Insights and Forecast - by Application
- 8.1.1. Kidney Disease Medication
- 8.1.2. Medication For Prostate Disease
- 8.1.3. Male Dysfunction
- 8.1.4. Lithotripsy Drug
- 8.1.5. Others
- 8.2. Market Analysis, Insights and Forecast - by Types
- 8.2.1. Injection
- 8.2.2. Tablets
- 8.2.3. Capsule
- 8.2.4. Suppository
- 8.2.5. Granules
- 8.2.6. Powder
- 8.2.7. Pills
- 8.2.8. Cream
- 8.2.9. Others
- 8.1. Market Analysis, Insights and Forecast - by Application
- 9. Middle East & Africa Urinary System Drugs Analysis, Insights and Forecast, 2020-2032
- 9.1. Market Analysis, Insights and Forecast - by Application
- 9.1.1. Kidney Disease Medication
- 9.1.2. Medication For Prostate Disease
- 9.1.3. Male Dysfunction
- 9.1.4. Lithotripsy Drug
- 9.1.5. Others
- 9.2. Market Analysis, Insights and Forecast - by Types
- 9.2.1. Injection
- 9.2.2. Tablets
- 9.2.3. Capsule
- 9.2.4. Suppository
- 9.2.5. Granules
- 9.2.6. Powder
- 9.2.7. Pills
- 9.2.8. Cream
- 9.2.9. Others
- 9.1. Market Analysis, Insights and Forecast - by Application
- 10. Asia Pacific Urinary System Drugs Analysis, Insights and Forecast, 2020-2032
- 10.1. Market Analysis, Insights and Forecast - by Application
- 10.1.1. Kidney Disease Medication
- 10.1.2. Medication For Prostate Disease
- 10.1.3. Male Dysfunction
- 10.1.4. Lithotripsy Drug
- 10.1.5. Others
- 10.2. Market Analysis, Insights and Forecast - by Types
- 10.2.1. Injection
- 10.2.2. Tablets
- 10.2.3. Capsule
- 10.2.4. Suppository
- 10.2.5. Granules
- 10.2.6. Powder
- 10.2.7. Pills
- 10.2.8. Cream
- 10.2.9. Others
- 10.1. Market Analysis, Insights and Forecast - by Application
- 11. Competitive Analysis
- 11.1. Global Market Share Analysis 2025
- 11.2. Company Profiles
- 11.2.1 Johnson & Johnson
- 11.2.1.1. Overview
- 11.2.1.2. Products
- 11.2.1.3. SWOT Analysis
- 11.2.1.4. Recent Developments
- 11.2.1.5. Financials (Based on Availability)
- 11.2.2 Bayer
- 11.2.2.1. Overview
- 11.2.2.2. Products
- 11.2.2.3. SWOT Analysis
- 11.2.2.4. Recent Developments
- 11.2.2.5. Financials (Based on Availability)
- 11.2.3 Pfizer
- 11.2.3.1. Overview
- 11.2.3.2. Products
- 11.2.3.3. SWOT Analysis
- 11.2.3.4. Recent Developments
- 11.2.3.5. Financials (Based on Availability)
- 11.2.4 GSK
- 11.2.4.1. Overview
- 11.2.4.2. Products
- 11.2.4.3. SWOT Analysis
- 11.2.4.4. Recent Developments
- 11.2.4.5. Financials (Based on Availability)
- 11.2.5 Boehringer Ingelheim
- 11.2.5.1. Overview
- 11.2.5.2. Products
- 11.2.5.3. SWOT Analysis
- 11.2.5.4. Recent Developments
- 11.2.5.5. Financials (Based on Availability)
- 11.2.6 Roche
- 11.2.6.1. Overview
- 11.2.6.2. Products
- 11.2.6.3. SWOT Analysis
- 11.2.6.4. Recent Developments
- 11.2.6.5. Financials (Based on Availability)
- 11.2.7 Novartis
- 11.2.7.1. Overview
- 11.2.7.2. Products
- 11.2.7.3. SWOT Analysis
- 11.2.7.4. Recent Developments
- 11.2.7.5. Financials (Based on Availability)
- 11.2.8 AstraZeneca
- 11.2.8.1. Overview
- 11.2.8.2. Products
- 11.2.8.3. SWOT Analysis
- 11.2.8.4. Recent Developments
- 11.2.8.5. Financials (Based on Availability)
- 11.2.9 Dr. Reddy’s Laboratories
- 11.2.9.1. Overview
- 11.2.9.2. Products
- 11.2.9.3. SWOT Analysis
- 11.2.9.4. Recent Developments
- 11.2.9.5. Financials (Based on Availability)
- 11.2.10 Mylan
- 11.2.10.1. Overview
- 11.2.10.2. Products
- 11.2.10.3. SWOT Analysis
- 11.2.10.4. Recent Developments
- 11.2.10.5. Financials (Based on Availability)
- 11.2.11 Sun Pharma
- 11.2.11.1. Overview
- 11.2.11.2. Products
- 11.2.11.3. SWOT Analysis
- 11.2.11.4. Recent Developments
- 11.2.11.5. Financials (Based on Availability)
- 11.2.12 Cipla
- 11.2.12.1. Overview
- 11.2.12.2. Products
- 11.2.12.3. SWOT Analysis
- 11.2.12.4. Recent Developments
- 11.2.12.5. Financials (Based on Availability)
- 11.2.13 Merck
- 11.2.13.1. Overview
- 11.2.13.2. Products
- 11.2.13.3. SWOT Analysis
- 11.2.13.4. Recent Developments
- 11.2.13.5. Financials (Based on Availability)
- 11.2.14 Cubist Pharmaceuticals
- 11.2.14.1. Overview
- 11.2.14.2. Products
- 11.2.14.3. SWOT Analysis
- 11.2.14.4. Recent Developments
- 11.2.14.5. Financials (Based on Availability)
- 11.2.15 Abbott Laboratories
- 11.2.15.1. Overview
- 11.2.15.2. Products
- 11.2.15.3. SWOT Analysis
- 11.2.15.4. Recent Developments
- 11.2.15.5. Financials (Based on Availability)
- 11.2.16 Eli Lilly
- 11.2.16.1. Overview
- 11.2.16.2. Products
- 11.2.16.3. SWOT Analysis
- 11.2.16.4. Recent Developments
- 11.2.16.5. Financials (Based on Availability)
- 11.2.17 Melinta Therapeutics
- 11.2.17.1. Overview
- 11.2.17.2. Products
- 11.2.17.3. SWOT Analysis
- 11.2.17.4. Recent Developments
- 11.2.17.5. Financials (Based on Availability)
- 11.2.18 Sanofi
- 11.2.18.1. Overview
- 11.2.18.2. Products
- 11.2.18.3. SWOT Analysis
- 11.2.18.4. Recent Developments
- 11.2.18.5. Financials (Based on Availability)
- 11.2.19 Daiichi Sankyo
- 11.2.19.1. Overview
- 11.2.19.2. Products
- 11.2.19.3. SWOT Analysis
- 11.2.19.4. Recent Developments
- 11.2.19.5. Financials (Based on Availability)
- 11.2.20 Lupin
- 11.2.20.1. Overview
- 11.2.20.2. Products
- 11.2.20.3. SWOT Analysis
- 11.2.20.4. Recent Developments
- 11.2.20.5. Financials (Based on Availability)
- 11.2.21 Apogepha
- 11.2.21.1. Overview
- 11.2.21.2. Products
- 11.2.21.3. SWOT Analysis
- 11.2.21.4. Recent Developments
- 11.2.21.5. Financials (Based on Availability)
- 11.2.22 Astellas Pharma
- 11.2.22.1. Overview
- 11.2.22.2. Products
- 11.2.22.3. SWOT Analysis
- 11.2.22.4. Recent Developments
- 11.2.22.5. Financials (Based on Availability)
- 11.2.23 Dr. Dunner
- 11.2.23.1. Overview
- 11.2.23.2. Products
- 11.2.23.3. SWOT Analysis
- 11.2.23.4. Recent Developments
- 11.2.23.5. Financials (Based on Availability)
- 11.2.24 Kowa
- 11.2.24.1. Overview
- 11.2.24.2. Products
- 11.2.24.3. SWOT Analysis
- 11.2.24.4. Recent Developments
- 11.2.24.5. Financials (Based on Availability)
- 11.2.25 Jiangxi Jimin Kexin Jinshuibao Pharmaceutical
- 11.2.25.1. Overview
- 11.2.25.2. Products
- 11.2.25.3. SWOT Analysis
- 11.2.25.4. Recent Developments
- 11.2.25.5. Financials (Based on Availability)
- 11.2.26 Tianjin Tongrentang Group
- 11.2.26.1. Overview
- 11.2.26.2. Products
- 11.2.26.3. SWOT Analysis
- 11.2.26.4. Recent Developments
- 11.2.26.5. Financials (Based on Availability)
- 11.2.27 Jiangsu Hengrui Pharmaceutical
- 11.2.27.1. Overview
- 11.2.27.2. Products
- 11.2.27.3. SWOT Analysis
- 11.2.27.4. Recent Developments
- 11.2.27.5. Financials (Based on Availability)
- 11.2.28 Hunan Qianjin Xiang River Pharmaceutical
- 11.2.28.1. Overview
- 11.2.28.2. Products
- 11.2.28.3. SWOT Analysis
- 11.2.28.4. Recent Developments
- 11.2.28.5. Financials (Based on Availability)
- 11.2.29 Kunming Jida Pharmaceutical
- 11.2.29.1. Overview
- 11.2.29.2. Products
- 11.2.29.3. SWOT Analysis
- 11.2.29.4. Recent Developments
- 11.2.29.5. Financials (Based on Availability)
- 11.2.30 Jiangsu Lianhuan Pharmaceutical
- 11.2.30.1. Overview
- 11.2.30.2. Products
- 11.2.30.3. SWOT Analysis
- 11.2.30.4. Recent Developments
- 11.2.30.5. Financials (Based on Availability)
- 11.2.1 Johnson & Johnson
List of Figures
- Figure 1: Global Urinary System Drugs Revenue Breakdown (million, %) by Region 2025 & 2033
- Figure 2: North America Urinary System Drugs Revenue (million), by Application 2025 & 2033
- Figure 3: North America Urinary System Drugs Revenue Share (%), by Application 2025 & 2033
- Figure 4: North America Urinary System Drugs Revenue (million), by Types 2025 & 2033
- Figure 5: North America Urinary System Drugs Revenue Share (%), by Types 2025 & 2033
- Figure 6: North America Urinary System Drugs Revenue (million), by Country 2025 & 2033
- Figure 7: North America Urinary System Drugs Revenue Share (%), by Country 2025 & 2033
- Figure 8: South America Urinary System Drugs Revenue (million), by Application 2025 & 2033
- Figure 9: South America Urinary System Drugs Revenue Share (%), by Application 2025 & 2033
- Figure 10: South America Urinary System Drugs Revenue (million), by Types 2025 & 2033
- Figure 11: South America Urinary System Drugs Revenue Share (%), by Types 2025 & 2033
- Figure 12: South America Urinary System Drugs Revenue (million), by Country 2025 & 2033
- Figure 13: South America Urinary System Drugs Revenue Share (%), by Country 2025 & 2033
- Figure 14: Europe Urinary System Drugs Revenue (million), by Application 2025 & 2033
- Figure 15: Europe Urinary System Drugs Revenue Share (%), by Application 2025 & 2033
- Figure 16: Europe Urinary System Drugs Revenue (million), by Types 2025 & 2033
- Figure 17: Europe Urinary System Drugs Revenue Share (%), by Types 2025 & 2033
- Figure 18: Europe Urinary System Drugs Revenue (million), by Country 2025 & 2033
- Figure 19: Europe Urinary System Drugs Revenue Share (%), by Country 2025 & 2033
- Figure 20: Middle East & Africa Urinary System Drugs Revenue (million), by Application 2025 & 2033
- Figure 21: Middle East & Africa Urinary System Drugs Revenue Share (%), by Application 2025 & 2033
- Figure 22: Middle East & Africa Urinary System Drugs Revenue (million), by Types 2025 & 2033
- Figure 23: Middle East & Africa Urinary System Drugs Revenue Share (%), by Types 2025 & 2033
- Figure 24: Middle East & Africa Urinary System Drugs Revenue (million), by Country 2025 & 2033
- Figure 25: Middle East & Africa Urinary System Drugs Revenue Share (%), by Country 2025 & 2033
- Figure 26: Asia Pacific Urinary System Drugs Revenue (million), by Application 2025 & 2033
- Figure 27: Asia Pacific Urinary System Drugs Revenue Share (%), by Application 2025 & 2033
- Figure 28: Asia Pacific Urinary System Drugs Revenue (million), by Types 2025 & 2033
- Figure 29: Asia Pacific Urinary System Drugs Revenue Share (%), by Types 2025 & 2033
- Figure 30: Asia Pacific Urinary System Drugs Revenue (million), by Country 2025 & 2033
- Figure 31: Asia Pacific Urinary System Drugs Revenue Share (%), by Country 2025 & 2033
List of Tables
- Table 1: Global Urinary System Drugs Revenue million Forecast, by Application 2020 & 2033
- Table 2: Global Urinary System Drugs Revenue million Forecast, by Types 2020 & 2033
- Table 3: Global Urinary System Drugs Revenue million Forecast, by Region 2020 & 2033
- Table 4: Global Urinary System Drugs Revenue million Forecast, by Application 2020 & 2033
- Table 5: Global Urinary System Drugs Revenue million Forecast, by Types 2020 & 2033
- Table 6: Global Urinary System Drugs Revenue million Forecast, by Country 2020 & 2033
- Table 7: United States Urinary System Drugs Revenue (million) Forecast, by Application 2020 & 2033
- Table 8: Canada Urinary System Drugs Revenue (million) Forecast, by Application 2020 & 2033
- Table 9: Mexico Urinary System Drugs Revenue (million) Forecast, by Application 2020 & 2033
- Table 10: Global Urinary System Drugs Revenue million Forecast, by Application 2020 & 2033
- Table 11: Global Urinary System Drugs Revenue million Forecast, by Types 2020 & 2033
- Table 12: Global Urinary System Drugs Revenue million Forecast, by Country 2020 & 2033
- Table 13: Brazil Urinary System Drugs Revenue (million) Forecast, by Application 2020 & 2033
- Table 14: Argentina Urinary System Drugs Revenue (million) Forecast, by Application 2020 & 2033
- Table 15: Rest of South America Urinary System Drugs Revenue (million) Forecast, by Application 2020 & 2033
- Table 16: Global Urinary System Drugs Revenue million Forecast, by Application 2020 & 2033
- Table 17: Global Urinary System Drugs Revenue million Forecast, by Types 2020 & 2033
- Table 18: Global Urinary System Drugs Revenue million Forecast, by Country 2020 & 2033
- Table 19: United Kingdom Urinary System Drugs Revenue (million) Forecast, by Application 2020 & 2033
- Table 20: Germany Urinary System Drugs Revenue (million) Forecast, by Application 2020 & 2033
- Table 21: France Urinary System Drugs Revenue (million) Forecast, by Application 2020 & 2033
- Table 22: Italy Urinary System Drugs Revenue (million) Forecast, by Application 2020 & 2033
- Table 23: Spain Urinary System Drugs Revenue (million) Forecast, by Application 2020 & 2033
- Table 24: Russia Urinary System Drugs Revenue (million) Forecast, by Application 2020 & 2033
- Table 25: Benelux Urinary System Drugs Revenue (million) Forecast, by Application 2020 & 2033
- Table 26: Nordics Urinary System Drugs Revenue (million) Forecast, by Application 2020 & 2033
- Table 27: Rest of Europe Urinary System Drugs Revenue (million) Forecast, by Application 2020 & 2033
- Table 28: Global Urinary System Drugs Revenue million Forecast, by Application 2020 & 2033
- Table 29: Global Urinary System Drugs Revenue million Forecast, by Types 2020 & 2033
- Table 30: Global Urinary System Drugs Revenue million Forecast, by Country 2020 & 2033
- Table 31: Turkey Urinary System Drugs Revenue (million) Forecast, by Application 2020 & 2033
- Table 32: Israel Urinary System Drugs Revenue (million) Forecast, by Application 2020 & 2033
- Table 33: GCC Urinary System Drugs Revenue (million) Forecast, by Application 2020 & 2033
- Table 34: North Africa Urinary System Drugs Revenue (million) Forecast, by Application 2020 & 2033
- Table 35: South Africa Urinary System Drugs Revenue (million) Forecast, by Application 2020 & 2033
- Table 36: Rest of Middle East & Africa Urinary System Drugs Revenue (million) Forecast, by Application 2020 & 2033
- Table 37: Global Urinary System Drugs Revenue million Forecast, by Application 2020 & 2033
- Table 38: Global Urinary System Drugs Revenue million Forecast, by Types 2020 & 2033
- Table 39: Global Urinary System Drugs Revenue million Forecast, by Country 2020 & 2033
- Table 40: China Urinary System Drugs Revenue (million) Forecast, by Application 2020 & 2033
- Table 41: India Urinary System Drugs Revenue (million) Forecast, by Application 2020 & 2033
- Table 42: Japan Urinary System Drugs Revenue (million) Forecast, by Application 2020 & 2033
- Table 43: South Korea Urinary System Drugs Revenue (million) Forecast, by Application 2020 & 2033
- Table 44: ASEAN Urinary System Drugs Revenue (million) Forecast, by Application 2020 & 2033
- Table 45: Oceania Urinary System Drugs Revenue (million) Forecast, by Application 2020 & 2033
- Table 46: Rest of Asia Pacific Urinary System Drugs Revenue (million) Forecast, by Application 2020 & 2033
Frequently Asked Questions
1. What is the projected Compound Annual Growth Rate (CAGR) of the Urinary System Drugs?
The projected CAGR is approximately XX%.
2. Which companies are prominent players in the Urinary System Drugs?
Key companies in the market include Johnson & Johnson, Bayer, Pfizer, GSK, Boehringer Ingelheim, Roche, Novartis, AstraZeneca, Dr. Reddy’s Laboratories, Mylan, Sun Pharma, Cipla, Merck, Cubist Pharmaceuticals, Abbott Laboratories, Eli Lilly, Melinta Therapeutics, Sanofi, Daiichi Sankyo, Lupin, Apogepha, Astellas Pharma, Dr. Dunner, Kowa, Jiangxi Jimin Kexin Jinshuibao Pharmaceutical, Tianjin Tongrentang Group, Jiangsu Hengrui Pharmaceutical, Hunan Qianjin Xiang River Pharmaceutical, Kunming Jida Pharmaceutical, Jiangsu Lianhuan Pharmaceutical.
3. What are the main segments of the Urinary System Drugs?
The market segments include Application, Types.
4. Can you provide details about the market size?
The market size is estimated to be USD XXX million as of 2022.
5. What are some drivers contributing to market growth?
N/A
6. What are the notable trends driving market growth?
N/A
7. Are there any restraints impacting market growth?
N/A
8. Can you provide examples of recent developments in the market?
N/A
9. What pricing options are available for accessing the report?
Pricing options include single-user, multi-user, and enterprise licenses priced at USD 4900.00, USD 7350.00, and USD 9800.00 respectively.
10. Is the market size provided in terms of value or volume?
The market size is provided in terms of value, measured in million.
11. Are there any specific market keywords associated with the report?
Yes, the market keyword associated with the report is "Urinary System Drugs," which aids in identifying and referencing the specific market segment covered.
12. How do I determine which pricing option suits my needs best?
The pricing options vary based on user requirements and access needs. Individual users may opt for single-user licenses, while businesses requiring broader access may choose multi-user or enterprise licenses for cost-effective access to the report.
13. Are there any additional resources or data provided in the Urinary System Drugs report?
While the report offers comprehensive insights, it's advisable to review the specific contents or supplementary materials provided to ascertain if additional resources or data are available.
14. How can I stay updated on further developments or reports in the Urinary System Drugs?
To stay informed about further developments, trends, and reports in the Urinary System Drugs, consider subscribing to industry newsletters, following relevant companies and organizations, or regularly checking reputable industry news sources and publications.
Methodology
Step 1 - Identification of Relevant Samples Size from Population Database


Step 2 - Approaches for Defining Global Market Size (Value, Volume* & Price*)

Note*: In applicable scenarios
Step 3 - Data Sources
Primary Research
- Web Analytics
- Survey Reports
- Research Institute
- Latest Research Reports
- Opinion Leaders
Secondary Research
- Annual Reports
- White Paper
- Latest Press Release
- Industry Association
- Paid Database
- Investor Presentations

Step 4 - Data Triangulation
Involves using different sources of information in order to increase the validity of a study
These sources are likely to be stakeholders in a program - participants, other researchers, program staff, other community members, and so on.
Then we put all data in single framework & apply various statistical tools to find out the dynamic on the market.
During the analysis stage, feedback from the stakeholder groups would be compared to determine areas of agreement as well as areas of divergence