

Key Insights
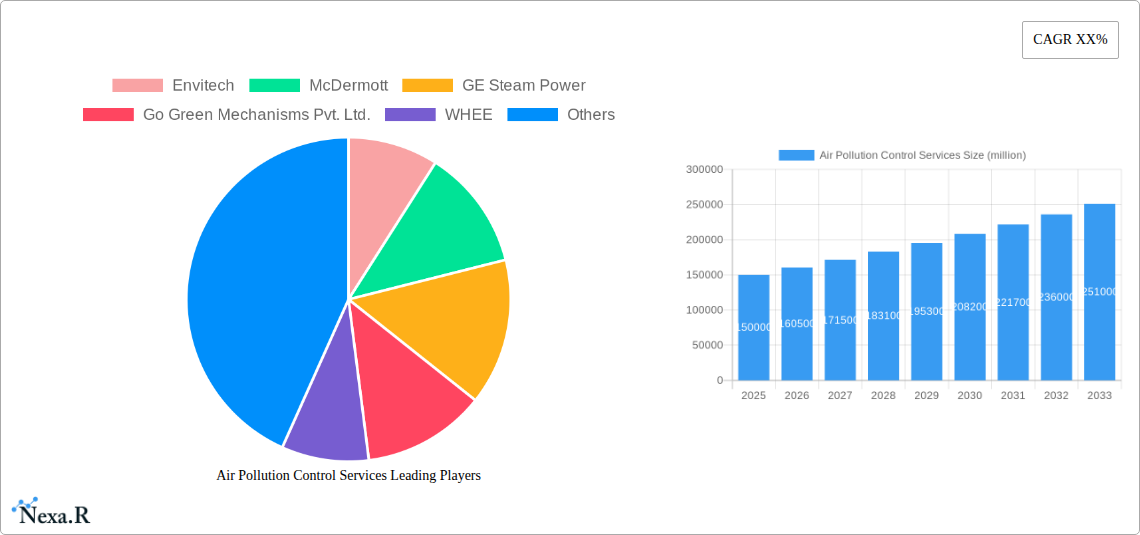
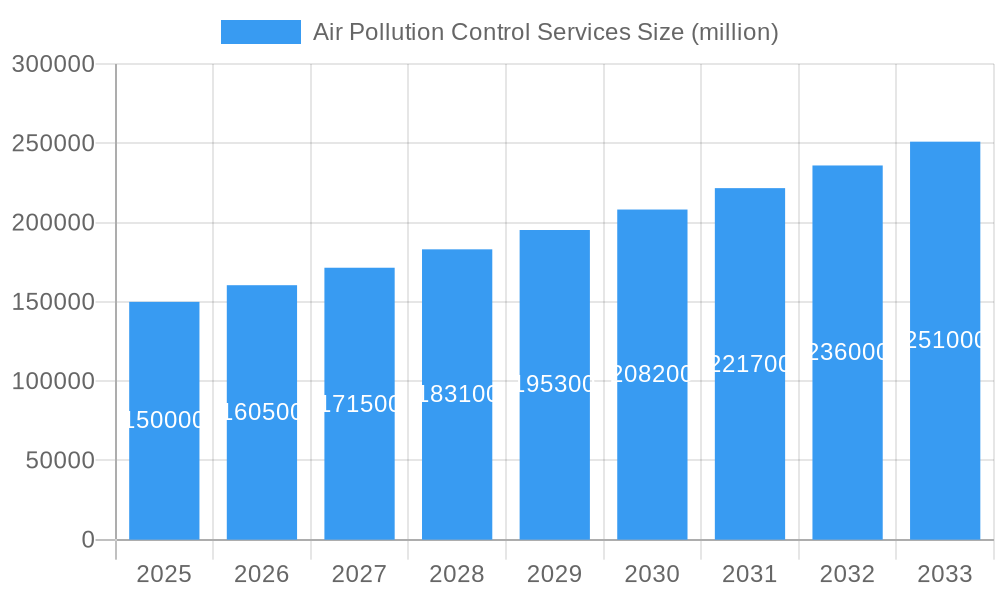
The Air Pollution Control Services market is experiencing robust growth, driven by stringent government regulations aimed at improving air quality, increasing industrialization in developing economies, and growing public awareness of air pollution's health impacts. The market's value is estimated to be $150 billion in 2025, with a Compound Annual Growth Rate (CAGR) of 7% projected through 2033. This growth is fueled by several key trends, including the rising adoption of advanced technologies such as high-efficiency particulate air (HEPA) filters, electrostatic precipitators, and selective catalytic reduction (SCR) systems. Furthermore, the increasing demand for cleaner energy sources, coupled with the expansion of renewable energy infrastructure, is creating substantial opportunities within the sector. However, high initial investment costs for pollution control equipment and the complex implementation processes associated with some technologies pose significant challenges to market expansion. The market is segmented by technology type (e.g., scrubbers, filters, thermal oxidizers), application (e.g., industrial, municipal, transportation), and geographic region. Leading players like Envitech, McDermott, and GE Steam Power are leveraging technological advancements and strategic partnerships to gain a competitive edge, while smaller, specialized firms are focusing on niche applications and geographic markets.
Air Pollution Control Services Market Size (In Billion)
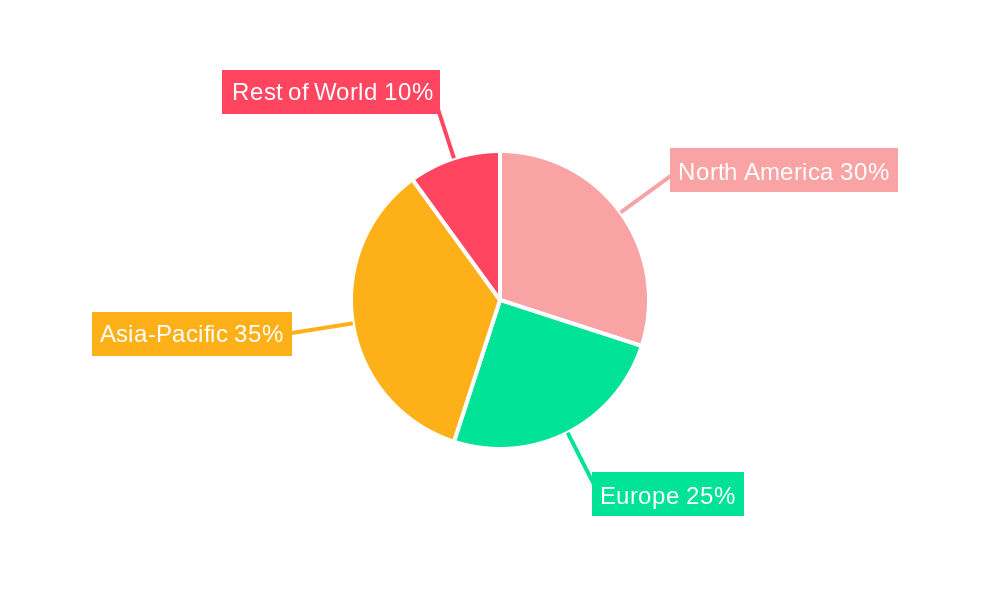
The competitive landscape is characterized by both large multinational corporations and smaller, specialized companies. Larger players often offer a broader range of services and technologies, while smaller firms focus on specific niches, such as specialized filter systems or industrial process optimization. This segmentation allows for a diversified market, catering to the varied needs of different industries and regions. Future growth will likely be shaped by advancements in artificial intelligence (AI) and machine learning for optimizing pollution control systems, the development of more sustainable and cost-effective technologies, and the continued strengthening of environmental regulations worldwide. The Asia-Pacific region, particularly China and India, is expected to exhibit significant growth due to rapid industrialization and increasing governmental focus on environmental protection. North America and Europe will continue to be substantial markets, driven by ongoing regulatory compliance and technological innovation.
Air Pollution Control Services Company Market Share
Air Pollution Control Services Market Report: 2019-2033
This comprehensive report provides an in-depth analysis of the Air Pollution Control Services market, encompassing market dynamics, growth trends, regional dominance, product landscape, key players, and future outlook. The study period covers 2019-2033, with a base year of 2025 and a forecast period of 2025-2033. The report caters to industry professionals, investors, and stakeholders seeking a thorough understanding of this vital sector. The market is segmented by various technologies and applications, addressing both the parent market of environmental services and the child market of air pollution control solutions. The total market size in 2025 is estimated at xx million.
Air Pollution Control Services Market Dynamics & Structure
The Air Pollution Control Services market is characterized by moderate concentration, with several large players alongside numerous specialized firms. Technological innovation, driven by increasingly stringent environmental regulations and the demand for cleaner air, is a key market driver. The market is also influenced by mergers and acquisitions (M&A) activity, as larger companies seek to expand their portfolios and market share.
- Market Concentration: Moderately concentrated, with the top 5 players holding an estimated xx% market share in 2025.
- Technological Innovation: Strong emphasis on advanced filtration, emission control technologies (e.g., SCR, SNCR), and data analytics for real-time monitoring and optimization. Innovation barriers include high R&D costs and the need for regulatory approvals.
- Regulatory Frameworks: Stringent emission standards (e.g., EPA regulations in the US, EU Directives in Europe) are major drivers, pushing adoption of advanced technologies.
- Competitive Product Substitutes: Limited direct substitutes, with the focus primarily on improving existing technologies' efficiency and cost-effectiveness.
- End-User Demographics: Significant demand from power generation, industrial manufacturing, and transportation sectors. Growth in emerging economies is driving expansion.
- M&A Trends: A steady increase in M&A activity, particularly among larger companies seeking to broaden their technology offerings and geographic reach. Estimated xx M&A deals occurred between 2019 and 2024.
Air Pollution Control Services Growth Trends & Insights
The Air Pollution Control Services market exhibits strong growth momentum, driven by increasing environmental awareness, tightening regulations, and industrial expansion. Market size is projected to reach xx million by 2033, exhibiting a CAGR of xx% during the forecast period. Adoption rates vary across regions and industries, with higher adoption in developed economies and regulated sectors.
Technological advancements, such as the integration of AI and IoT in monitoring and control systems, are transforming the market. Consumer behavior is shifting towards greater demand for sustainable and environmentally friendly solutions, further propelling market growth.
Dominant Regions, Countries, or Segments in Air Pollution Control Services
North America and Europe currently dominate the market, driven by stringent environmental regulations and a strong industrial base. However, Asia-Pacific is expected to witness the fastest growth rate during the forecast period, fueled by rapid industrialization and urbanization in developing economies.
- Key Drivers:
- North America & Europe: Stringent environmental regulations, advanced industrial infrastructure, high environmental awareness.
- Asia-Pacific: Rapid industrialization, urbanization, growing government initiatives to improve air quality.
- Dominance Factors: Market share, regulatory landscape, economic development, and technological advancements.
Air Pollution Control Services Product Landscape
The market offers a diverse range of products, including particulate matter filters, scrubbers, selective catalytic reduction (SCR) systems, and other emission control technologies. Recent innovations focus on improving efficiency, reducing energy consumption, and enhancing monitoring capabilities. Unique selling propositions include minimized environmental impact, cost-effectiveness, and ease of integration. Advanced materials and digital technologies play a pivotal role in enhancing product performance.
Key Drivers, Barriers & Challenges in Air Pollution Control Services
Key Drivers: Stringent environmental regulations, rising pollution levels in urban areas, increasing industrial activity, and growing awareness of health impacts of air pollution.
Challenges: High initial investment costs, complex installation procedures, ongoing maintenance requirements, and potential supply chain disruptions due to material shortages. Regulatory hurdles and competition from established players are also major constraints.
Emerging Opportunities in Air Pollution Control Services
Emerging opportunities include the expansion into developing economies, the integration of renewable energy sources with pollution control systems, the development of more efficient and sustainable technologies, and the growing adoption of smart solutions. Furthermore, the increasing demand for real-time monitoring and data analytics presents significant growth potential.
Growth Accelerators in the Air Pollution Control Services Industry
Technological breakthroughs in materials science, sensor technology, and AI are key growth accelerators. Strategic partnerships between technology providers and end-users are also driving market expansion. Government incentives and subsidies promoting clean technologies further stimulate growth.
Key Players Shaping the Air Pollution Control Services Market
- Envitech
- McDermott
- GE Steam Power
- Go Green Mechanisms Pvt. Ltd.
- WHEE
- Thermax Group
- Monroe Environmental
- Anguil
- Dürr Megtec
- Intellishare Environmental
- Kono Kogs
- Air Applications
- Advanced Air Technologies Inc.
- ACFM Corp
- Air Chem Systems, Inc.
- Air Quality Engineering
- Air Separation Technologies, Inc.
Notable Milestones in Air Pollution Control Services Sector
- 2020: Introduction of a new generation of high-efficiency particulate air (HEPA) filters by several key players.
- 2022: Implementation of stricter emission standards in several key regions globally.
- 2023: Significant M&A activity leading to consolidation within the industry. (Specific deals will be detailed within the report)
In-Depth Air Pollution Control Services Market Outlook
The Air Pollution Control Services market is poised for robust growth, driven by continued regulatory pressure, technological innovation, and increasing environmental awareness. Strategic opportunities exist in developing innovative solutions, expanding into untapped markets, and forming strategic partnerships. The focus on sustainable solutions and digital technologies will further shape the industry's future.
Air Pollution Control Services Segmentation
-
1. Application
- 1.1. Industrial
- 1.2. Residential
- 1.3. Commercial
-
2. Types
- 2.1. Air Quality Monitoring
- 2.2. Indoor Air Quality Improvement
- 2.3. Stack Emission Monitoring
- 2.4. Others
Air Pollution Control Services Segmentation By Geography
-
1. North America
- 1.1. United States
- 1.2. Canada
- 1.3. Mexico
-
2. South America
- 2.1. Brazil
- 2.2. Argentina
- 2.3. Rest of South America
-
3. Europe
- 3.1. United Kingdom
- 3.2. Germany
- 3.3. France
- 3.4. Italy
- 3.5. Spain
- 3.6. Russia
- 3.7. Benelux
- 3.8. Nordics
- 3.9. Rest of Europe
-
4. Middle East & Africa
- 4.1. Turkey
- 4.2. Israel
- 4.3. GCC
- 4.4. North Africa
- 4.5. South Africa
- 4.6. Rest of Middle East & Africa
-
5. Asia Pacific
- 5.1. China
- 5.2. India
- 5.3. Japan
- 5.4. South Korea
- 5.5. ASEAN
- 5.6. Oceania
- 5.7. Rest of Asia Pacific
Air Pollution Control Services Regional Market Share
Geographic Coverage of Air Pollution Control Services
Air Pollution Control Services REPORT HIGHLIGHTS
| Aspects | Details |
|---|---|
| Study Period | 2020-2034 |
| Base Year | 2025 |
| Estimated Year | 2026 |
| Forecast Period | 2026-2034 |
| Historical Period | 2020-2025 |
| Growth Rate | CAGR of XX% from 2020-2034 |
| Segmentation |
|
Table of Contents
- 1. Introduction
- 1.1. Research Scope
- 1.2. Market Segmentation
- 1.3. Research Methodology
- 1.4. Definitions and Assumptions
- 2. Executive Summary
- 2.1. Introduction
- 3. Market Dynamics
- 3.1. Introduction
- 3.2. Market Drivers
- 3.3. Market Restrains
- 3.4. Market Trends
- 4. Market Factor Analysis
- 4.1. Porters Five Forces
- 4.2. Supply/Value Chain
- 4.3. PESTEL analysis
- 4.4. Market Entropy
- 4.5. Patent/Trademark Analysis
- 5. Global Air Pollution Control Services Analysis, Insights and Forecast, 2020-2032
- 5.1. Market Analysis, Insights and Forecast - by Application
- 5.1.1. Industrial
- 5.1.2. Residential
- 5.1.3. Commercial
- 5.2. Market Analysis, Insights and Forecast - by Types
- 5.2.1. Air Quality Monitoring
- 5.2.2. Indoor Air Quality Improvement
- 5.2.3. Stack Emission Monitoring
- 5.2.4. Others
- 5.3. Market Analysis, Insights and Forecast - by Region
- 5.3.1. North America
- 5.3.2. South America
- 5.3.3. Europe
- 5.3.4. Middle East & Africa
- 5.3.5. Asia Pacific
- 5.1. Market Analysis, Insights and Forecast - by Application
- 6. North America Air Pollution Control Services Analysis, Insights and Forecast, 2020-2032
- 6.1. Market Analysis, Insights and Forecast - by Application
- 6.1.1. Industrial
- 6.1.2. Residential
- 6.1.3. Commercial
- 6.2. Market Analysis, Insights and Forecast - by Types
- 6.2.1. Air Quality Monitoring
- 6.2.2. Indoor Air Quality Improvement
- 6.2.3. Stack Emission Monitoring
- 6.2.4. Others
- 6.1. Market Analysis, Insights and Forecast - by Application
- 7. South America Air Pollution Control Services Analysis, Insights and Forecast, 2020-2032
- 7.1. Market Analysis, Insights and Forecast - by Application
- 7.1.1. Industrial
- 7.1.2. Residential
- 7.1.3. Commercial
- 7.2. Market Analysis, Insights and Forecast - by Types
- 7.2.1. Air Quality Monitoring
- 7.2.2. Indoor Air Quality Improvement
- 7.2.3. Stack Emission Monitoring
- 7.2.4. Others
- 7.1. Market Analysis, Insights and Forecast - by Application
- 8. Europe Air Pollution Control Services Analysis, Insights and Forecast, 2020-2032
- 8.1. Market Analysis, Insights and Forecast - by Application
- 8.1.1. Industrial
- 8.1.2. Residential
- 8.1.3. Commercial
- 8.2. Market Analysis, Insights and Forecast - by Types
- 8.2.1. Air Quality Monitoring
- 8.2.2. Indoor Air Quality Improvement
- 8.2.3. Stack Emission Monitoring
- 8.2.4. Others
- 8.1. Market Analysis, Insights and Forecast - by Application
- 9. Middle East & Africa Air Pollution Control Services Analysis, Insights and Forecast, 2020-2032
- 9.1. Market Analysis, Insights and Forecast - by Application
- 9.1.1. Industrial
- 9.1.2. Residential
- 9.1.3. Commercial
- 9.2. Market Analysis, Insights and Forecast - by Types
- 9.2.1. Air Quality Monitoring
- 9.2.2. Indoor Air Quality Improvement
- 9.2.3. Stack Emission Monitoring
- 9.2.4. Others
- 9.1. Market Analysis, Insights and Forecast - by Application
- 10. Asia Pacific Air Pollution Control Services Analysis, Insights and Forecast, 2020-2032
- 10.1. Market Analysis, Insights and Forecast - by Application
- 10.1.1. Industrial
- 10.1.2. Residential
- 10.1.3. Commercial
- 10.2. Market Analysis, Insights and Forecast - by Types
- 10.2.1. Air Quality Monitoring
- 10.2.2. Indoor Air Quality Improvement
- 10.2.3. Stack Emission Monitoring
- 10.2.4. Others
- 10.1. Market Analysis, Insights and Forecast - by Application
- 11. Competitive Analysis
- 11.1. Global Market Share Analysis 2025
- 11.2. Company Profiles
- 11.2.1 Envitech
- 11.2.1.1. Overview
- 11.2.1.2. Products
- 11.2.1.3. SWOT Analysis
- 11.2.1.4. Recent Developments
- 11.2.1.5. Financials (Based on Availability)
- 11.2.2 McDermott
- 11.2.2.1. Overview
- 11.2.2.2. Products
- 11.2.2.3. SWOT Analysis
- 11.2.2.4. Recent Developments
- 11.2.2.5. Financials (Based on Availability)
- 11.2.3 GE Steam Power
- 11.2.3.1. Overview
- 11.2.3.2. Products
- 11.2.3.3. SWOT Analysis
- 11.2.3.4. Recent Developments
- 11.2.3.5. Financials (Based on Availability)
- 11.2.4 Go Green Mechanisms Pvt. Ltd.
- 11.2.4.1. Overview
- 11.2.4.2. Products
- 11.2.4.3. SWOT Analysis
- 11.2.4.4. Recent Developments
- 11.2.4.5. Financials (Based on Availability)
- 11.2.5 WHEE
- 11.2.5.1. Overview
- 11.2.5.2. Products
- 11.2.5.3. SWOT Analysis
- 11.2.5.4. Recent Developments
- 11.2.5.5. Financials (Based on Availability)
- 11.2.6 Thermax Group
- 11.2.6.1. Overview
- 11.2.6.2. Products
- 11.2.6.3. SWOT Analysis
- 11.2.6.4. Recent Developments
- 11.2.6.5. Financials (Based on Availability)
- 11.2.7 Monroe Environmental
- 11.2.7.1. Overview
- 11.2.7.2. Products
- 11.2.7.3. SWOT Analysis
- 11.2.7.4. Recent Developments
- 11.2.7.5. Financials (Based on Availability)
- 11.2.8 Anguil
- 11.2.8.1. Overview
- 11.2.8.2. Products
- 11.2.8.3. SWOT Analysis
- 11.2.8.4. Recent Developments
- 11.2.8.5. Financials (Based on Availability)
- 11.2.9 Dürr Megtec
- 11.2.9.1. Overview
- 11.2.9.2. Products
- 11.2.9.3. SWOT Analysis
- 11.2.9.4. Recent Developments
- 11.2.9.5. Financials (Based on Availability)
- 11.2.10 Intellishare Environmental
- 11.2.10.1. Overview
- 11.2.10.2. Products
- 11.2.10.3. SWOT Analysis
- 11.2.10.4. Recent Developments
- 11.2.10.5. Financials (Based on Availability)
- 11.2.11 Kono Kogs
- 11.2.11.1. Overview
- 11.2.11.2. Products
- 11.2.11.3. SWOT Analysis
- 11.2.11.4. Recent Developments
- 11.2.11.5. Financials (Based on Availability)
- 11.2.12 Air Applications
- 11.2.12.1. Overview
- 11.2.12.2. Products
- 11.2.12.3. SWOT Analysis
- 11.2.12.4. Recent Developments
- 11.2.12.5. Financials (Based on Availability)
- 11.2.13 Advanced Air Technologies Inc.
- 11.2.13.1. Overview
- 11.2.13.2. Products
- 11.2.13.3. SWOT Analysis
- 11.2.13.4. Recent Developments
- 11.2.13.5. Financials (Based on Availability)
- 11.2.14 ACFM Corp
- 11.2.14.1. Overview
- 11.2.14.2. Products
- 11.2.14.3. SWOT Analysis
- 11.2.14.4. Recent Developments
- 11.2.14.5. Financials (Based on Availability)
- 11.2.15 Air Chem Systems
- 11.2.15.1. Overview
- 11.2.15.2. Products
- 11.2.15.3. SWOT Analysis
- 11.2.15.4. Recent Developments
- 11.2.15.5. Financials (Based on Availability)
- 11.2.16 Inc.
- 11.2.16.1. Overview
- 11.2.16.2. Products
- 11.2.16.3. SWOT Analysis
- 11.2.16.4. Recent Developments
- 11.2.16.5. Financials (Based on Availability)
- 11.2.17 Air Quality Engineering
- 11.2.17.1. Overview
- 11.2.17.2. Products
- 11.2.17.3. SWOT Analysis
- 11.2.17.4. Recent Developments
- 11.2.17.5. Financials (Based on Availability)
- 11.2.18 Air Separation Technologies
- 11.2.18.1. Overview
- 11.2.18.2. Products
- 11.2.18.3. SWOT Analysis
- 11.2.18.4. Recent Developments
- 11.2.18.5. Financials (Based on Availability)
- 11.2.19 Inc.
- 11.2.19.1. Overview
- 11.2.19.2. Products
- 11.2.19.3. SWOT Analysis
- 11.2.19.4. Recent Developments
- 11.2.19.5. Financials (Based on Availability)
- 11.2.1 Envitech
List of Figures
- Figure 1: Global Air Pollution Control Services Revenue Breakdown (million, %) by Region 2025 & 2033
- Figure 2: North America Air Pollution Control Services Revenue (million), by Application 2025 & 2033
- Figure 3: North America Air Pollution Control Services Revenue Share (%), by Application 2025 & 2033
- Figure 4: North America Air Pollution Control Services Revenue (million), by Types 2025 & 2033
- Figure 5: North America Air Pollution Control Services Revenue Share (%), by Types 2025 & 2033
- Figure 6: North America Air Pollution Control Services Revenue (million), by Country 2025 & 2033
- Figure 7: North America Air Pollution Control Services Revenue Share (%), by Country 2025 & 2033
- Figure 8: South America Air Pollution Control Services Revenue (million), by Application 2025 & 2033
- Figure 9: South America Air Pollution Control Services Revenue Share (%), by Application 2025 & 2033
- Figure 10: South America Air Pollution Control Services Revenue (million), by Types 2025 & 2033
- Figure 11: South America Air Pollution Control Services Revenue Share (%), by Types 2025 & 2033
- Figure 12: South America Air Pollution Control Services Revenue (million), by Country 2025 & 2033
- Figure 13: South America Air Pollution Control Services Revenue Share (%), by Country 2025 & 2033
- Figure 14: Europe Air Pollution Control Services Revenue (million), by Application 2025 & 2033
- Figure 15: Europe Air Pollution Control Services Revenue Share (%), by Application 2025 & 2033
- Figure 16: Europe Air Pollution Control Services Revenue (million), by Types 2025 & 2033
- Figure 17: Europe Air Pollution Control Services Revenue Share (%), by Types 2025 & 2033
- Figure 18: Europe Air Pollution Control Services Revenue (million), by Country 2025 & 2033
- Figure 19: Europe Air Pollution Control Services Revenue Share (%), by Country 2025 & 2033
- Figure 20: Middle East & Africa Air Pollution Control Services Revenue (million), by Application 2025 & 2033
- Figure 21: Middle East & Africa Air Pollution Control Services Revenue Share (%), by Application 2025 & 2033
- Figure 22: Middle East & Africa Air Pollution Control Services Revenue (million), by Types 2025 & 2033
- Figure 23: Middle East & Africa Air Pollution Control Services Revenue Share (%), by Types 2025 & 2033
- Figure 24: Middle East & Africa Air Pollution Control Services Revenue (million), by Country 2025 & 2033
- Figure 25: Middle East & Africa Air Pollution Control Services Revenue Share (%), by Country 2025 & 2033
- Figure 26: Asia Pacific Air Pollution Control Services Revenue (million), by Application 2025 & 2033
- Figure 27: Asia Pacific Air Pollution Control Services Revenue Share (%), by Application 2025 & 2033
- Figure 28: Asia Pacific Air Pollution Control Services Revenue (million), by Types 2025 & 2033
- Figure 29: Asia Pacific Air Pollution Control Services Revenue Share (%), by Types 2025 & 2033
- Figure 30: Asia Pacific Air Pollution Control Services Revenue (million), by Country 2025 & 2033
- Figure 31: Asia Pacific Air Pollution Control Services Revenue Share (%), by Country 2025 & 2033
List of Tables
- Table 1: Global Air Pollution Control Services Revenue million Forecast, by Application 2020 & 2033
- Table 2: Global Air Pollution Control Services Revenue million Forecast, by Types 2020 & 2033
- Table 3: Global Air Pollution Control Services Revenue million Forecast, by Region 2020 & 2033
- Table 4: Global Air Pollution Control Services Revenue million Forecast, by Application 2020 & 2033
- Table 5: Global Air Pollution Control Services Revenue million Forecast, by Types 2020 & 2033
- Table 6: Global Air Pollution Control Services Revenue million Forecast, by Country 2020 & 2033
- Table 7: United States Air Pollution Control Services Revenue (million) Forecast, by Application 2020 & 2033
- Table 8: Canada Air Pollution Control Services Revenue (million) Forecast, by Application 2020 & 2033
- Table 9: Mexico Air Pollution Control Services Revenue (million) Forecast, by Application 2020 & 2033
- Table 10: Global Air Pollution Control Services Revenue million Forecast, by Application 2020 & 2033
- Table 11: Global Air Pollution Control Services Revenue million Forecast, by Types 2020 & 2033
- Table 12: Global Air Pollution Control Services Revenue million Forecast, by Country 2020 & 2033
- Table 13: Brazil Air Pollution Control Services Revenue (million) Forecast, by Application 2020 & 2033
- Table 14: Argentina Air Pollution Control Services Revenue (million) Forecast, by Application 2020 & 2033
- Table 15: Rest of South America Air Pollution Control Services Revenue (million) Forecast, by Application 2020 & 2033
- Table 16: Global Air Pollution Control Services Revenue million Forecast, by Application 2020 & 2033
- Table 17: Global Air Pollution Control Services Revenue million Forecast, by Types 2020 & 2033
- Table 18: Global Air Pollution Control Services Revenue million Forecast, by Country 2020 & 2033
- Table 19: United Kingdom Air Pollution Control Services Revenue (million) Forecast, by Application 2020 & 2033
- Table 20: Germany Air Pollution Control Services Revenue (million) Forecast, by Application 2020 & 2033
- Table 21: France Air Pollution Control Services Revenue (million) Forecast, by Application 2020 & 2033
- Table 22: Italy Air Pollution Control Services Revenue (million) Forecast, by Application 2020 & 2033
- Table 23: Spain Air Pollution Control Services Revenue (million) Forecast, by Application 2020 & 2033
- Table 24: Russia Air Pollution Control Services Revenue (million) Forecast, by Application 2020 & 2033
- Table 25: Benelux Air Pollution Control Services Revenue (million) Forecast, by Application 2020 & 2033
- Table 26: Nordics Air Pollution Control Services Revenue (million) Forecast, by Application 2020 & 2033
- Table 27: Rest of Europe Air Pollution Control Services Revenue (million) Forecast, by Application 2020 & 2033
- Table 28: Global Air Pollution Control Services Revenue million Forecast, by Application 2020 & 2033
- Table 29: Global Air Pollution Control Services Revenue million Forecast, by Types 2020 & 2033
- Table 30: Global Air Pollution Control Services Revenue million Forecast, by Country 2020 & 2033
- Table 31: Turkey Air Pollution Control Services Revenue (million) Forecast, by Application 2020 & 2033
- Table 32: Israel Air Pollution Control Services Revenue (million) Forecast, by Application 2020 & 2033
- Table 33: GCC Air Pollution Control Services Revenue (million) Forecast, by Application 2020 & 2033
- Table 34: North Africa Air Pollution Control Services Revenue (million) Forecast, by Application 2020 & 2033
- Table 35: South Africa Air Pollution Control Services Revenue (million) Forecast, by Application 2020 & 2033
- Table 36: Rest of Middle East & Africa Air Pollution Control Services Revenue (million) Forecast, by Application 2020 & 2033
- Table 37: Global Air Pollution Control Services Revenue million Forecast, by Application 2020 & 2033
- Table 38: Global Air Pollution Control Services Revenue million Forecast, by Types 2020 & 2033
- Table 39: Global Air Pollution Control Services Revenue million Forecast, by Country 2020 & 2033
- Table 40: China Air Pollution Control Services Revenue (million) Forecast, by Application 2020 & 2033
- Table 41: India Air Pollution Control Services Revenue (million) Forecast, by Application 2020 & 2033
- Table 42: Japan Air Pollution Control Services Revenue (million) Forecast, by Application 2020 & 2033
- Table 43: South Korea Air Pollution Control Services Revenue (million) Forecast, by Application 2020 & 2033
- Table 44: ASEAN Air Pollution Control Services Revenue (million) Forecast, by Application 2020 & 2033
- Table 45: Oceania Air Pollution Control Services Revenue (million) Forecast, by Application 2020 & 2033
- Table 46: Rest of Asia Pacific Air Pollution Control Services Revenue (million) Forecast, by Application 2020 & 2033
Frequently Asked Questions
1. What is the projected Compound Annual Growth Rate (CAGR) of the Air Pollution Control Services?
The projected CAGR is approximately XX%.
2. Which companies are prominent players in the Air Pollution Control Services?
Key companies in the market include Envitech, McDermott, GE Steam Power, Go Green Mechanisms Pvt. Ltd., WHEE, Thermax Group, Monroe Environmental, Anguil, Dürr Megtec, Intellishare Environmental, Kono Kogs, Air Applications, Advanced Air Technologies Inc., ACFM Corp, Air Chem Systems, Inc., Air Quality Engineering, Air Separation Technologies, Inc..
3. What are the main segments of the Air Pollution Control Services?
The market segments include Application, Types.
4. Can you provide details about the market size?
The market size is estimated to be USD XXX million as of 2022.
5. What are some drivers contributing to market growth?
N/A
6. What are the notable trends driving market growth?
N/A
7. Are there any restraints impacting market growth?
N/A
8. Can you provide examples of recent developments in the market?
N/A
9. What pricing options are available for accessing the report?
Pricing options include single-user, multi-user, and enterprise licenses priced at USD 3350.00, USD 5025.00, and USD 6700.00 respectively.
10. Is the market size provided in terms of value or volume?
The market size is provided in terms of value, measured in million.
11. Are there any specific market keywords associated with the report?
Yes, the market keyword associated with the report is "Air Pollution Control Services," which aids in identifying and referencing the specific market segment covered.
12. How do I determine which pricing option suits my needs best?
The pricing options vary based on user requirements and access needs. Individual users may opt for single-user licenses, while businesses requiring broader access may choose multi-user or enterprise licenses for cost-effective access to the report.
13. Are there any additional resources or data provided in the Air Pollution Control Services report?
While the report offers comprehensive insights, it's advisable to review the specific contents or supplementary materials provided to ascertain if additional resources or data are available.
14. How can I stay updated on further developments or reports in the Air Pollution Control Services?
To stay informed about further developments, trends, and reports in the Air Pollution Control Services, consider subscribing to industry newsletters, following relevant companies and organizations, or regularly checking reputable industry news sources and publications.
Methodology
Step 1 - Identification of Relevant Samples Size from Population Database


Step 2 - Approaches for Defining Global Market Size (Value, Volume* & Price*)

Note*: In applicable scenarios
Step 3 - Data Sources
Primary Research
- Web Analytics
- Survey Reports
- Research Institute
- Latest Research Reports
- Opinion Leaders
Secondary Research
- Annual Reports
- White Paper
- Latest Press Release
- Industry Association
- Paid Database
- Investor Presentations

Step 4 - Data Triangulation
Involves using different sources of information in order to increase the validity of a study
These sources are likely to be stakeholders in a program - participants, other researchers, program staff, other community members, and so on.
Then we put all data in single framework & apply various statistical tools to find out the dynamic on the market.
During the analysis stage, feedback from the stakeholder groups would be compared to determine areas of agreement as well as areas of divergence