

Key Insights
The Augmented Reality (AR) and Virtual Reality (VR) smart glasses market is experiencing robust growth, projected to reach a substantial market size. While the provided data states a 2025 market value of $22,660 million and a Compound Annual Growth Rate (CAGR) of 7.4%, a more detailed analysis reveals a dynamic landscape shaped by several key factors. The market's expansion is driven by increasing consumer demand for immersive experiences in gaming, entertainment, and social interaction. Advancements in display technology, miniaturization of components, and improved battery life are continuously enhancing the user experience, fueling adoption across various sectors. Furthermore, the integration of AR/VR smart glasses into enterprise applications, particularly in training, design, and remote assistance, is a significant growth driver. This adoption is further spurred by the falling cost of manufacturing and the increasing availability of high-quality content optimized for AR/VR devices. Companies such as Epson, Microsoft, and others are heavily investing in R&D to improve functionality and expand applications, ensuring continuous market innovation.
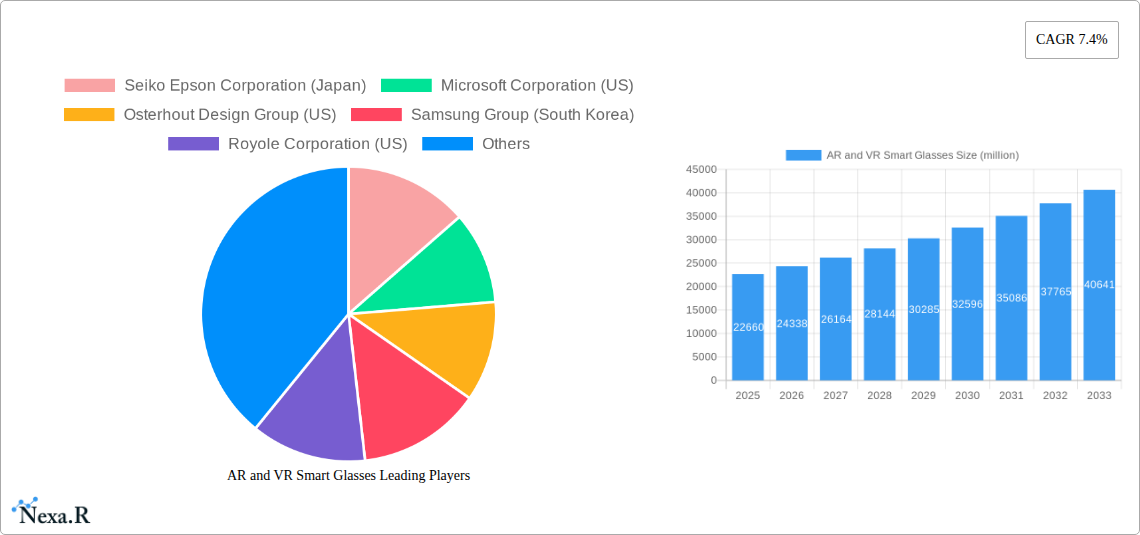
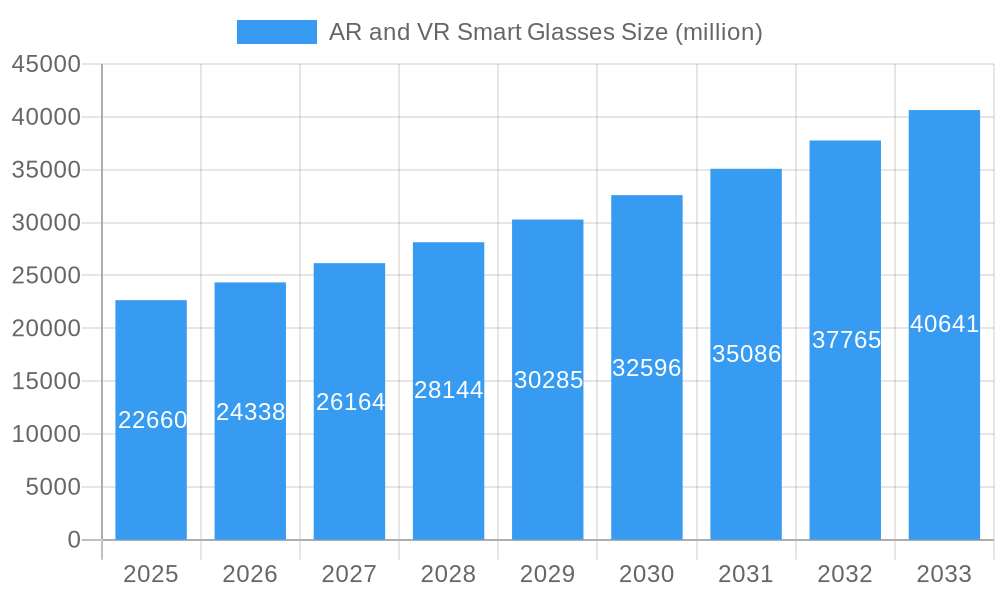
AR and VR Smart Glasses Market Size (In Billion)
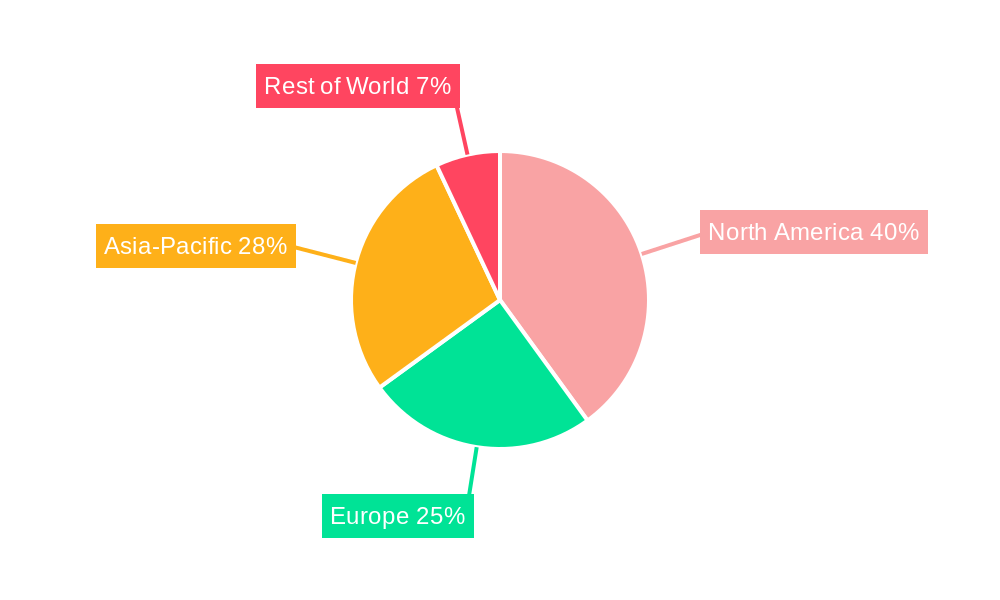
However, challenges remain. High initial costs, limited battery life in some models, and concerns about potential health effects (e.g., eye strain) are acting as restraints. The market is also segmented by device type (e.g., tethered vs. standalone), application (e.g., consumer vs. enterprise), and geographical region. North America and Asia-Pacific are currently leading in market share, driven by early adoption and strong technological innovation. However, Europe and other regions are expected to witness significant growth in the coming years as the technology matures and becomes more affordable. The forecast period of 2025-2033 suggests continued expansion, with the market likely exceeding $40 billion by 2033 based on the projected CAGR. The competition among numerous established players and emerging startups will ensure further technological advancements and a more diverse range of products and applications.
AR and VR Smart Glasses Company Market Share
AR and VR Smart Glasses Market Report: 2019-2033
This comprehensive report provides an in-depth analysis of the AR and VR smart glasses market, encompassing market dynamics, growth trends, regional dominance, product landscape, challenges, opportunities, and key players. The study period covers 2019-2033, with a base year of 2025 and a forecast period of 2025-2033. The report leverages extensive primary and secondary research to deliver actionable insights for industry professionals, investors, and strategic decision-makers. Parent markets include wearable technology and the broader consumer electronics sector, with the child market specifically focusing on augmented and virtual reality smart glasses. The predicted global market size in 2025 is estimated at xx million units.
AR and VR Smart Glasses Market Dynamics & Structure
The AR/VR smart glasses market is characterized by a moderately fragmented landscape, with several key players competing based on technological innovation, product features, and pricing strategies. Market concentration is relatively low, with no single company commanding a significant majority share. Technological innovation is a key driver, with ongoing advancements in display technology, processing power, battery life, and user interface significantly impacting market growth. Regulatory frameworks, particularly concerning data privacy and safety standards, are increasingly important. Competitive substitutes include traditional eyewear and other wearable devices offering similar functionalities. The end-user demographic is expanding, encompassing professionals in various industries (healthcare, manufacturing, etc.), consumers seeking entertainment and immersive experiences, and enterprise customers deploying AR/VR solutions. M&A activity within the sector has been moderate, with xx deals recorded between 2019 and 2024.
- Market Concentration: Low to moderate, with no dominant player.
- Innovation Drivers: Advancements in display technology (MicroOLED), processing power, battery technology (Imprint Energy, FlexEl), and AI-powered features.
- Regulatory Framework: Increasing focus on data privacy and safety regulations, impacting product development and adoption.
- Competitive Substitutes: Traditional eyewear, smartphones, and other wearables.
- End-User Demographics: Expanding to include professionals, consumers, and enterprise clients.
- M&A Trends: Moderate activity, with approximately xx deals completed between 2019 and 2024, representing a combined value of xx million USD. (Further breakdown available in the full report).
AR and VR Smart Glasses Growth Trends & Insights
The AR/VR smart glasses market is experiencing significant growth, driven by increasing consumer demand, technological advancements, and wider adoption across various sectors. The market size has shown a substantial increase from xx million units in 2019 to xx million units in 2024. We project a Compound Annual Growth Rate (CAGR) of xx% during the forecast period (2025-2033), reaching an estimated xx million units by 2033. This growth is fueled by factors such as decreasing costs, improved device ergonomics, and the expanding range of applications. Technological disruptions, including advancements in 5G connectivity and improved AR/VR software, are accelerating adoption rates. Consumer behavior shifts toward experiences over material possessions further boost market growth. Market penetration is expected to rise from xx% in 2024 to xx% by 2033. The report delves deeper into the specifics of these growth factors, providing further granularity.
Dominant Regions, Countries, or Segments in AR and VR Smart Glasses
North America currently holds a significant market share in AR/VR smart glasses, driven by strong technological innovation, high consumer spending, and early adoption by businesses. However, the Asia-Pacific region is projected to exhibit the highest growth rate during the forecast period due to rapid economic growth, expanding consumer base, and increasing investment in infrastructure for AR/VR technologies. Specific countries like the US, China, Japan, and South Korea are key players.
- North America: High market share, driven by early adoption and strong technological development.
- Asia-Pacific: Highest growth rate, fueled by rapid economic expansion and increasing consumer base.
- Europe: Steady growth, driven by increasing adoption in specific sectors like healthcare and manufacturing.
- Key Drivers: Government initiatives promoting technological advancements, investments in 5G infrastructure, and consumer preferences for immersive experiences.
AR and VR Smart Glasses Product Landscape
AR/VR smart glasses are rapidly evolving, with innovations focusing on lighter weight, improved display quality, longer battery life, and enhanced user interaction. Features such as voice control, gesture recognition, and integrated cameras are becoming standard. Applications range from gaming and entertainment to industrial applications (maintenance, training) and healthcare (surgery assistance, diagnostics). Key performance metrics include field of view (FOV), resolution, latency, and battery duration. Unique selling propositions center around specific use cases (e.g., hands-free functionality for industrial workers) and advanced features like eye-tracking or haptic feedback.
Key Drivers, Barriers & Challenges in AR and VR Smart Glasses
Key Drivers: Technological advancements (miniaturization, improved display technology), increasing demand from various industries (manufacturing, healthcare, logistics), growing consumer interest in immersive experiences, and government support for AR/VR research and development.
Key Barriers & Challenges: High manufacturing costs, limited battery life, discomfort during extended use, data privacy concerns, and the need for robust content ecosystems. The supply chain for key components can also be unstable, leading to production delays. Regulatory hurdles in some countries further complicate market entry.
Emerging Opportunities in AR and VR Smart Glasses
The market presents significant opportunities in emerging applications within healthcare (remote diagnostics, surgical assistance), education (immersive learning experiences), and entertainment (enhanced gaming and virtual tourism). Untapped markets in developing economies represent substantial growth potential. The integration of AR/VR smart glasses with other technologies like IoT and AI is likely to create new avenues for innovation. Evolving consumer preferences towards personalized experiences will continue to fuel market growth.
Growth Accelerators in the AR and VR Smart Glasses Industry
Technological breakthroughs in micro-display technology, advancements in battery technology providing longer usage times, and the development of more intuitive user interfaces are key growth catalysts. Strategic partnerships between technology companies, content creators, and enterprises will fuel innovation and market penetration. Expansion into new markets and the creation of compelling use-case scenarios will further boost market adoption.
Key Players Shaping the AR and VR Smart Glasses Market
- Seiko Epson Corporation
- Microsoft Corporation
- Osterhout Design Group
- Samsung Group
- Royole Corporation
- Optinvent
- MicroOLED
- Ricoh
- Kopin Corporation
- Imprint Energy
- FlexEl
- Sony Corporation
- HTC Corporation
- Razer Inc.
- Avegant
- Google Inc.
- Oculus VR
- Vuzix
- Jenax
- Atheer
Notable Milestones in AR and VR Smart Glasses Sector
- 2020: Several companies announced new AR/VR smart glasses prototypes.
- 2021: Significant advancements in micro-display technology led to improvements in resolution and FOV.
- 2022: Increased investment in AR/VR smart glasses development from major tech companies.
- 2023: Launch of several commercially available AR/VR smart glasses models with improved performance.
- 2024: Several strategic partnerships formed between technology companies and enterprises to develop and deploy AR/VR solutions. (Specific examples and dates will be detailed in the full report)
In-Depth AR and VR Smart Glasses Market Outlook
The AR/VR smart glasses market is poised for sustained growth, driven by continuous technological advancements and expanding applications. Strategic partnerships, increasing investments in R&D, and the growing demand from diverse sectors will fuel this expansion. The market is expected to witness significant consolidation as key players seek to establish dominance through innovation and strategic acquisitions. Opportunities lie in exploring new applications, expanding into new markets, and creating a more robust ecosystem of content and applications to further drive adoption.
AR and VR Smart Glasses Segmentation
-
1. Application
- 1.1. Gaming
- 1.2. Education
- 1.3. Military
- 1.4. Industrial
- 1.5. Commercial
- 1.6. Others
-
2. Types
- 2.1. Mobile Phone Smart Glasses
- 2.2. Integrated Smart Glasses
- 2.3. External Smart Glasses
- 2.4. Others
AR and VR Smart Glasses Segmentation By Geography
-
1. North America
- 1.1. United States
- 1.2. Canada
- 1.3. Mexico
-
2. South America
- 2.1. Brazil
- 2.2. Argentina
- 2.3. Rest of South America
-
3. Europe
- 3.1. United Kingdom
- 3.2. Germany
- 3.3. France
- 3.4. Italy
- 3.5. Spain
- 3.6. Russia
- 3.7. Benelux
- 3.8. Nordics
- 3.9. Rest of Europe
-
4. Middle East & Africa
- 4.1. Turkey
- 4.2. Israel
- 4.3. GCC
- 4.4. North Africa
- 4.5. South Africa
- 4.6. Rest of Middle East & Africa
-
5. Asia Pacific
- 5.1. China
- 5.2. India
- 5.3. Japan
- 5.4. South Korea
- 5.5. ASEAN
- 5.6. Oceania
- 5.7. Rest of Asia Pacific
AR and VR Smart Glasses Regional Market Share
Geographic Coverage of AR and VR Smart Glasses
AR and VR Smart Glasses REPORT HIGHLIGHTS
| Aspects | Details |
|---|---|
| Study Period | 2020-2034 |
| Base Year | 2025 |
| Estimated Year | 2026 |
| Forecast Period | 2026-2034 |
| Historical Period | 2020-2025 |
| Growth Rate | CAGR of 7.4% from 2020-2034 |
| Segmentation |
|
Table of Contents
- 1. Introduction
- 1.1. Research Scope
- 1.2. Market Segmentation
- 1.3. Research Methodology
- 1.4. Definitions and Assumptions
- 2. Executive Summary
- 2.1. Introduction
- 3. Market Dynamics
- 3.1. Introduction
- 3.2. Market Drivers
- 3.3. Market Restrains
- 3.4. Market Trends
- 4. Market Factor Analysis
- 4.1. Porters Five Forces
- 4.2. Supply/Value Chain
- 4.3. PESTEL analysis
- 4.4. Market Entropy
- 4.5. Patent/Trademark Analysis
- 5. Global AR and VR Smart Glasses Analysis, Insights and Forecast, 2020-2032
- 5.1. Market Analysis, Insights and Forecast - by Application
- 5.1.1. Gaming
- 5.1.2. Education
- 5.1.3. Military
- 5.1.4. Industrial
- 5.1.5. Commercial
- 5.1.6. Others
- 5.2. Market Analysis, Insights and Forecast - by Types
- 5.2.1. Mobile Phone Smart Glasses
- 5.2.2. Integrated Smart Glasses
- 5.2.3. External Smart Glasses
- 5.2.4. Others
- 5.3. Market Analysis, Insights and Forecast - by Region
- 5.3.1. North America
- 5.3.2. South America
- 5.3.3. Europe
- 5.3.4. Middle East & Africa
- 5.3.5. Asia Pacific
- 5.1. Market Analysis, Insights and Forecast - by Application
- 6. North America AR and VR Smart Glasses Analysis, Insights and Forecast, 2020-2032
- 6.1. Market Analysis, Insights and Forecast - by Application
- 6.1.1. Gaming
- 6.1.2. Education
- 6.1.3. Military
- 6.1.4. Industrial
- 6.1.5. Commercial
- 6.1.6. Others
- 6.2. Market Analysis, Insights and Forecast - by Types
- 6.2.1. Mobile Phone Smart Glasses
- 6.2.2. Integrated Smart Glasses
- 6.2.3. External Smart Glasses
- 6.2.4. Others
- 6.1. Market Analysis, Insights and Forecast - by Application
- 7. South America AR and VR Smart Glasses Analysis, Insights and Forecast, 2020-2032
- 7.1. Market Analysis, Insights and Forecast - by Application
- 7.1.1. Gaming
- 7.1.2. Education
- 7.1.3. Military
- 7.1.4. Industrial
- 7.1.5. Commercial
- 7.1.6. Others
- 7.2. Market Analysis, Insights and Forecast - by Types
- 7.2.1. Mobile Phone Smart Glasses
- 7.2.2. Integrated Smart Glasses
- 7.2.3. External Smart Glasses
- 7.2.4. Others
- 7.1. Market Analysis, Insights and Forecast - by Application
- 8. Europe AR and VR Smart Glasses Analysis, Insights and Forecast, 2020-2032
- 8.1. Market Analysis, Insights and Forecast - by Application
- 8.1.1. Gaming
- 8.1.2. Education
- 8.1.3. Military
- 8.1.4. Industrial
- 8.1.5. Commercial
- 8.1.6. Others
- 8.2. Market Analysis, Insights and Forecast - by Types
- 8.2.1. Mobile Phone Smart Glasses
- 8.2.2. Integrated Smart Glasses
- 8.2.3. External Smart Glasses
- 8.2.4. Others
- 8.1. Market Analysis, Insights and Forecast - by Application
- 9. Middle East & Africa AR and VR Smart Glasses Analysis, Insights and Forecast, 2020-2032
- 9.1. Market Analysis, Insights and Forecast - by Application
- 9.1.1. Gaming
- 9.1.2. Education
- 9.1.3. Military
- 9.1.4. Industrial
- 9.1.5. Commercial
- 9.1.6. Others
- 9.2. Market Analysis, Insights and Forecast - by Types
- 9.2.1. Mobile Phone Smart Glasses
- 9.2.2. Integrated Smart Glasses
- 9.2.3. External Smart Glasses
- 9.2.4. Others
- 9.1. Market Analysis, Insights and Forecast - by Application
- 10. Asia Pacific AR and VR Smart Glasses Analysis, Insights and Forecast, 2020-2032
- 10.1. Market Analysis, Insights and Forecast - by Application
- 10.1.1. Gaming
- 10.1.2. Education
- 10.1.3. Military
- 10.1.4. Industrial
- 10.1.5. Commercial
- 10.1.6. Others
- 10.2. Market Analysis, Insights and Forecast - by Types
- 10.2.1. Mobile Phone Smart Glasses
- 10.2.2. Integrated Smart Glasses
- 10.2.3. External Smart Glasses
- 10.2.4. Others
- 10.1. Market Analysis, Insights and Forecast - by Application
- 11. Competitive Analysis
- 11.1. Global Market Share Analysis 2025
- 11.2. Company Profiles
- 11.2.1 Seiko Epson Corporation (Japan)
- 11.2.1.1. Overview
- 11.2.1.2. Products
- 11.2.1.3. SWOT Analysis
- 11.2.1.4. Recent Developments
- 11.2.1.5. Financials (Based on Availability)
- 11.2.2 Microsoft Corporation (US)
- 11.2.2.1. Overview
- 11.2.2.2. Products
- 11.2.2.3. SWOT Analysis
- 11.2.2.4. Recent Developments
- 11.2.2.5. Financials (Based on Availability)
- 11.2.3 Osterhout Design Group (US)
- 11.2.3.1. Overview
- 11.2.3.2. Products
- 11.2.3.3. SWOT Analysis
- 11.2.3.4. Recent Developments
- 11.2.3.5. Financials (Based on Availability)
- 11.2.4 Samsung Group (South Korea)
- 11.2.4.1. Overview
- 11.2.4.2. Products
- 11.2.4.3. SWOT Analysis
- 11.2.4.4. Recent Developments
- 11.2.4.5. Financials (Based on Availability)
- 11.2.5 Royole Corporation (US)
- 11.2.5.1. Overview
- 11.2.5.2. Products
- 11.2.5.3. SWOT Analysis
- 11.2.5.4. Recent Developments
- 11.2.5.5. Financials (Based on Availability)
- 11.2.6 Optinvent (France)
- 11.2.6.1. Overview
- 11.2.6.2. Products
- 11.2.6.3. SWOT Analysis
- 11.2.6.4. Recent Developments
- 11.2.6.5. Financials (Based on Availability)
- 11.2.7 MicroOLED (France)
- 11.2.7.1. Overview
- 11.2.7.2. Products
- 11.2.7.3. SWOT Analysis
- 11.2.7.4. Recent Developments
- 11.2.7.5. Financials (Based on Availability)
- 11.2.8 Ricoh (Japan)
- 11.2.8.1. Overview
- 11.2.8.2. Products
- 11.2.8.3. SWOT Analysis
- 11.2.8.4. Recent Developments
- 11.2.8.5. Financials (Based on Availability)
- 11.2.9 Kopin Corporation (US)
- 11.2.9.1. Overview
- 11.2.9.2. Products
- 11.2.9.3. SWOT Analysis
- 11.2.9.4. Recent Developments
- 11.2.9.5. Financials (Based on Availability)
- 11.2.10 Imprint Energy (US)
- 11.2.10.1. Overview
- 11.2.10.2. Products
- 11.2.10.3. SWOT Analysis
- 11.2.10.4. Recent Developments
- 11.2.10.5. Financials (Based on Availability)
- 11.2.11 FlexEl
- 11.2.11.1. Overview
- 11.2.11.2. Products
- 11.2.11.3. SWOT Analysis
- 11.2.11.4. Recent Developments
- 11.2.11.5. Financials (Based on Availability)
- 11.2.12 (US)
- 11.2.12.1. Overview
- 11.2.12.2. Products
- 11.2.12.3. SWOT Analysis
- 11.2.12.4. Recent Developments
- 11.2.12.5. Financials (Based on Availability)
- 11.2.13 Sony Corporation (Japan)
- 11.2.13.1. Overview
- 11.2.13.2. Products
- 11.2.13.3. SWOT Analysis
- 11.2.13.4. Recent Developments
- 11.2.13.5. Financials (Based on Availability)
- 11.2.14 HTC Corporation (Taiwan)
- 11.2.14.1. Overview
- 11.2.14.2. Products
- 11.2.14.3. SWOT Analysis
- 11.2.14.4. Recent Developments
- 11.2.14.5. Financials (Based on Availability)
- 11.2.15 Razer Inc. (US)
- 11.2.15.1. Overview
- 11.2.15.2. Products
- 11.2.15.3. SWOT Analysis
- 11.2.15.4. Recent Developments
- 11.2.15.5. Financials (Based on Availability)
- 11.2.16 Avegant (US)
- 11.2.16.1. Overview
- 11.2.16.2. Products
- 11.2.16.3. SWOT Analysis
- 11.2.16.4. Recent Developments
- 11.2.16.5. Financials (Based on Availability)
- 11.2.17 Google Inc. (US)
- 11.2.17.1. Overview
- 11.2.17.2. Products
- 11.2.17.3. SWOT Analysis
- 11.2.17.4. Recent Developments
- 11.2.17.5. Financials (Based on Availability)
- 11.2.18 Oculus VR (US)
- 11.2.18.1. Overview
- 11.2.18.2. Products
- 11.2.18.3. SWOT Analysis
- 11.2.18.4. Recent Developments
- 11.2.18.5. Financials (Based on Availability)
- 11.2.19 Vuzix (US)
- 11.2.19.1. Overview
- 11.2.19.2. Products
- 11.2.19.3. SWOT Analysis
- 11.2.19.4. Recent Developments
- 11.2.19.5. Financials (Based on Availability)
- 11.2.20 Jenax (South Korea)
- 11.2.20.1. Overview
- 11.2.20.2. Products
- 11.2.20.3. SWOT Analysis
- 11.2.20.4. Recent Developments
- 11.2.20.5. Financials (Based on Availability)
- 11.2.21 Atheer (US)
- 11.2.21.1. Overview
- 11.2.21.2. Products
- 11.2.21.3. SWOT Analysis
- 11.2.21.4. Recent Developments
- 11.2.21.5. Financials (Based on Availability)
- 11.2.1 Seiko Epson Corporation (Japan)
List of Figures
- Figure 1: Global AR and VR Smart Glasses Revenue Breakdown (million, %) by Region 2025 & 2033
- Figure 2: North America AR and VR Smart Glasses Revenue (million), by Application 2025 & 2033
- Figure 3: North America AR and VR Smart Glasses Revenue Share (%), by Application 2025 & 2033
- Figure 4: North America AR and VR Smart Glasses Revenue (million), by Types 2025 & 2033
- Figure 5: North America AR and VR Smart Glasses Revenue Share (%), by Types 2025 & 2033
- Figure 6: North America AR and VR Smart Glasses Revenue (million), by Country 2025 & 2033
- Figure 7: North America AR and VR Smart Glasses Revenue Share (%), by Country 2025 & 2033
- Figure 8: South America AR and VR Smart Glasses Revenue (million), by Application 2025 & 2033
- Figure 9: South America AR and VR Smart Glasses Revenue Share (%), by Application 2025 & 2033
- Figure 10: South America AR and VR Smart Glasses Revenue (million), by Types 2025 & 2033
- Figure 11: South America AR and VR Smart Glasses Revenue Share (%), by Types 2025 & 2033
- Figure 12: South America AR and VR Smart Glasses Revenue (million), by Country 2025 & 2033
- Figure 13: South America AR and VR Smart Glasses Revenue Share (%), by Country 2025 & 2033
- Figure 14: Europe AR and VR Smart Glasses Revenue (million), by Application 2025 & 2033
- Figure 15: Europe AR and VR Smart Glasses Revenue Share (%), by Application 2025 & 2033
- Figure 16: Europe AR and VR Smart Glasses Revenue (million), by Types 2025 & 2033
- Figure 17: Europe AR and VR Smart Glasses Revenue Share (%), by Types 2025 & 2033
- Figure 18: Europe AR and VR Smart Glasses Revenue (million), by Country 2025 & 2033
- Figure 19: Europe AR and VR Smart Glasses Revenue Share (%), by Country 2025 & 2033
- Figure 20: Middle East & Africa AR and VR Smart Glasses Revenue (million), by Application 2025 & 2033
- Figure 21: Middle East & Africa AR and VR Smart Glasses Revenue Share (%), by Application 2025 & 2033
- Figure 22: Middle East & Africa AR and VR Smart Glasses Revenue (million), by Types 2025 & 2033
- Figure 23: Middle East & Africa AR and VR Smart Glasses Revenue Share (%), by Types 2025 & 2033
- Figure 24: Middle East & Africa AR and VR Smart Glasses Revenue (million), by Country 2025 & 2033
- Figure 25: Middle East & Africa AR and VR Smart Glasses Revenue Share (%), by Country 2025 & 2033
- Figure 26: Asia Pacific AR and VR Smart Glasses Revenue (million), by Application 2025 & 2033
- Figure 27: Asia Pacific AR and VR Smart Glasses Revenue Share (%), by Application 2025 & 2033
- Figure 28: Asia Pacific AR and VR Smart Glasses Revenue (million), by Types 2025 & 2033
- Figure 29: Asia Pacific AR and VR Smart Glasses Revenue Share (%), by Types 2025 & 2033
- Figure 30: Asia Pacific AR and VR Smart Glasses Revenue (million), by Country 2025 & 2033
- Figure 31: Asia Pacific AR and VR Smart Glasses Revenue Share (%), by Country 2025 & 2033
List of Tables
- Table 1: Global AR and VR Smart Glasses Revenue million Forecast, by Application 2020 & 2033
- Table 2: Global AR and VR Smart Glasses Revenue million Forecast, by Types 2020 & 2033
- Table 3: Global AR and VR Smart Glasses Revenue million Forecast, by Region 2020 & 2033
- Table 4: Global AR and VR Smart Glasses Revenue million Forecast, by Application 2020 & 2033
- Table 5: Global AR and VR Smart Glasses Revenue million Forecast, by Types 2020 & 2033
- Table 6: Global AR and VR Smart Glasses Revenue million Forecast, by Country 2020 & 2033
- Table 7: United States AR and VR Smart Glasses Revenue (million) Forecast, by Application 2020 & 2033
- Table 8: Canada AR and VR Smart Glasses Revenue (million) Forecast, by Application 2020 & 2033
- Table 9: Mexico AR and VR Smart Glasses Revenue (million) Forecast, by Application 2020 & 2033
- Table 10: Global AR and VR Smart Glasses Revenue million Forecast, by Application 2020 & 2033
- Table 11: Global AR and VR Smart Glasses Revenue million Forecast, by Types 2020 & 2033
- Table 12: Global AR and VR Smart Glasses Revenue million Forecast, by Country 2020 & 2033
- Table 13: Brazil AR and VR Smart Glasses Revenue (million) Forecast, by Application 2020 & 2033
- Table 14: Argentina AR and VR Smart Glasses Revenue (million) Forecast, by Application 2020 & 2033
- Table 15: Rest of South America AR and VR Smart Glasses Revenue (million) Forecast, by Application 2020 & 2033
- Table 16: Global AR and VR Smart Glasses Revenue million Forecast, by Application 2020 & 2033
- Table 17: Global AR and VR Smart Glasses Revenue million Forecast, by Types 2020 & 2033
- Table 18: Global AR and VR Smart Glasses Revenue million Forecast, by Country 2020 & 2033
- Table 19: United Kingdom AR and VR Smart Glasses Revenue (million) Forecast, by Application 2020 & 2033
- Table 20: Germany AR and VR Smart Glasses Revenue (million) Forecast, by Application 2020 & 2033
- Table 21: France AR and VR Smart Glasses Revenue (million) Forecast, by Application 2020 & 2033
- Table 22: Italy AR and VR Smart Glasses Revenue (million) Forecast, by Application 2020 & 2033
- Table 23: Spain AR and VR Smart Glasses Revenue (million) Forecast, by Application 2020 & 2033
- Table 24: Russia AR and VR Smart Glasses Revenue (million) Forecast, by Application 2020 & 2033
- Table 25: Benelux AR and VR Smart Glasses Revenue (million) Forecast, by Application 2020 & 2033
- Table 26: Nordics AR and VR Smart Glasses Revenue (million) Forecast, by Application 2020 & 2033
- Table 27: Rest of Europe AR and VR Smart Glasses Revenue (million) Forecast, by Application 2020 & 2033
- Table 28: Global AR and VR Smart Glasses Revenue million Forecast, by Application 2020 & 2033
- Table 29: Global AR and VR Smart Glasses Revenue million Forecast, by Types 2020 & 2033
- Table 30: Global AR and VR Smart Glasses Revenue million Forecast, by Country 2020 & 2033
- Table 31: Turkey AR and VR Smart Glasses Revenue (million) Forecast, by Application 2020 & 2033
- Table 32: Israel AR and VR Smart Glasses Revenue (million) Forecast, by Application 2020 & 2033
- Table 33: GCC AR and VR Smart Glasses Revenue (million) Forecast, by Application 2020 & 2033
- Table 34: North Africa AR and VR Smart Glasses Revenue (million) Forecast, by Application 2020 & 2033
- Table 35: South Africa AR and VR Smart Glasses Revenue (million) Forecast, by Application 2020 & 2033
- Table 36: Rest of Middle East & Africa AR and VR Smart Glasses Revenue (million) Forecast, by Application 2020 & 2033
- Table 37: Global AR and VR Smart Glasses Revenue million Forecast, by Application 2020 & 2033
- Table 38: Global AR and VR Smart Glasses Revenue million Forecast, by Types 2020 & 2033
- Table 39: Global AR and VR Smart Glasses Revenue million Forecast, by Country 2020 & 2033
- Table 40: China AR and VR Smart Glasses Revenue (million) Forecast, by Application 2020 & 2033
- Table 41: India AR and VR Smart Glasses Revenue (million) Forecast, by Application 2020 & 2033
- Table 42: Japan AR and VR Smart Glasses Revenue (million) Forecast, by Application 2020 & 2033
- Table 43: South Korea AR and VR Smart Glasses Revenue (million) Forecast, by Application 2020 & 2033
- Table 44: ASEAN AR and VR Smart Glasses Revenue (million) Forecast, by Application 2020 & 2033
- Table 45: Oceania AR and VR Smart Glasses Revenue (million) Forecast, by Application 2020 & 2033
- Table 46: Rest of Asia Pacific AR and VR Smart Glasses Revenue (million) Forecast, by Application 2020 & 2033
Frequently Asked Questions
1. What is the projected Compound Annual Growth Rate (CAGR) of the AR and VR Smart Glasses?
The projected CAGR is approximately 7.4%.
2. Which companies are prominent players in the AR and VR Smart Glasses?
Key companies in the market include Seiko Epson Corporation (Japan), Microsoft Corporation (US), Osterhout Design Group (US), Samsung Group (South Korea), Royole Corporation (US), Optinvent (France), MicroOLED (France), Ricoh (Japan), Kopin Corporation (US), Imprint Energy (US), FlexEl, (US), Sony Corporation (Japan), HTC Corporation (Taiwan), Razer Inc. (US), Avegant (US), Google Inc. (US), Oculus VR (US), Vuzix (US), Jenax (South Korea), Atheer (US).
3. What are the main segments of the AR and VR Smart Glasses?
The market segments include Application, Types.
4. Can you provide details about the market size?
The market size is estimated to be USD 22660 million as of 2022.
5. What are some drivers contributing to market growth?
N/A
6. What are the notable trends driving market growth?
N/A
7. Are there any restraints impacting market growth?
N/A
8. Can you provide examples of recent developments in the market?
N/A
9. What pricing options are available for accessing the report?
Pricing options include single-user, multi-user, and enterprise licenses priced at USD 2900.00, USD 4350.00, and USD 5800.00 respectively.
10. Is the market size provided in terms of value or volume?
The market size is provided in terms of value, measured in million.
11. Are there any specific market keywords associated with the report?
Yes, the market keyword associated with the report is "AR and VR Smart Glasses," which aids in identifying and referencing the specific market segment covered.
12. How do I determine which pricing option suits my needs best?
The pricing options vary based on user requirements and access needs. Individual users may opt for single-user licenses, while businesses requiring broader access may choose multi-user or enterprise licenses for cost-effective access to the report.
13. Are there any additional resources or data provided in the AR and VR Smart Glasses report?
While the report offers comprehensive insights, it's advisable to review the specific contents or supplementary materials provided to ascertain if additional resources or data are available.
14. How can I stay updated on further developments or reports in the AR and VR Smart Glasses?
To stay informed about further developments, trends, and reports in the AR and VR Smart Glasses, consider subscribing to industry newsletters, following relevant companies and organizations, or regularly checking reputable industry news sources and publications.
Methodology
Step 1 - Identification of Relevant Samples Size from Population Database


Step 2 - Approaches for Defining Global Market Size (Value, Volume* & Price*)

Note*: In applicable scenarios
Step 3 - Data Sources
Primary Research
- Web Analytics
- Survey Reports
- Research Institute
- Latest Research Reports
- Opinion Leaders
Secondary Research
- Annual Reports
- White Paper
- Latest Press Release
- Industry Association
- Paid Database
- Investor Presentations

Step 4 - Data Triangulation
Involves using different sources of information in order to increase the validity of a study
These sources are likely to be stakeholders in a program - participants, other researchers, program staff, other community members, and so on.
Then we put all data in single framework & apply various statistical tools to find out the dynamic on the market.
During the analysis stage, feedback from the stakeholder groups would be compared to determine areas of agreement as well as areas of divergence