

Key Insights
The Asia-Pacific food sweetener market, valued at 42917.5 million in 2025, is projected for robust expansion with a CAGR of 3.7% from 2025 to 2033. Growth is propelled by increasing disposable incomes, particularly in emerging economies like India and China, driving demand for processed foods and beverages. Evolving consumer preferences for convenient options also contribute significantly. The market is segmented by product type (sucrose, starch sweeteners, sugar alcohols, high-intensity sweeteners) and application (dairy, bakery, confectionery, beverages). While sucrose remains dominant, high-intensity sweeteners are poised for rapid growth due to rising health consciousness and demand for low-calorie products. Challenges include fluctuating sugar prices, stringent regulations, and health concerns related to excessive sugar consumption. China, Japan, and India lead the market due to large populations and advanced food processing industries. Key players include Cargill, PureCircle, ADM, Ajinomoto, Tate & Lyle, DuPont, Ingredion, and Tereos, who are actively engaged in product innovation, strategic partnerships, and market expansion.
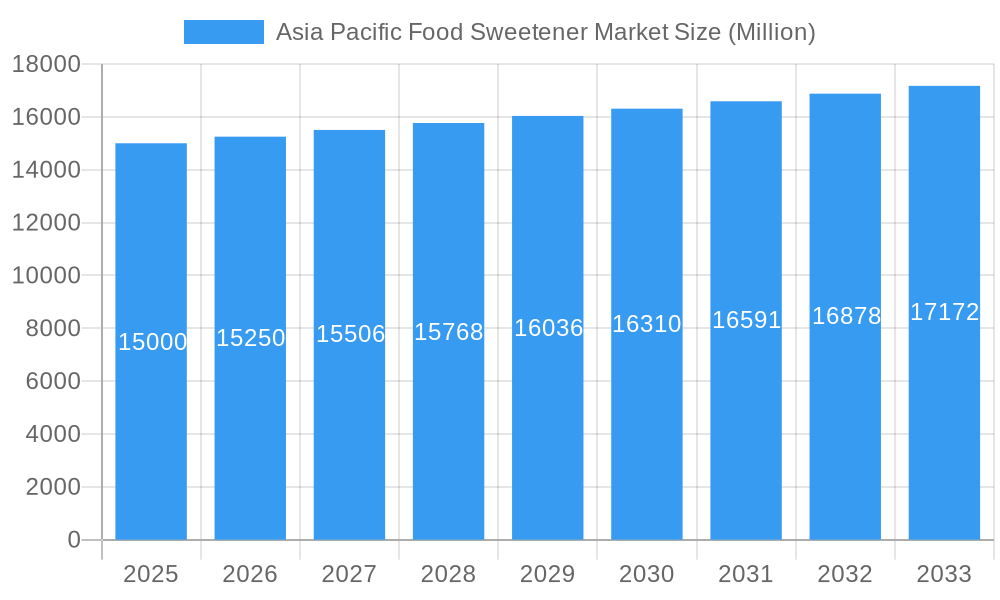
Asia Pacific Food Sweetener Market Market Size (In Billion)
The competitive landscape features both multinational corporations and specialized players. Innovation in natural and healthier sweetener alternatives is a key market driver. Companies are investing in R&D to develop novel sweeteners that meet health demands while maintaining taste. Navigating regulatory landscapes for labeling and approvals, and adapting to diverse regional preferences, will be crucial for success. Market penetration in emerging economies, coupled with strategic investments in production and distribution, will shape future growth in this dynamic sector.
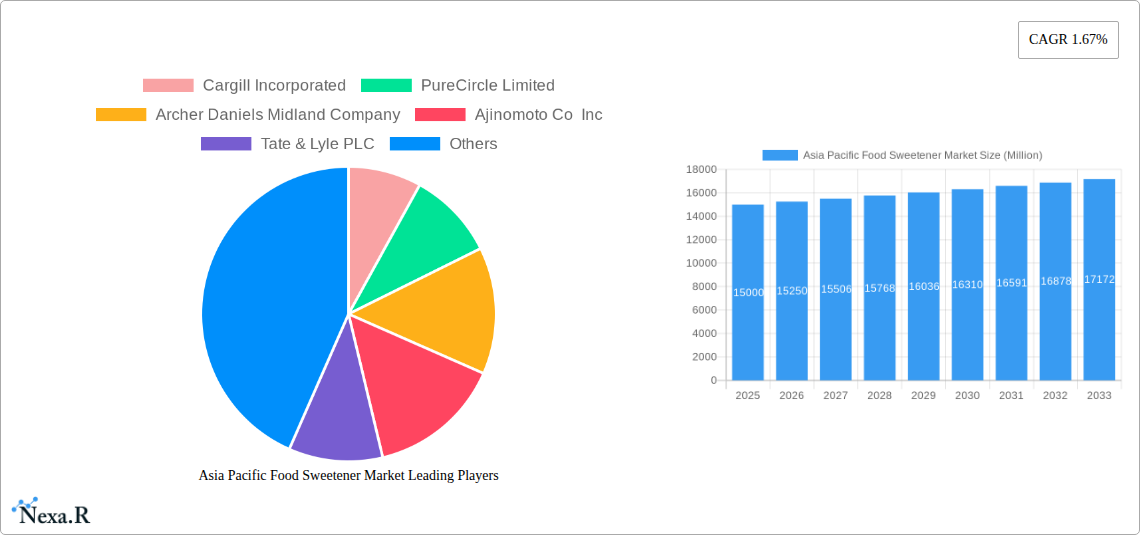
Asia Pacific Food Sweetener Market Company Market Share
This report offers an in-depth analysis of the Asia Pacific food sweetener market, providing essential insights for industry professionals, investors, and decision-makers. The study covers 2019-2033, with a forecast focus on 2025-2033, detailing market dynamics, growth trends, and key players. It analyzes the parent market and its sub-segments by product type, application, and geography for a comprehensive view of this sector. The market size is presented in million units.
Asia Pacific Food Sweetener Market Dynamics & Structure
The Asia Pacific food sweetener market is characterized by a moderately concentrated landscape, with key players like Cargill Incorporated, PureCircle Limited, Archer Daniels Midland Company, Ajinomoto Co Inc, Tate & Lyle PLC, DuPont, Ingredion Incorporated, and Tereos S A holding significant market share. However, the market is witnessing increased competition from smaller, specialized players, particularly in the high-intensity sweetener (HIS) segment. Technological innovation, driven by consumer demand for healthier alternatives and functional food ingredients, is a major driver. Stringent regulatory frameworks concerning sugar consumption and labeling are influencing product formulations and market strategies. The rise of health-conscious consumers is leading to increased demand for low-calorie and natural sweeteners, creating opportunities for substitutes like stevia and sugar alcohols. M&A activity has been moderate in recent years, with strategic acquisitions focused on expanding product portfolios and geographical reach.
- Market Concentration: Moderately concentrated, with top 8 players holding approximately xx% market share in 2025.
- Technological Innovation: Focus on natural, low-calorie, and functional sweeteners.
- Regulatory Framework: Stringent regulations on sugar content and labeling.
- Competitive Substitutes: Increased competition from natural and alternative sweeteners.
- End-User Demographics: Shifting consumer preferences towards healthier food options.
- M&A Trends: Moderate activity, focused on portfolio expansion and geographical reach. Approximately xx M&A deals concluded between 2019 and 2024.
Asia Pacific Food Sweetener Market Growth Trends & Insights
The Asia Pacific food sweetener market is experiencing robust growth, driven by factors such as rising disposable incomes, changing dietary habits, and the increasing popularity of processed foods and beverages. The market size is projected to grow at a CAGR of xx% during the forecast period (2025-2033), reaching xx million units by 2033. This growth is further fueled by technological advancements in sweetener production, leading to improved efficiency and cost reduction. Consumer behavior is shifting towards healthier options, increasing demand for low-calorie and functional sweeteners. The adoption rate of high-intensity sweeteners (HIS) is accelerating, especially in countries with high sugar consumption.
Market Size Evolution:
- 2019: xx million units
- 2024: xx million units
- 2025 (Estimated): xx million units
- 2033 (Forecast): xx million units
CAGR (2025-2033): xx% Market Penetration of HIS: xx% in 2025, projected to reach xx% by 2033.
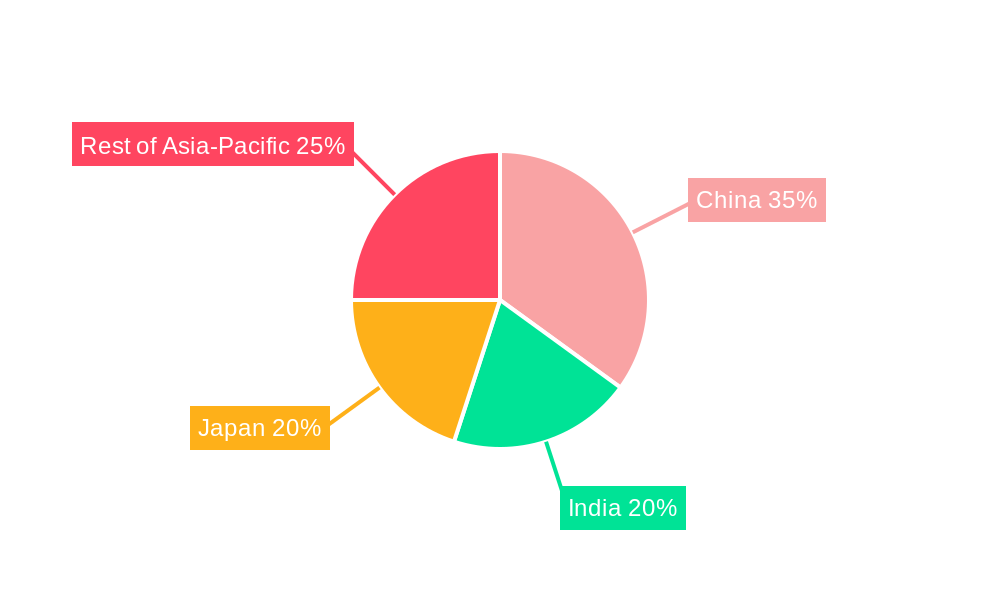
Dominant Regions, Countries, or Segments in Asia Pacific Food Sweetener Market
China dominates the Asia Pacific food sweetener market, accounting for approximately xx% of the total market share in 2025. This dominance is attributable to its large population, expanding middle class, and booming food and beverage industry. India is another significant market, experiencing rapid growth fueled by rising disposable incomes and changing consumer preferences. Japan, while exhibiting a relatively mature market, remains an important contributor due to its developed food processing sector. The Rest of Asia-Pacific region also presents substantial growth potential.
Within product types, sucrose (common sugar) remains the largest segment, though its market share is gradually declining due to health concerns. Starch sweeteners and sugar alcohols are gaining traction, driven by their functional properties and perceived health benefits. High-intensity sweeteners (HIS) are exhibiting the highest growth rate, propelled by consumer demand for low-calorie options.
In terms of application, the beverages segment is the largest consumer of sweeteners, followed by confectionery and dairy. The bakery and soups, sauces, and dressings segments are also showing promising growth.
- Key Drivers for China: Large population, rapid economic growth, and expanding food processing industry.
- Key Drivers for India: Rising disposable incomes, changing dietary habits, and growing processed food consumption.
- Key Drivers for Japan: Developed food processing industry and established consumer base.
- High-Intensity Sweeteners (HIS) Growth Drivers: Health consciousness and demand for low-calorie options.
- Beverages Segment Dominance: High sweetener consumption in soft drinks and other beverages.
Asia Pacific Food Sweetener Market Product Landscape
The Asia Pacific food sweetener market showcases continuous product innovation, focusing on natural, functional, and low-calorie options. Advancements in sweetener extraction and modification technologies are leading to improved taste, texture, and functionality. Companies are emphasizing the unique selling propositions of their products, such as reduced caloric content, improved sweetness profiles, and enhanced functionalities (e.g., prebiotic properties). The use of stevia, monk fruit, and other natural sweeteners is gaining prominence.
Key Drivers, Barriers & Challenges in Asia Pacific Food Sweetener Market
Key Drivers: Rising disposable incomes, increasing demand for processed foods, changing consumer preferences towards healthier options, technological advancements in sweetener production, and government initiatives promoting food processing industries.
Key Challenges: Fluctuations in raw material prices, stringent regulatory frameworks regarding food additives, intense competition from established and emerging players, and concerns regarding the long-term health effects of certain artificial sweeteners. Supply chain disruptions due to geopolitical factors have also impacted the market. The impact on market growth is estimated at approximately xx% during the study period.
Emerging Opportunities in Asia Pacific Food Sweetener Market
Untapped markets in less developed regions of Asia Pacific present significant opportunities for market expansion. The increasing demand for functional foods and beverages, incorporating sweeteners with health benefits, creates further growth potential. The development of novel sweetener blends, combining natural and artificial sweeteners to optimize taste and functionality, represents a key opportunity. Evolving consumer preferences towards plant-based and sustainable food options are driving demand for sweeteners derived from natural sources.
Growth Accelerators in the Asia Pacific Food Sweetener Market Industry
Technological breakthroughs in sweetener production and processing are accelerating market growth. Strategic partnerships between food ingredient manufacturers and food and beverage companies are driving product innovation and market penetration. Expansion strategies into new geographical markets and product segments are fueling long-term growth. The focus on sustainable sourcing and eco-friendly production processes also adds to the market growth.
Key Players Shaping the Asia Pacific Food Sweetener Market Market
Notable Milestones in Asia Pacific Food Sweetener Market Sector
- 2021: Introduction of a novel stevia-based sweetener by PureCircle.
- 2022: Cargill announces strategic partnership with a leading beverage manufacturer in China.
- 2023: Ajinomoto launches a new line of functional sweeteners in India.
- 2024: Merger between two regional sweetener producers in Southeast Asia. Specific details unavailable
In-Depth Asia Pacific Food Sweetener Market Market Outlook
The Asia Pacific food sweetener market is poised for continued robust growth, driven by favorable demographic trends, evolving consumer preferences, and ongoing technological innovations. Strategic investments in research and development, focusing on natural and functional sweeteners, will play a crucial role in shaping the market's future. Companies that embrace sustainability initiatives and adapt to evolving regulatory landscapes are well-positioned to capitalize on emerging opportunities. The market's long-term potential is considerable, with significant growth opportunities across various segments and geographies.
Asia Pacific Food Sweetener Market Segmentation
-
1. Product Type
- 1.1. Sucrose (Common Sugar)
-
1.2. Starch Sweeteners and Sugar Alcohols
- 1.2.1. Dextrose
- 1.2.2. High Fructose Corn Syrup (HFCS)
- 1.2.3. Maltodextrin
- 1.2.4. Sorbitol
- 1.2.5. Xylitol
- 1.2.6. Others
-
1.3. High Intensity Sweeteners (HIS)
- 1.3.1. Sucralose
- 1.3.2. Aspartame
- 1.3.3. Saccharin
- 1.3.4. Cyclamate
- 1.3.5. Ace-K
- 1.3.6. Neotame
- 1.3.7. Stevia
-
2. Application
- 2.1. Dairy
- 2.2. Bakery
- 2.3. Soups, Sauces and Dressings
- 2.4. Confectionery
- 2.5. Beverages
- 2.6. Others
-
3. Asia Pacific
- 3.1. China
- 3.2. Japan
- 3.3. India
- 3.4. Australia
- 3.5. Rest of Asia-Pacific
Asia Pacific Food Sweetener Market Segmentation By Geography
-
1. Asia Pacific
- 1.1. China
- 1.2. Japan
- 1.3. South Korea
- 1.4. India
- 1.5. Australia
- 1.6. New Zealand
- 1.7. Indonesia
- 1.8. Malaysia
- 1.9. Singapore
- 1.10. Thailand
- 1.11. Vietnam
- 1.12. Philippines
Asia Pacific Food Sweetener Market Regional Market Share
Geographic Coverage of Asia Pacific Food Sweetener Market
Asia Pacific Food Sweetener Market REPORT HIGHLIGHTS
| Aspects | Details |
|---|---|
| Study Period | 2020-2034 |
| Base Year | 2025 |
| Estimated Year | 2026 |
| Forecast Period | 2026-2034 |
| Historical Period | 2020-2025 |
| Growth Rate | CAGR of 3.7% from 2020-2034 |
| Segmentation |
|
Table of Contents
- 1. Introduction
- 1.1. Research Scope
- 1.2. Market Segmentation
- 1.3. Research Methodology
- 1.4. Definitions and Assumptions
- 2. Executive Summary
- 2.1. Introduction
- 3. Market Dynamics
- 3.1. Introduction
- 3.2. Market Drivers
- 3.2.1. Rising Application in Dietary Supplements
- 3.3. Market Restrains
- 3.3.1. Increasing prevalence of hydroglycemia
- 3.4. Market Trends
- 3.4.1. Rise in Applications of Sweeteners in Processed Foods
- 4. Market Factor Analysis
- 4.1. Porters Five Forces
- 4.2. Supply/Value Chain
- 4.3. PESTEL analysis
- 4.4. Market Entropy
- 4.5. Patent/Trademark Analysis
- 5. Asia Pacific Food Sweetener Market Analysis, Insights and Forecast, 2020-2032
- 5.1. Market Analysis, Insights and Forecast - by Product Type
- 5.1.1. Sucrose (Common Sugar)
- 5.1.2. Starch Sweeteners and Sugar Alcohols
- 5.1.2.1. Dextrose
- 5.1.2.2. High Fructose Corn Syrup (HFCS)
- 5.1.2.3. Maltodextrin
- 5.1.2.4. Sorbitol
- 5.1.2.5. Xylitol
- 5.1.2.6. Others
- 5.1.3. High Intensity Sweeteners (HIS)
- 5.1.3.1. Sucralose
- 5.1.3.2. Aspartame
- 5.1.3.3. Saccharin
- 5.1.3.4. Cyclamate
- 5.1.3.5. Ace-K
- 5.1.3.6. Neotame
- 5.1.3.7. Stevia
- 5.2. Market Analysis, Insights and Forecast - by Application
- 5.2.1. Dairy
- 5.2.2. Bakery
- 5.2.3. Soups, Sauces and Dressings
- 5.2.4. Confectionery
- 5.2.5. Beverages
- 5.2.6. Others
- 5.3. Market Analysis, Insights and Forecast - by Asia Pacific
- 5.3.1. China
- 5.3.2. Japan
- 5.3.3. India
- 5.3.4. Australia
- 5.3.5. Rest of Asia-Pacific
- 5.4. Market Analysis, Insights and Forecast - by Region
- 5.4.1. Asia Pacific
- 5.1. Market Analysis, Insights and Forecast - by Product Type
- 6. Competitive Analysis
- 6.1. Market Share Analysis 2025
- 6.2. Company Profiles
- 6.2.1 Cargill Incorporated
- 6.2.1.1. Overview
- 6.2.1.2. Products
- 6.2.1.3. SWOT Analysis
- 6.2.1.4. Recent Developments
- 6.2.1.5. Financials (Based on Availability)
- 6.2.2 PureCircle Limited
- 6.2.2.1. Overview
- 6.2.2.2. Products
- 6.2.2.3. SWOT Analysis
- 6.2.2.4. Recent Developments
- 6.2.2.5. Financials (Based on Availability)
- 6.2.3 Archer Daniels Midland Company
- 6.2.3.1. Overview
- 6.2.3.2. Products
- 6.2.3.3. SWOT Analysis
- 6.2.3.4. Recent Developments
- 6.2.3.5. Financials (Based on Availability)
- 6.2.4 Ajinomoto Co Inc
- 6.2.4.1. Overview
- 6.2.4.2. Products
- 6.2.4.3. SWOT Analysis
- 6.2.4.4. Recent Developments
- 6.2.4.5. Financials (Based on Availability)
- 6.2.5 Tate & Lyle PLC
- 6.2.5.1. Overview
- 6.2.5.2. Products
- 6.2.5.3. SWOT Analysis
- 6.2.5.4. Recent Developments
- 6.2.5.5. Financials (Based on Availability)
- 6.2.6 DuPont
- 6.2.6.1. Overview
- 6.2.6.2. Products
- 6.2.6.3. SWOT Analysis
- 6.2.6.4. Recent Developments
- 6.2.6.5. Financials (Based on Availability)
- 6.2.7 Ingredion Incorporated
- 6.2.7.1. Overview
- 6.2.7.2. Products
- 6.2.7.3. SWOT Analysis
- 6.2.7.4. Recent Developments
- 6.2.7.5. Financials (Based on Availability)
- 6.2.8 Tereos S A *List Not Exhaustive
- 6.2.8.1. Overview
- 6.2.8.2. Products
- 6.2.8.3. SWOT Analysis
- 6.2.8.4. Recent Developments
- 6.2.8.5. Financials (Based on Availability)
- 6.2.1 Cargill Incorporated
List of Figures
- Figure 1: Asia Pacific Food Sweetener Market Revenue Breakdown (million, %) by Product 2025 & 2033
- Figure 2: Asia Pacific Food Sweetener Market Share (%) by Company 2025
List of Tables
- Table 1: Asia Pacific Food Sweetener Market Revenue million Forecast, by Product Type 2020 & 2033
- Table 2: Asia Pacific Food Sweetener Market Volume K Tons Forecast, by Product Type 2020 & 2033
- Table 3: Asia Pacific Food Sweetener Market Revenue million Forecast, by Application 2020 & 2033
- Table 4: Asia Pacific Food Sweetener Market Volume K Tons Forecast, by Application 2020 & 2033
- Table 5: Asia Pacific Food Sweetener Market Revenue million Forecast, by Asia Pacific 2020 & 2033
- Table 6: Asia Pacific Food Sweetener Market Volume K Tons Forecast, by Asia Pacific 2020 & 2033
- Table 7: Asia Pacific Food Sweetener Market Revenue million Forecast, by Region 2020 & 2033
- Table 8: Asia Pacific Food Sweetener Market Volume K Tons Forecast, by Region 2020 & 2033
- Table 9: Asia Pacific Food Sweetener Market Revenue million Forecast, by Product Type 2020 & 2033
- Table 10: Asia Pacific Food Sweetener Market Volume K Tons Forecast, by Product Type 2020 & 2033
- Table 11: Asia Pacific Food Sweetener Market Revenue million Forecast, by Application 2020 & 2033
- Table 12: Asia Pacific Food Sweetener Market Volume K Tons Forecast, by Application 2020 & 2033
- Table 13: Asia Pacific Food Sweetener Market Revenue million Forecast, by Asia Pacific 2020 & 2033
- Table 14: Asia Pacific Food Sweetener Market Volume K Tons Forecast, by Asia Pacific 2020 & 2033
- Table 15: Asia Pacific Food Sweetener Market Revenue million Forecast, by Country 2020 & 2033
- Table 16: Asia Pacific Food Sweetener Market Volume K Tons Forecast, by Country 2020 & 2033
- Table 17: China Asia Pacific Food Sweetener Market Revenue (million) Forecast, by Application 2020 & 2033
- Table 18: China Asia Pacific Food Sweetener Market Volume (K Tons) Forecast, by Application 2020 & 2033
- Table 19: Japan Asia Pacific Food Sweetener Market Revenue (million) Forecast, by Application 2020 & 2033
- Table 20: Japan Asia Pacific Food Sweetener Market Volume (K Tons) Forecast, by Application 2020 & 2033
- Table 21: South Korea Asia Pacific Food Sweetener Market Revenue (million) Forecast, by Application 2020 & 2033
- Table 22: South Korea Asia Pacific Food Sweetener Market Volume (K Tons) Forecast, by Application 2020 & 2033
- Table 23: India Asia Pacific Food Sweetener Market Revenue (million) Forecast, by Application 2020 & 2033
- Table 24: India Asia Pacific Food Sweetener Market Volume (K Tons) Forecast, by Application 2020 & 2033
- Table 25: Australia Asia Pacific Food Sweetener Market Revenue (million) Forecast, by Application 2020 & 2033
- Table 26: Australia Asia Pacific Food Sweetener Market Volume (K Tons) Forecast, by Application 2020 & 2033
- Table 27: New Zealand Asia Pacific Food Sweetener Market Revenue (million) Forecast, by Application 2020 & 2033
- Table 28: New Zealand Asia Pacific Food Sweetener Market Volume (K Tons) Forecast, by Application 2020 & 2033
- Table 29: Indonesia Asia Pacific Food Sweetener Market Revenue (million) Forecast, by Application 2020 & 2033
- Table 30: Indonesia Asia Pacific Food Sweetener Market Volume (K Tons) Forecast, by Application 2020 & 2033
- Table 31: Malaysia Asia Pacific Food Sweetener Market Revenue (million) Forecast, by Application 2020 & 2033
- Table 32: Malaysia Asia Pacific Food Sweetener Market Volume (K Tons) Forecast, by Application 2020 & 2033
- Table 33: Singapore Asia Pacific Food Sweetener Market Revenue (million) Forecast, by Application 2020 & 2033
- Table 34: Singapore Asia Pacific Food Sweetener Market Volume (K Tons) Forecast, by Application 2020 & 2033
- Table 35: Thailand Asia Pacific Food Sweetener Market Revenue (million) Forecast, by Application 2020 & 2033
- Table 36: Thailand Asia Pacific Food Sweetener Market Volume (K Tons) Forecast, by Application 2020 & 2033
- Table 37: Vietnam Asia Pacific Food Sweetener Market Revenue (million) Forecast, by Application 2020 & 2033
- Table 38: Vietnam Asia Pacific Food Sweetener Market Volume (K Tons) Forecast, by Application 2020 & 2033
- Table 39: Philippines Asia Pacific Food Sweetener Market Revenue (million) Forecast, by Application 2020 & 2033
- Table 40: Philippines Asia Pacific Food Sweetener Market Volume (K Tons) Forecast, by Application 2020 & 2033
Frequently Asked Questions
1. What is the projected Compound Annual Growth Rate (CAGR) of the Asia Pacific Food Sweetener Market?
The projected CAGR is approximately 3.7%.
2. Which companies are prominent players in the Asia Pacific Food Sweetener Market?
Key companies in the market include Cargill Incorporated, PureCircle Limited, Archer Daniels Midland Company, Ajinomoto Co Inc, Tate & Lyle PLC, DuPont, Ingredion Incorporated, Tereos S A *List Not Exhaustive.
3. What are the main segments of the Asia Pacific Food Sweetener Market?
The market segments include Product Type, Application, Asia Pacific.
4. Can you provide details about the market size?
The market size is estimated to be USD 42917.5 million as of 2022.
5. What are some drivers contributing to market growth?
Rising Application in Dietary Supplements.
6. What are the notable trends driving market growth?
Rise in Applications of Sweeteners in Processed Foods.
7. Are there any restraints impacting market growth?
Increasing prevalence of hydroglycemia.
8. Can you provide examples of recent developments in the market?
N/A
9. What pricing options are available for accessing the report?
Pricing options include single-user, multi-user, and enterprise licenses priced at USD 4750, USD 5250, and USD 8750 respectively.
10. Is the market size provided in terms of value or volume?
The market size is provided in terms of value, measured in million and volume, measured in K Tons.
11. Are there any specific market keywords associated with the report?
Yes, the market keyword associated with the report is "Asia Pacific Food Sweetener Market," which aids in identifying and referencing the specific market segment covered.
12. How do I determine which pricing option suits my needs best?
The pricing options vary based on user requirements and access needs. Individual users may opt for single-user licenses, while businesses requiring broader access may choose multi-user or enterprise licenses for cost-effective access to the report.
13. Are there any additional resources or data provided in the Asia Pacific Food Sweetener Market report?
While the report offers comprehensive insights, it's advisable to review the specific contents or supplementary materials provided to ascertain if additional resources or data are available.
14. How can I stay updated on further developments or reports in the Asia Pacific Food Sweetener Market?
To stay informed about further developments, trends, and reports in the Asia Pacific Food Sweetener Market, consider subscribing to industry newsletters, following relevant companies and organizations, or regularly checking reputable industry news sources and publications.
Methodology
Step 1 - Identification of Relevant Samples Size from Population Database


Step 2 - Approaches for Defining Global Market Size (Value, Volume* & Price*)

Note*: In applicable scenarios
Step 3 - Data Sources
Primary Research
- Web Analytics
- Survey Reports
- Research Institute
- Latest Research Reports
- Opinion Leaders
Secondary Research
- Annual Reports
- White Paper
- Latest Press Release
- Industry Association
- Paid Database
- Investor Presentations

Step 4 - Data Triangulation
Involves using different sources of information in order to increase the validity of a study
These sources are likely to be stakeholders in a program - participants, other researchers, program staff, other community members, and so on.
Then we put all data in single framework & apply various statistical tools to find out the dynamic on the market.
During the analysis stage, feedback from the stakeholder groups would be compared to determine areas of agreement as well as areas of divergence