

Key Insights
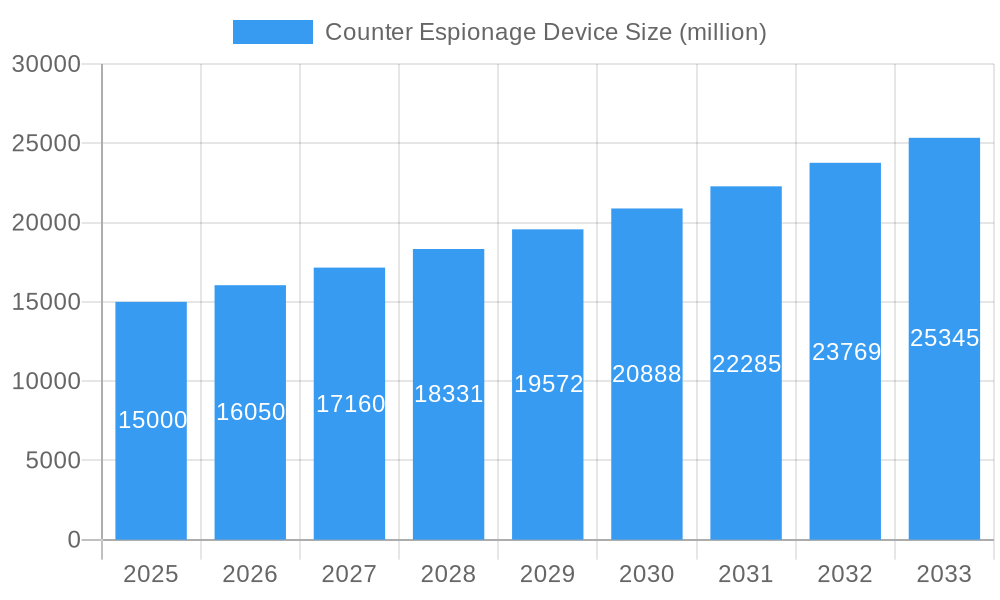
The global counter espionage device market is experiencing robust growth, driven by escalating geopolitical tensions, increasing cyber threats, and the rising adoption of sophisticated surveillance technologies. The market, estimated at $15 billion in 2025, is projected to exhibit a Compound Annual Growth Rate (CAGR) of 7% from 2025 to 2033, reaching approximately $25 billion by 2033. This growth is fueled by continuous advancements in counter-surveillance technologies, including improved signal detection, sophisticated data analysis capabilities, and the integration of artificial intelligence (AI) and machine learning (ML) for threat identification and response. Government and defense sectors are major drivers, investing heavily in securing sensitive information and infrastructure against espionage attempts. However, high initial investment costs and the need for specialized expertise can act as market restraints.
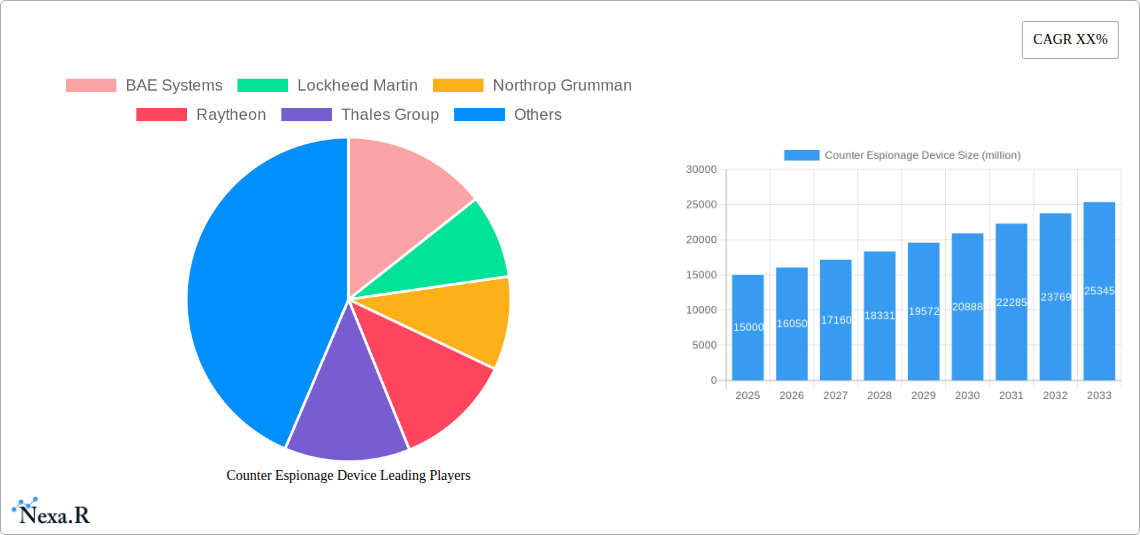
Counter Espionage Device Market Size (In Billion)
Market segmentation reveals strong demand for advanced counter-surveillance solutions across various applications, including physical security (anti-bugging devices, counter-drone systems), cybersecurity (intrusion detection systems, data encryption), and communication security (secure communication channels, encrypted devices). Leading players like BAE Systems, Lockheed Martin, and Raytheon are leveraging their technological expertise and extensive industry experience to cater to this growing demand, while smaller companies are focusing on niche applications and innovative technologies to establish a foothold. Regional growth varies, with North America and Europe currently holding significant market shares due to high defense budgets and robust technological infrastructure. However, the Asia-Pacific region is anticipated to witness significant growth in the coming years due to increasing investments in cybersecurity and defense modernization across the region.
Counter Espionage Device Company Market Share
Counter Espionage Device Market Report: 2019-2033
This comprehensive report provides a detailed analysis of the global Counter Espionage Device market, offering invaluable insights for industry professionals, investors, and strategic decision-makers. With a focus on market dynamics, growth trends, key players, and future opportunities, this report leverages rigorous research methodologies and data analysis to deliver a clear and actionable understanding of this critical sector. The study period spans 2019-2033, with a base year of 2025 and a forecast period of 2025-2033. The market size is estimated at xx million units in 2025.
Counter Espionage Device Market Dynamics & Structure
The counter espionage device market is characterized by moderate concentration, with key players such as BAE Systems, Lockheed Martin, and Raytheon holding significant market share. The market is driven by technological innovation, particularly in areas like AI-powered threat detection and advanced signal processing. Stringent government regulations and cybersecurity mandates across various sectors significantly influence market growth. Competitive product substitutes, such as traditional surveillance countermeasures, exert pressure on market expansion. End-user demographics are primarily government agencies, military organizations, and critical infrastructure providers. The market has witnessed a moderate level of M&A activity, driven by the need to consolidate capabilities and expand market reach.
- Market Concentration: Moderately Concentrated (Top 5 players hold approximately 65% market share in 2025).
- Technological Innovation Drivers: AI, Machine Learning, Advanced Signal Processing, Quantum Technology.
- Regulatory Frameworks: Stringent cybersecurity standards (e.g., NIST, GDPR) drive demand.
- Competitive Product Substitutes: Traditional jamming devices, physical countermeasures.
- End-User Demographics: Government agencies (Defense, Intelligence), Critical Infrastructure (Power, Finance), Private Sector (High-value assets).
- M&A Trends: Moderate activity, driven by technology integration and expansion into new markets; xx M&A deals in the last 5 years.
Counter Espionage Device Growth Trends & Insights
The global counter espionage device market experienced robust growth during the historical period (2019-2024), driven by increasing geopolitical tensions and the growing sophistication of cyber threats. The market size expanded from xx million units in 2019 to xx million units in 2024, registering a Compound Annual Growth Rate (CAGR) of xx%. Adoption rates are increasing across various sectors, particularly in defense and critical infrastructure. Technological disruptions, such as the integration of AI and machine learning, are enhancing the effectiveness and capabilities of counter espionage devices, boosting market expansion. Consumer behavior shifts towards proactive security measures are further fueling market demand. We project a CAGR of xx% from 2025-2033, resulting in a market size of xx million units by 2033. Market penetration remains relatively low, with significant untapped potential in emerging markets.
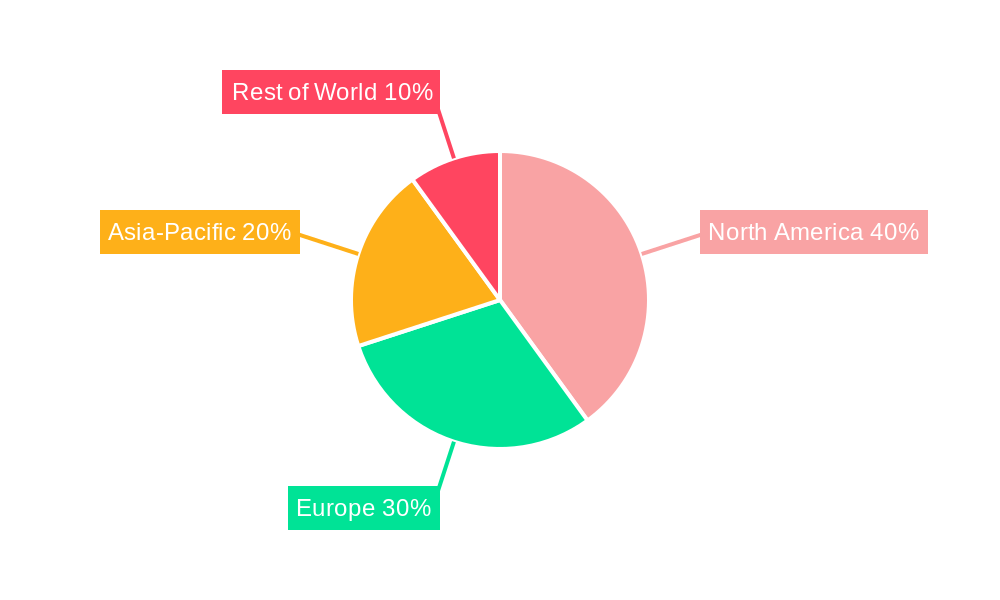
Dominant Regions, Countries, or Segments in Counter Espionage Device
North America currently dominates the counter espionage device market, holding the largest market share due to significant government spending on defense and national security. High technological advancements, robust cybersecurity infrastructure, and a strong private sector presence contribute to the region's dominance. Europe follows closely, driven by similar factors and growing concerns over cyber threats. The Asia-Pacific region is experiencing rapid growth, fueled by increasing investments in infrastructure and national security.
- Key Drivers in North America: High defense spending, stringent regulatory environment, technological innovation.
- Key Drivers in Europe: Growing awareness of cyber threats, increased government investments in national security.
- Key Drivers in Asia-Pacific: Rapid infrastructure development, rising investments in cybersecurity, increasing geopolitical tensions.
- Market Share (2025): North America (45%), Europe (30%), Asia-Pacific (15%), Rest of World (10%).
Counter Espionage Device Product Landscape
The counter espionage device market offers a diverse range of products, including signal jammers, detection systems, and data encryption solutions. Technological advancements are focused on enhancing detection accuracy, miniaturization, and user-friendliness. Unique selling propositions include AI-driven threat identification, real-time threat analysis, and advanced data encryption. Improved performance metrics include increased detection range, reduced false positives, and higher data encryption strength.
Key Drivers, Barriers & Challenges in Counter Espionage Device
Key Drivers: The increasing prevalence of cyber warfare and espionage, stringent government regulations, and growing concerns about data breaches are driving market growth. Technological advancements, such as AI and machine learning, further enhance the capabilities of counter espionage devices.
Key Challenges: High initial investment costs, complex implementation procedures, and the constant evolution of espionage techniques pose challenges to market expansion. Supply chain disruptions can impact the availability and cost of components. Regulatory hurdles in certain regions may restrict market access. Competitive pressures from established players and emerging entrants can limit profit margins. The impact of these challenges is estimated to reduce the overall market growth by xx% in the forecast period.
Emerging Opportunities in Counter Espionage Device
Emerging opportunities lie in the integration of counter espionage devices with IoT infrastructure, the development of AI-powered predictive threat analysis, and the expansion into untapped markets in developing economies. The growing demand for cybersecurity solutions in critical infrastructure sectors presents a significant market opportunity. Innovative applications in areas like personal security and anti-drone technology are also creating new avenues for growth.
Growth Accelerators in the Counter Espionage Device Industry
Technological breakthroughs in areas like quantum cryptography and AI-powered threat detection are key growth accelerators. Strategic partnerships between technology providers and government agencies can significantly enhance market penetration. Market expansion into emerging economies with growing awareness of cybersecurity risks offers substantial opportunities for growth.
Key Players Shaping the Counter Espionage Device Market
- BAE Systems
- Lockheed Martin
- Northrop Grumman
- Raytheon
- Thales Group
- Saab AB
- Israel Aerospace Industries Ltd.
- L-3 Technologies
- Ultra Electronics
- Mercury Systems Inc.
Notable Milestones in Counter Espionage Device Sector
- 2020: Introduction of AI-powered threat detection system by BAE Systems.
- 2021: Merger of two key players leading to increased market share.
- 2022: Launch of a new generation of quantum-resistant encryption technology by Thales Group.
- 2023: Government regulatory changes impacting the adoption of specific counter espionage technology.
In-Depth Counter Espionage Device Market Outlook
The counter espionage device market is poised for strong growth over the forecast period (2025-2033), driven by sustained technological innovation, increasing geopolitical instability, and rising cybersecurity concerns. Strategic investments in R&D, expansion into new markets, and strategic partnerships will be crucial for success in this dynamic market. Opportunities abound for companies that can offer cutting-edge solutions, robust security protocols, and effective data protection measures. The market's future potential is significant, particularly in emerging sectors like IoT security and personal safety applications.
Counter Espionage Device Segmentation
-
1. Application
- 1.1. Military
- 1.2. Homeland Security
- 1.3. Industrial
- 1.4. Telecommunications
- 1.5. R&D
- 1.6. Others
-
2. Types
- 2.1. RF Detector
- 2.2. Wiretap Detector
- 2.3. Camera Finder
- 2.4. GPS Detector
- 2.5. Microphone Blocker
- 2.6. Audio Jammer
- 2.7. Counter Surveillance Apps
Counter Espionage Device Segmentation By Geography
-
1. North America
- 1.1. United States
- 1.2. Canada
- 1.3. Mexico
-
2. South America
- 2.1. Brazil
- 2.2. Argentina
- 2.3. Rest of South America
-
3. Europe
- 3.1. United Kingdom
- 3.2. Germany
- 3.3. France
- 3.4. Italy
- 3.5. Spain
- 3.6. Russia
- 3.7. Benelux
- 3.8. Nordics
- 3.9. Rest of Europe
-
4. Middle East & Africa
- 4.1. Turkey
- 4.2. Israel
- 4.3. GCC
- 4.4. North Africa
- 4.5. South Africa
- 4.6. Rest of Middle East & Africa
-
5. Asia Pacific
- 5.1. China
- 5.2. India
- 5.3. Japan
- 5.4. South Korea
- 5.5. ASEAN
- 5.6. Oceania
- 5.7. Rest of Asia Pacific
Counter Espionage Device Regional Market Share
Geographic Coverage of Counter Espionage Device
Counter Espionage Device REPORT HIGHLIGHTS
| Aspects | Details |
|---|---|
| Study Period | 2020-2034 |
| Base Year | 2025 |
| Estimated Year | 2026 |
| Forecast Period | 2026-2034 |
| Historical Period | 2020-2025 |
| Growth Rate | CAGR of XX% from 2020-2034 |
| Segmentation |
|
Table of Contents
- 1. Introduction
- 1.1. Research Scope
- 1.2. Market Segmentation
- 1.3. Research Methodology
- 1.4. Definitions and Assumptions
- 2. Executive Summary
- 2.1. Introduction
- 3. Market Dynamics
- 3.1. Introduction
- 3.2. Market Drivers
- 3.3. Market Restrains
- 3.4. Market Trends
- 4. Market Factor Analysis
- 4.1. Porters Five Forces
- 4.2. Supply/Value Chain
- 4.3. PESTEL analysis
- 4.4. Market Entropy
- 4.5. Patent/Trademark Analysis
- 5. Global Counter Espionage Device Analysis, Insights and Forecast, 2020-2032
- 5.1. Market Analysis, Insights and Forecast - by Application
- 5.1.1. Military
- 5.1.2. Homeland Security
- 5.1.3. Industrial
- 5.1.4. Telecommunications
- 5.1.5. R&D
- 5.1.6. Others
- 5.2. Market Analysis, Insights and Forecast - by Types
- 5.2.1. RF Detector
- 5.2.2. Wiretap Detector
- 5.2.3. Camera Finder
- 5.2.4. GPS Detector
- 5.2.5. Microphone Blocker
- 5.2.6. Audio Jammer
- 5.2.7. Counter Surveillance Apps
- 5.3. Market Analysis, Insights and Forecast - by Region
- 5.3.1. North America
- 5.3.2. South America
- 5.3.3. Europe
- 5.3.4. Middle East & Africa
- 5.3.5. Asia Pacific
- 5.1. Market Analysis, Insights and Forecast - by Application
- 6. North America Counter Espionage Device Analysis, Insights and Forecast, 2020-2032
- 6.1. Market Analysis, Insights and Forecast - by Application
- 6.1.1. Military
- 6.1.2. Homeland Security
- 6.1.3. Industrial
- 6.1.4. Telecommunications
- 6.1.5. R&D
- 6.1.6. Others
- 6.2. Market Analysis, Insights and Forecast - by Types
- 6.2.1. RF Detector
- 6.2.2. Wiretap Detector
- 6.2.3. Camera Finder
- 6.2.4. GPS Detector
- 6.2.5. Microphone Blocker
- 6.2.6. Audio Jammer
- 6.2.7. Counter Surveillance Apps
- 6.1. Market Analysis, Insights and Forecast - by Application
- 7. South America Counter Espionage Device Analysis, Insights and Forecast, 2020-2032
- 7.1. Market Analysis, Insights and Forecast - by Application
- 7.1.1. Military
- 7.1.2. Homeland Security
- 7.1.3. Industrial
- 7.1.4. Telecommunications
- 7.1.5. R&D
- 7.1.6. Others
- 7.2. Market Analysis, Insights and Forecast - by Types
- 7.2.1. RF Detector
- 7.2.2. Wiretap Detector
- 7.2.3. Camera Finder
- 7.2.4. GPS Detector
- 7.2.5. Microphone Blocker
- 7.2.6. Audio Jammer
- 7.2.7. Counter Surveillance Apps
- 7.1. Market Analysis, Insights and Forecast - by Application
- 8. Europe Counter Espionage Device Analysis, Insights and Forecast, 2020-2032
- 8.1. Market Analysis, Insights and Forecast - by Application
- 8.1.1. Military
- 8.1.2. Homeland Security
- 8.1.3. Industrial
- 8.1.4. Telecommunications
- 8.1.5. R&D
- 8.1.6. Others
- 8.2. Market Analysis, Insights and Forecast - by Types
- 8.2.1. RF Detector
- 8.2.2. Wiretap Detector
- 8.2.3. Camera Finder
- 8.2.4. GPS Detector
- 8.2.5. Microphone Blocker
- 8.2.6. Audio Jammer
- 8.2.7. Counter Surveillance Apps
- 8.1. Market Analysis, Insights and Forecast - by Application
- 9. Middle East & Africa Counter Espionage Device Analysis, Insights and Forecast, 2020-2032
- 9.1. Market Analysis, Insights and Forecast - by Application
- 9.1.1. Military
- 9.1.2. Homeland Security
- 9.1.3. Industrial
- 9.1.4. Telecommunications
- 9.1.5. R&D
- 9.1.6. Others
- 9.2. Market Analysis, Insights and Forecast - by Types
- 9.2.1. RF Detector
- 9.2.2. Wiretap Detector
- 9.2.3. Camera Finder
- 9.2.4. GPS Detector
- 9.2.5. Microphone Blocker
- 9.2.6. Audio Jammer
- 9.2.7. Counter Surveillance Apps
- 9.1. Market Analysis, Insights and Forecast - by Application
- 10. Asia Pacific Counter Espionage Device Analysis, Insights and Forecast, 2020-2032
- 10.1. Market Analysis, Insights and Forecast - by Application
- 10.1.1. Military
- 10.1.2. Homeland Security
- 10.1.3. Industrial
- 10.1.4. Telecommunications
- 10.1.5. R&D
- 10.1.6. Others
- 10.2. Market Analysis, Insights and Forecast - by Types
- 10.2.1. RF Detector
- 10.2.2. Wiretap Detector
- 10.2.3. Camera Finder
- 10.2.4. GPS Detector
- 10.2.5. Microphone Blocker
- 10.2.6. Audio Jammer
- 10.2.7. Counter Surveillance Apps
- 10.1. Market Analysis, Insights and Forecast - by Application
- 11. Competitive Analysis
- 11.1. Global Market Share Analysis 2025
- 11.2. Company Profiles
- 11.2.1 BAE Systems
- 11.2.1.1. Overview
- 11.2.1.2. Products
- 11.2.1.3. SWOT Analysis
- 11.2.1.4. Recent Developments
- 11.2.1.5. Financials (Based on Availability)
- 11.2.2 Lockheed Martin
- 11.2.2.1. Overview
- 11.2.2.2. Products
- 11.2.2.3. SWOT Analysis
- 11.2.2.4. Recent Developments
- 11.2.2.5. Financials (Based on Availability)
- 11.2.3 Northrop Grumman
- 11.2.3.1. Overview
- 11.2.3.2. Products
- 11.2.3.3. SWOT Analysis
- 11.2.3.4. Recent Developments
- 11.2.3.5. Financials (Based on Availability)
- 11.2.4 Raytheon
- 11.2.4.1. Overview
- 11.2.4.2. Products
- 11.2.4.3. SWOT Analysis
- 11.2.4.4. Recent Developments
- 11.2.4.5. Financials (Based on Availability)
- 11.2.5 Thales Group
- 11.2.5.1. Overview
- 11.2.5.2. Products
- 11.2.5.3. SWOT Analysis
- 11.2.5.4. Recent Developments
- 11.2.5.5. Financials (Based on Availability)
- 11.2.6 Saab AB
- 11.2.6.1. Overview
- 11.2.6.2. Products
- 11.2.6.3. SWOT Analysis
- 11.2.6.4. Recent Developments
- 11.2.6.5. Financials (Based on Availability)
- 11.2.7 Israel Aerospace Industries Ltd.
- 11.2.7.1. Overview
- 11.2.7.2. Products
- 11.2.7.3. SWOT Analysis
- 11.2.7.4. Recent Developments
- 11.2.7.5. Financials (Based on Availability)
- 11.2.8 L-3 Technologies
- 11.2.8.1. Overview
- 11.2.8.2. Products
- 11.2.8.3. SWOT Analysis
- 11.2.8.4. Recent Developments
- 11.2.8.5. Financials (Based on Availability)
- 11.2.9 Ultra Electronics
- 11.2.9.1. Overview
- 11.2.9.2. Products
- 11.2.9.3. SWOT Analysis
- 11.2.9.4. Recent Developments
- 11.2.9.5. Financials (Based on Availability)
- 11.2.10 Mercury Systems Inc.
- 11.2.10.1. Overview
- 11.2.10.2. Products
- 11.2.10.3. SWOT Analysis
- 11.2.10.4. Recent Developments
- 11.2.10.5. Financials (Based on Availability)
- 11.2.1 BAE Systems
List of Figures
- Figure 1: Global Counter Espionage Device Revenue Breakdown (million, %) by Region 2025 & 2033
- Figure 2: Global Counter Espionage Device Volume Breakdown (K, %) by Region 2025 & 2033
- Figure 3: North America Counter Espionage Device Revenue (million), by Application 2025 & 2033
- Figure 4: North America Counter Espionage Device Volume (K), by Application 2025 & 2033
- Figure 5: North America Counter Espionage Device Revenue Share (%), by Application 2025 & 2033
- Figure 6: North America Counter Espionage Device Volume Share (%), by Application 2025 & 2033
- Figure 7: North America Counter Espionage Device Revenue (million), by Types 2025 & 2033
- Figure 8: North America Counter Espionage Device Volume (K), by Types 2025 & 2033
- Figure 9: North America Counter Espionage Device Revenue Share (%), by Types 2025 & 2033
- Figure 10: North America Counter Espionage Device Volume Share (%), by Types 2025 & 2033
- Figure 11: North America Counter Espionage Device Revenue (million), by Country 2025 & 2033
- Figure 12: North America Counter Espionage Device Volume (K), by Country 2025 & 2033
- Figure 13: North America Counter Espionage Device Revenue Share (%), by Country 2025 & 2033
- Figure 14: North America Counter Espionage Device Volume Share (%), by Country 2025 & 2033
- Figure 15: South America Counter Espionage Device Revenue (million), by Application 2025 & 2033
- Figure 16: South America Counter Espionage Device Volume (K), by Application 2025 & 2033
- Figure 17: South America Counter Espionage Device Revenue Share (%), by Application 2025 & 2033
- Figure 18: South America Counter Espionage Device Volume Share (%), by Application 2025 & 2033
- Figure 19: South America Counter Espionage Device Revenue (million), by Types 2025 & 2033
- Figure 20: South America Counter Espionage Device Volume (K), by Types 2025 & 2033
- Figure 21: South America Counter Espionage Device Revenue Share (%), by Types 2025 & 2033
- Figure 22: South America Counter Espionage Device Volume Share (%), by Types 2025 & 2033
- Figure 23: South America Counter Espionage Device Revenue (million), by Country 2025 & 2033
- Figure 24: South America Counter Espionage Device Volume (K), by Country 2025 & 2033
- Figure 25: South America Counter Espionage Device Revenue Share (%), by Country 2025 & 2033
- Figure 26: South America Counter Espionage Device Volume Share (%), by Country 2025 & 2033
- Figure 27: Europe Counter Espionage Device Revenue (million), by Application 2025 & 2033
- Figure 28: Europe Counter Espionage Device Volume (K), by Application 2025 & 2033
- Figure 29: Europe Counter Espionage Device Revenue Share (%), by Application 2025 & 2033
- Figure 30: Europe Counter Espionage Device Volume Share (%), by Application 2025 & 2033
- Figure 31: Europe Counter Espionage Device Revenue (million), by Types 2025 & 2033
- Figure 32: Europe Counter Espionage Device Volume (K), by Types 2025 & 2033
- Figure 33: Europe Counter Espionage Device Revenue Share (%), by Types 2025 & 2033
- Figure 34: Europe Counter Espionage Device Volume Share (%), by Types 2025 & 2033
- Figure 35: Europe Counter Espionage Device Revenue (million), by Country 2025 & 2033
- Figure 36: Europe Counter Espionage Device Volume (K), by Country 2025 & 2033
- Figure 37: Europe Counter Espionage Device Revenue Share (%), by Country 2025 & 2033
- Figure 38: Europe Counter Espionage Device Volume Share (%), by Country 2025 & 2033
- Figure 39: Middle East & Africa Counter Espionage Device Revenue (million), by Application 2025 & 2033
- Figure 40: Middle East & Africa Counter Espionage Device Volume (K), by Application 2025 & 2033
- Figure 41: Middle East & Africa Counter Espionage Device Revenue Share (%), by Application 2025 & 2033
- Figure 42: Middle East & Africa Counter Espionage Device Volume Share (%), by Application 2025 & 2033
- Figure 43: Middle East & Africa Counter Espionage Device Revenue (million), by Types 2025 & 2033
- Figure 44: Middle East & Africa Counter Espionage Device Volume (K), by Types 2025 & 2033
- Figure 45: Middle East & Africa Counter Espionage Device Revenue Share (%), by Types 2025 & 2033
- Figure 46: Middle East & Africa Counter Espionage Device Volume Share (%), by Types 2025 & 2033
- Figure 47: Middle East & Africa Counter Espionage Device Revenue (million), by Country 2025 & 2033
- Figure 48: Middle East & Africa Counter Espionage Device Volume (K), by Country 2025 & 2033
- Figure 49: Middle East & Africa Counter Espionage Device Revenue Share (%), by Country 2025 & 2033
- Figure 50: Middle East & Africa Counter Espionage Device Volume Share (%), by Country 2025 & 2033
- Figure 51: Asia Pacific Counter Espionage Device Revenue (million), by Application 2025 & 2033
- Figure 52: Asia Pacific Counter Espionage Device Volume (K), by Application 2025 & 2033
- Figure 53: Asia Pacific Counter Espionage Device Revenue Share (%), by Application 2025 & 2033
- Figure 54: Asia Pacific Counter Espionage Device Volume Share (%), by Application 2025 & 2033
- Figure 55: Asia Pacific Counter Espionage Device Revenue (million), by Types 2025 & 2033
- Figure 56: Asia Pacific Counter Espionage Device Volume (K), by Types 2025 & 2033
- Figure 57: Asia Pacific Counter Espionage Device Revenue Share (%), by Types 2025 & 2033
- Figure 58: Asia Pacific Counter Espionage Device Volume Share (%), by Types 2025 & 2033
- Figure 59: Asia Pacific Counter Espionage Device Revenue (million), by Country 2025 & 2033
- Figure 60: Asia Pacific Counter Espionage Device Volume (K), by Country 2025 & 2033
- Figure 61: Asia Pacific Counter Espionage Device Revenue Share (%), by Country 2025 & 2033
- Figure 62: Asia Pacific Counter Espionage Device Volume Share (%), by Country 2025 & 2033
List of Tables
- Table 1: Global Counter Espionage Device Revenue million Forecast, by Application 2020 & 2033
- Table 2: Global Counter Espionage Device Volume K Forecast, by Application 2020 & 2033
- Table 3: Global Counter Espionage Device Revenue million Forecast, by Types 2020 & 2033
- Table 4: Global Counter Espionage Device Volume K Forecast, by Types 2020 & 2033
- Table 5: Global Counter Espionage Device Revenue million Forecast, by Region 2020 & 2033
- Table 6: Global Counter Espionage Device Volume K Forecast, by Region 2020 & 2033
- Table 7: Global Counter Espionage Device Revenue million Forecast, by Application 2020 & 2033
- Table 8: Global Counter Espionage Device Volume K Forecast, by Application 2020 & 2033
- Table 9: Global Counter Espionage Device Revenue million Forecast, by Types 2020 & 2033
- Table 10: Global Counter Espionage Device Volume K Forecast, by Types 2020 & 2033
- Table 11: Global Counter Espionage Device Revenue million Forecast, by Country 2020 & 2033
- Table 12: Global Counter Espionage Device Volume K Forecast, by Country 2020 & 2033
- Table 13: United States Counter Espionage Device Revenue (million) Forecast, by Application 2020 & 2033
- Table 14: United States Counter Espionage Device Volume (K) Forecast, by Application 2020 & 2033
- Table 15: Canada Counter Espionage Device Revenue (million) Forecast, by Application 2020 & 2033
- Table 16: Canada Counter Espionage Device Volume (K) Forecast, by Application 2020 & 2033
- Table 17: Mexico Counter Espionage Device Revenue (million) Forecast, by Application 2020 & 2033
- Table 18: Mexico Counter Espionage Device Volume (K) Forecast, by Application 2020 & 2033
- Table 19: Global Counter Espionage Device Revenue million Forecast, by Application 2020 & 2033
- Table 20: Global Counter Espionage Device Volume K Forecast, by Application 2020 & 2033
- Table 21: Global Counter Espionage Device Revenue million Forecast, by Types 2020 & 2033
- Table 22: Global Counter Espionage Device Volume K Forecast, by Types 2020 & 2033
- Table 23: Global Counter Espionage Device Revenue million Forecast, by Country 2020 & 2033
- Table 24: Global Counter Espionage Device Volume K Forecast, by Country 2020 & 2033
- Table 25: Brazil Counter Espionage Device Revenue (million) Forecast, by Application 2020 & 2033
- Table 26: Brazil Counter Espionage Device Volume (K) Forecast, by Application 2020 & 2033
- Table 27: Argentina Counter Espionage Device Revenue (million) Forecast, by Application 2020 & 2033
- Table 28: Argentina Counter Espionage Device Volume (K) Forecast, by Application 2020 & 2033
- Table 29: Rest of South America Counter Espionage Device Revenue (million) Forecast, by Application 2020 & 2033
- Table 30: Rest of South America Counter Espionage Device Volume (K) Forecast, by Application 2020 & 2033
- Table 31: Global Counter Espionage Device Revenue million Forecast, by Application 2020 & 2033
- Table 32: Global Counter Espionage Device Volume K Forecast, by Application 2020 & 2033
- Table 33: Global Counter Espionage Device Revenue million Forecast, by Types 2020 & 2033
- Table 34: Global Counter Espionage Device Volume K Forecast, by Types 2020 & 2033
- Table 35: Global Counter Espionage Device Revenue million Forecast, by Country 2020 & 2033
- Table 36: Global Counter Espionage Device Volume K Forecast, by Country 2020 & 2033
- Table 37: United Kingdom Counter Espionage Device Revenue (million) Forecast, by Application 2020 & 2033
- Table 38: United Kingdom Counter Espionage Device Volume (K) Forecast, by Application 2020 & 2033
- Table 39: Germany Counter Espionage Device Revenue (million) Forecast, by Application 2020 & 2033
- Table 40: Germany Counter Espionage Device Volume (K) Forecast, by Application 2020 & 2033
- Table 41: France Counter Espionage Device Revenue (million) Forecast, by Application 2020 & 2033
- Table 42: France Counter Espionage Device Volume (K) Forecast, by Application 2020 & 2033
- Table 43: Italy Counter Espionage Device Revenue (million) Forecast, by Application 2020 & 2033
- Table 44: Italy Counter Espionage Device Volume (K) Forecast, by Application 2020 & 2033
- Table 45: Spain Counter Espionage Device Revenue (million) Forecast, by Application 2020 & 2033
- Table 46: Spain Counter Espionage Device Volume (K) Forecast, by Application 2020 & 2033
- Table 47: Russia Counter Espionage Device Revenue (million) Forecast, by Application 2020 & 2033
- Table 48: Russia Counter Espionage Device Volume (K) Forecast, by Application 2020 & 2033
- Table 49: Benelux Counter Espionage Device Revenue (million) Forecast, by Application 2020 & 2033
- Table 50: Benelux Counter Espionage Device Volume (K) Forecast, by Application 2020 & 2033
- Table 51: Nordics Counter Espionage Device Revenue (million) Forecast, by Application 2020 & 2033
- Table 52: Nordics Counter Espionage Device Volume (K) Forecast, by Application 2020 & 2033
- Table 53: Rest of Europe Counter Espionage Device Revenue (million) Forecast, by Application 2020 & 2033
- Table 54: Rest of Europe Counter Espionage Device Volume (K) Forecast, by Application 2020 & 2033
- Table 55: Global Counter Espionage Device Revenue million Forecast, by Application 2020 & 2033
- Table 56: Global Counter Espionage Device Volume K Forecast, by Application 2020 & 2033
- Table 57: Global Counter Espionage Device Revenue million Forecast, by Types 2020 & 2033
- Table 58: Global Counter Espionage Device Volume K Forecast, by Types 2020 & 2033
- Table 59: Global Counter Espionage Device Revenue million Forecast, by Country 2020 & 2033
- Table 60: Global Counter Espionage Device Volume K Forecast, by Country 2020 & 2033
- Table 61: Turkey Counter Espionage Device Revenue (million) Forecast, by Application 2020 & 2033
- Table 62: Turkey Counter Espionage Device Volume (K) Forecast, by Application 2020 & 2033
- Table 63: Israel Counter Espionage Device Revenue (million) Forecast, by Application 2020 & 2033
- Table 64: Israel Counter Espionage Device Volume (K) Forecast, by Application 2020 & 2033
- Table 65: GCC Counter Espionage Device Revenue (million) Forecast, by Application 2020 & 2033
- Table 66: GCC Counter Espionage Device Volume (K) Forecast, by Application 2020 & 2033
- Table 67: North Africa Counter Espionage Device Revenue (million) Forecast, by Application 2020 & 2033
- Table 68: North Africa Counter Espionage Device Volume (K) Forecast, by Application 2020 & 2033
- Table 69: South Africa Counter Espionage Device Revenue (million) Forecast, by Application 2020 & 2033
- Table 70: South Africa Counter Espionage Device Volume (K) Forecast, by Application 2020 & 2033
- Table 71: Rest of Middle East & Africa Counter Espionage Device Revenue (million) Forecast, by Application 2020 & 2033
- Table 72: Rest of Middle East & Africa Counter Espionage Device Volume (K) Forecast, by Application 2020 & 2033
- Table 73: Global Counter Espionage Device Revenue million Forecast, by Application 2020 & 2033
- Table 74: Global Counter Espionage Device Volume K Forecast, by Application 2020 & 2033
- Table 75: Global Counter Espionage Device Revenue million Forecast, by Types 2020 & 2033
- Table 76: Global Counter Espionage Device Volume K Forecast, by Types 2020 & 2033
- Table 77: Global Counter Espionage Device Revenue million Forecast, by Country 2020 & 2033
- Table 78: Global Counter Espionage Device Volume K Forecast, by Country 2020 & 2033
- Table 79: China Counter Espionage Device Revenue (million) Forecast, by Application 2020 & 2033
- Table 80: China Counter Espionage Device Volume (K) Forecast, by Application 2020 & 2033
- Table 81: India Counter Espionage Device Revenue (million) Forecast, by Application 2020 & 2033
- Table 82: India Counter Espionage Device Volume (K) Forecast, by Application 2020 & 2033
- Table 83: Japan Counter Espionage Device Revenue (million) Forecast, by Application 2020 & 2033
- Table 84: Japan Counter Espionage Device Volume (K) Forecast, by Application 2020 & 2033
- Table 85: South Korea Counter Espionage Device Revenue (million) Forecast, by Application 2020 & 2033
- Table 86: South Korea Counter Espionage Device Volume (K) Forecast, by Application 2020 & 2033
- Table 87: ASEAN Counter Espionage Device Revenue (million) Forecast, by Application 2020 & 2033
- Table 88: ASEAN Counter Espionage Device Volume (K) Forecast, by Application 2020 & 2033
- Table 89: Oceania Counter Espionage Device Revenue (million) Forecast, by Application 2020 & 2033
- Table 90: Oceania Counter Espionage Device Volume (K) Forecast, by Application 2020 & 2033
- Table 91: Rest of Asia Pacific Counter Espionage Device Revenue (million) Forecast, by Application 2020 & 2033
- Table 92: Rest of Asia Pacific Counter Espionage Device Volume (K) Forecast, by Application 2020 & 2033
Frequently Asked Questions
1. What is the projected Compound Annual Growth Rate (CAGR) of the Counter Espionage Device?
The projected CAGR is approximately XX%.
2. Which companies are prominent players in the Counter Espionage Device?
Key companies in the market include BAE Systems, Lockheed Martin, Northrop Grumman, Raytheon, Thales Group, Saab AB, Israel Aerospace Industries Ltd., L-3 Technologies, Ultra Electronics, Mercury Systems Inc..
3. What are the main segments of the Counter Espionage Device?
The market segments include Application, Types.
4. Can you provide details about the market size?
The market size is estimated to be USD XXX million as of 2022.
5. What are some drivers contributing to market growth?
N/A
6. What are the notable trends driving market growth?
N/A
7. Are there any restraints impacting market growth?
N/A
8. Can you provide examples of recent developments in the market?
N/A
9. What pricing options are available for accessing the report?
Pricing options include single-user, multi-user, and enterprise licenses priced at USD 3350.00, USD 5025.00, and USD 6700.00 respectively.
10. Is the market size provided in terms of value or volume?
The market size is provided in terms of value, measured in million and volume, measured in K.
11. Are there any specific market keywords associated with the report?
Yes, the market keyword associated with the report is "Counter Espionage Device," which aids in identifying and referencing the specific market segment covered.
12. How do I determine which pricing option suits my needs best?
The pricing options vary based on user requirements and access needs. Individual users may opt for single-user licenses, while businesses requiring broader access may choose multi-user or enterprise licenses for cost-effective access to the report.
13. Are there any additional resources or data provided in the Counter Espionage Device report?
While the report offers comprehensive insights, it's advisable to review the specific contents or supplementary materials provided to ascertain if additional resources or data are available.
14. How can I stay updated on further developments or reports in the Counter Espionage Device?
To stay informed about further developments, trends, and reports in the Counter Espionage Device, consider subscribing to industry newsletters, following relevant companies and organizations, or regularly checking reputable industry news sources and publications.
Methodology
Step 1 - Identification of Relevant Samples Size from Population Database


Step 2 - Approaches for Defining Global Market Size (Value, Volume* & Price*)

Note*: In applicable scenarios
Step 3 - Data Sources
Primary Research
- Web Analytics
- Survey Reports
- Research Institute
- Latest Research Reports
- Opinion Leaders
Secondary Research
- Annual Reports
- White Paper
- Latest Press Release
- Industry Association
- Paid Database
- Investor Presentations

Step 4 - Data Triangulation
Involves using different sources of information in order to increase the validity of a study
These sources are likely to be stakeholders in a program - participants, other researchers, program staff, other community members, and so on.
Then we put all data in single framework & apply various statistical tools to find out the dynamic on the market.
During the analysis stage, feedback from the stakeholder groups would be compared to determine areas of agreement as well as areas of divergence