

Key Insights
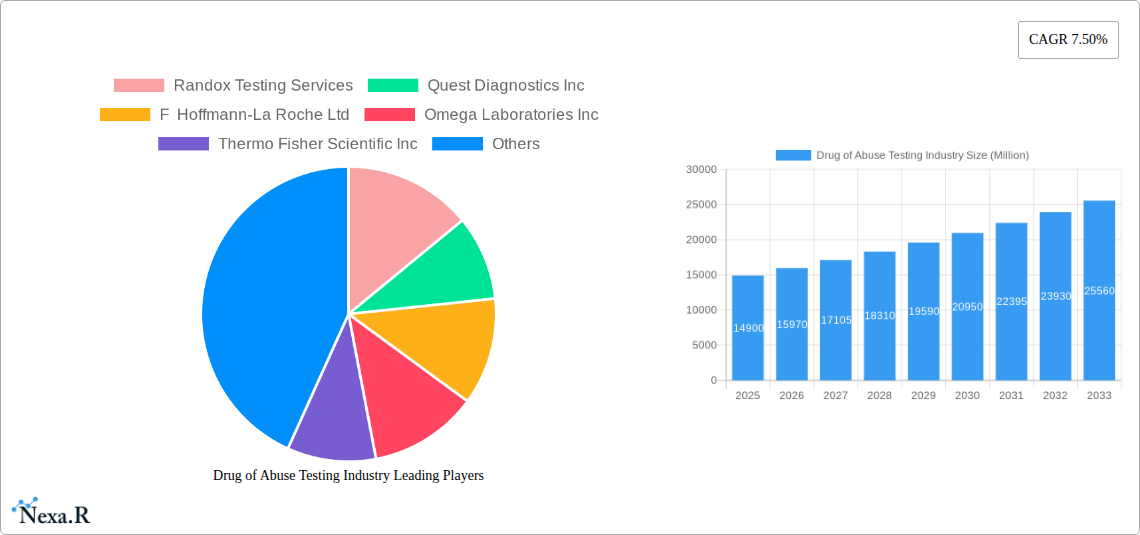
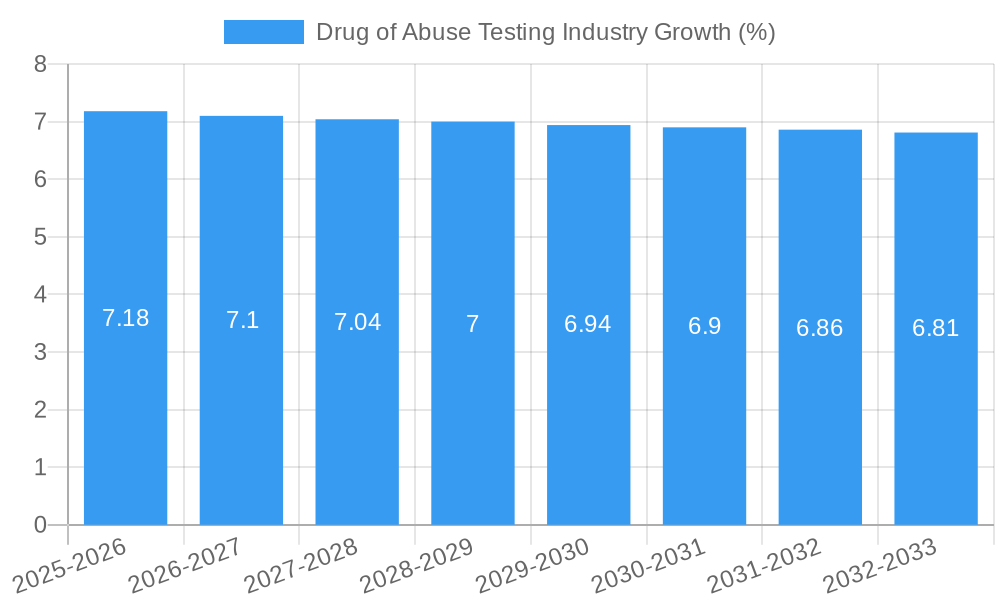
The global Drug of Abuse Testing market is poised for substantial growth, projected to reach a significant market size of approximately $14,900 million by 2025, with a robust Compound Annual Growth Rate (CAGR) of 7.50% over the forecast period. This expansion is primarily fueled by escalating concerns surrounding substance abuse, increasing regulatory mandates for workplace drug testing, and the growing adoption of advanced testing technologies in healthcare and forensic settings. The market's dynamism is evident in its diverse segments, with analyzers, particularly immunoassay and chromatographic devices, leading the product type landscape due to their precision and speed. Rapid testing devices, offering convenience and on-site capabilities, are also experiencing significant traction. Blood and urine are anticipated to remain dominant sample types, owing to their established reliability in detecting a wide range of substances.
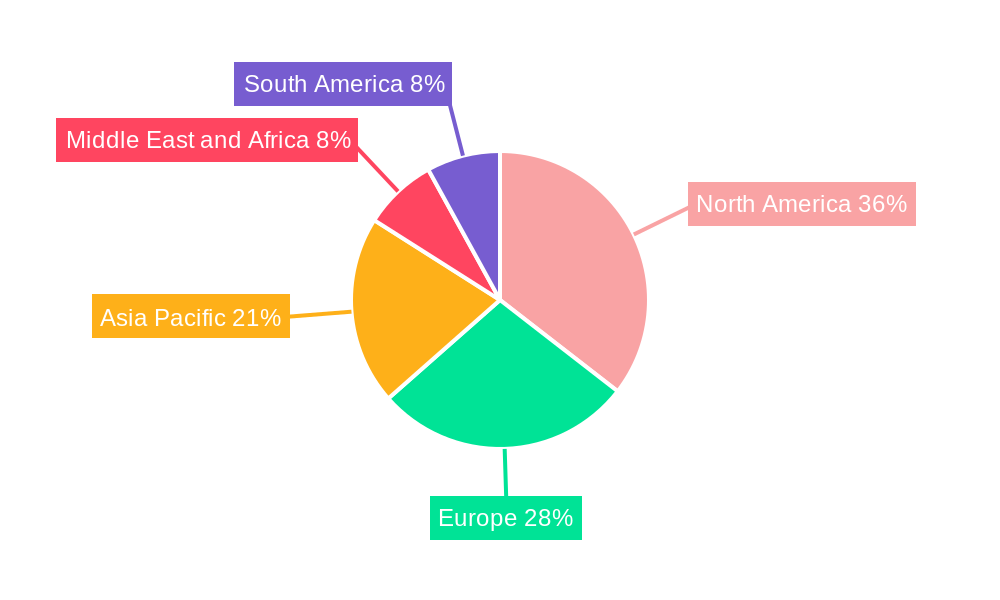
Further driving this market's upward trajectory are emerging trends such as the development of more sensitive and specific immunoassay techniques, point-of-care testing solutions, and the integration of digital technologies for data management and reporting. The increasing demand for pre-employment and random drug screening programs across various industries, coupled with rising awareness about the health and societal impacts of drug abuse, are key growth accelerators. Geographically, North America is expected to maintain its leading position, driven by stringent regulations and a well-established healthcare infrastructure. The Asia Pacific region, however, is anticipated to exhibit the fastest growth, fueled by expanding healthcare access, rising disposable incomes, and increasing government initiatives to combat drug abuse. Despite the promising outlook, challenges such as the high cost of advanced testing equipment and potential for false positives in certain testing methods could present moderate restraints to market expansion.
Comprehensive Drug of Abuse Testing Market Report: Global Insights, Trends, and Forecasts (2019-2033)
This in-depth market research report offers a definitive analysis of the global Drug of Abuse Testing industry, providing crucial insights for stakeholders across diagnostic laboratories, hospitals, forensic institutions, and other end-user segments. Examining market dynamics, growth trends, regional dominance, product innovations, and key players, this report equips you with the actionable intelligence needed to navigate this evolving landscape. With a study period spanning from 2019 to 2033, a base year of 2025, and a forecast period from 2025 to 2033, this analysis provides a robust understanding of the market's past, present, and future trajectory. The report leverages data presented in Million units for all quantitative market values.
Drug of Abuse Testing Industry Market Dynamics & Structure
The Drug of Abuse Testing industry is characterized by a moderately consolidated market structure, driven by significant technological innovations in immunoassay and chromatographic detection methods. Regulatory frameworks, particularly in North America and Europe, play a pivotal role in shaping market access and product development, with increasing scrutiny on emerging synthetic opioids. Competitive substitutes, primarily manual screening methods and a growing number of point-of-care rapid testing devices, present a dynamic competitive landscape. End-user demographics are shifting, with a heightened demand from forensic laboratories for accurate and legally defensible results, and from healthcare providers for rapid identification of substance abuse. Mergers and acquisitions (M&A) are a notable trend, with larger players acquiring smaller innovative companies to expand their product portfolios and geographic reach. For instance, the market is expected to witness an average of 5-7 M&A deals annually within the forecast period, with an average deal value of USD 50-100 Million. Innovation barriers include the high cost of R&D for novel immunoassay development and the need for stringent regulatory approvals for new analytical platforms.
- Market Concentration: Moderately consolidated, with key players holding significant market share.
- Technological Innovation Drivers: Advancements in immunoassay sensitivity, liquid chromatography-mass spectrometry (LC-MS) for complex drug panels, and miniaturized breathalyzer technology.
- Regulatory Frameworks: Stringent regulations in North America and Europe influencing product approval and testing protocols.
- Competitive Product Substitutes: Rapid testing devices, advanced screening algorithms, and alternative detection technologies.
- End-User Demographics: Increasing demand from forensic science, workplace safety programs, and clinical settings for comprehensive drug profiling.
- M&A Trends: Strategic acquisitions to enhance technological capabilities and market penetration.
Drug of Abuse Testing Industry Growth Trends & Insights
The global Drug of Abuse Testing market is poised for substantial growth, projected to expand at a Compound Annual Growth Rate (CAGR) of approximately 7.5% during the forecast period of 2025–2033. This growth trajectory is fueled by an increasing global prevalence of drug abuse, coupled with a greater emphasis on public health initiatives and stringent drug enforcement policies. The market size, valued at an estimated USD 4,500 Million in 2025, is expected to reach USD 7,500 Million by 2033. Adoption rates for advanced testing methodologies, such as LC-MS/MS, are rising due to their superior sensitivity and specificity in detecting a wider array of illicit substances and prescription drug abuse. Technological disruptions, including the development of more sensitive and user-friendly rapid testing devices for saliva and urine, are expanding market penetration beyond traditional laboratory settings. Consumer behavior shifts are also evident, with a growing awareness among individuals about the importance of drug testing in various contexts, including personal health management and workplace safety. The increasing demand for multiplex testing, capable of identifying multiple drug classes from a single sample, is a significant trend. Furthermore, the expanding use of drug testing in pain management clinics to monitor patient compliance and prevent diversion of prescription opioids is contributing significantly to market growth. The rising incidence of synthetic drug use, particularly fentanyl and its analogues, is driving demand for specialized testing solutions with lower detection limits. The historical period (2019–2024) saw consistent growth, albeit at a slightly lower CAGR, as awareness and infrastructure for drug testing were still maturing. The base year of 2025 serves as a pivotal point for projecting this accelerated growth driven by technological advancements and increasing societal focus on combating substance abuse. The integration of artificial intelligence (AI) in interpreting complex drug testing data and predicting addiction patterns is an emerging area with considerable potential to enhance the effectiveness of drug abuse interventions.
Dominant Regions, Countries, or Segments in Drug of Abuse Testing Industry
The Drug of Abuse Testing industry is currently dominated by North America, particularly the United States, which is projected to account for an estimated 45% of the global market share in 2025. This dominance is underpinned by a robust regulatory environment that mandates pre-employment, random, and post-accident drug testing across various industries, including transportation, healthcare, and construction. Significant government funding allocated towards combating the opioid crisis and increased public health awareness initiatives further amplify demand in this region. Economically, the presence of major diagnostic laboratories and testing service providers, such as Quest Diagnostics Inc, LabCorp, and Thermo Fisher Scientific Inc, provides a strong infrastructure for widespread testing.
Within the Product Type segment, Analyzers, specifically Immunoassay Analyzers and Chromatographic Devices, hold a substantial market share, estimated at over 60% of the total analyzer market in 2025, due to their high throughput and accuracy in clinical and forensic settings. However, Rapid Testing Devices, particularly Urine Testing Devices, are experiencing rapid growth and are projected to capture a significant portion of the market due to their cost-effectiveness, ease of use, and suitability for point-of-care applications, with an estimated market size of USD 1,800 Million in 2025.
In terms of Sample Type, Urine remains the most prevalent sample type, accounting for approximately 70% of all drug abuse tests conducted globally, owing to its ease of collection and established testing protocols. However, Saliva and Oral Fluid Testing Devices are gaining traction due to their non-invasive nature and the ability to detect recent drug use, with an anticipated market share of 15% in 2025, valued at approximately USD 675 Million.
The End User segment is primarily driven by Diagnostic Laboratories, which are expected to contribute over 40% of the market revenue in 2025. Forensic Laboratories are also a key segment, demanding high accuracy and tamper-proof testing solutions, with an estimated market size of USD 1,200 Million in 2025. The increasing integration of drug testing within healthcare settings, particularly for pain management and addiction treatment, is also a significant growth driver.
- Dominant Region: North America (especially the United States) due to strong regulatory mandates and public health focus.
- Key Product Segments: Immunoassay Analyzers and Chromatographic Devices for accuracy; Urine Testing Devices for widespread accessibility and cost-effectiveness.
- Prevalent Sample Type: Urine, due to established protocols and ease of collection.
- Leading End-Users: Diagnostic Laboratories and Forensic Laboratories requiring high accuracy and reliability.
- Growth Potential: Rapid Testing Devices and Oral Fluid Testing Devices show significant expansion potential due to convenience and non-invasiveness.
Drug of Abuse Testing Industry Product Landscape
The product landscape of the Drug of Abuse Testing industry is marked by continuous innovation aimed at enhancing sensitivity, specificity, and ease of use. Key product categories include sophisticated Immunoassay Analyzers and Chromatographic Devices (like GC-MS and LC-MS/MS) that offer comprehensive drug profiling with high accuracy for clinical and forensic applications. Alongside these, a robust market exists for Rapid Testing Devices, including urine and oral fluid test kits, favored for their cost-effectiveness and quick results in point-of-care settings. Consumables, such as reagents and sample collection kits, form a crucial supporting segment. Unique selling propositions revolve around rapid detection of emerging synthetic drugs, increased multiplexing capabilities to test for a broader drug panel from a single sample, and user-friendly interfaces for both laboratory professionals and frontline testers.
Key Drivers, Barriers & Challenges in Drug of Abuse Testing Industry
Key Drivers:
- Rising Global Drug Abuse Prevalence: The increasing incidence of substance abuse worldwide directly fuels the demand for effective drug testing solutions.
- Stringent Regulatory Frameworks: Government mandates for workplace safety, driving fitness, and criminal justice applications necessitate widespread drug testing.
- Technological Advancements: Development of more sensitive, specific, and rapid testing technologies, including point-of-care devices and advanced laboratory instrumentation.
- Increased Awareness and Harm Reduction Strategies: Growing societal recognition of the impact of drug abuse and the implementation of harm reduction programs that often incorporate testing.
Key Barriers & Challenges:
- High Cost of Advanced Instrumentation: Sophisticated laboratory equipment can be a significant capital investment for smaller entities.
- Regulatory Hurdles and Approval Processes: Obtaining approvals for new testing devices and methodologies can be lengthy and complex.
- Development of Novel Synthetic Drugs: The continuous emergence of new designer drugs challenges the adaptability of existing testing panels.
- Data Interpretation and False Positives/Negatives: Ensuring accuracy and managing potential misinterpretations of test results remains a challenge.
- Supply Chain Disruptions: Global events can impact the availability of critical reagents and consumables, affecting testing volumes.
Emerging Opportunities in Drug of Abuse Testing Industry
Emerging opportunities within the Drug of Abuse Testing industry lie in the development of advanced AI-powered diagnostic tools that can predict addiction risk and personalize treatment plans. The growing demand for at-home testing kits for personal health monitoring and the expanding market for drug testing in veterinary applications also present significant untapped potential. Furthermore, the increasing focus on mental health and addiction services is creating a demand for integrated testing solutions that can provide comprehensive insights into patient well-being, thereby facilitating more effective interventions. The development of rapid, portable devices for on-site testing in remote or underserved areas is another promising avenue for market expansion.
Growth Accelerators in the Drug of Abuse Testing Industry Industry
Growth in the Drug of Abuse Testing industry is significantly accelerated by ongoing technological breakthroughs that enhance the speed, accuracy, and comprehensiveness of drug detection. Strategic partnerships between technology developers and large healthcare providers or government agencies are crucial for wider adoption and market penetration. Market expansion strategies, including targeting emerging economies with increasing drug abuse issues and implementing widespread workplace drug testing programs, will further propel growth. The development of standardized testing protocols across different regions and industries will also contribute to a more cohesive and robust market expansion.
Key Players Shaping the Drug of Abuse Testing Industry Market
- Randox Testing Services
- Quest Diagnostics Inc
- F Hoffmann-La Roche Ltd
- Omega Laboratories Inc
- Thermo Fisher Scientific Inc
- Abbott Laboratories
- Psychemedics Corporation
- Cordant Health Solutions
- Siemens Healthineers AG
- Clinical Reference Laboratory Inc
- United States Drug Testing Laboratories Inc (USDTL)
- Dragerwerk AG & Co KGaA
- Danaher Corporation (Beckman Coulter)
- Precision Diagnostics
- LabCorp
Notable Milestones in Drug of Abuse Testing Industry Sector
- August 2022: Delaware Division of Public Health initiated inclusion of fentanyl strips in Narcan kits as part of a harm-reduction strategy to prevent accidental fentanyl overdoses.
- June 2022: Punjab Government, India launched a drug screening drive in jails, testing over 8,000 prisoners across 14 jails and identifying 42% as drug addicts.
In-Depth Drug of Abuse Testing Industry Market Outlook
The outlook for the Drug of Abuse Testing industry remains exceptionally positive, driven by a confluence of factors including persistent global drug abuse challenges, relentless technological innovation, and evolving public health priorities. Growth accelerators such as the development of next-generation diagnostic assays capable of detecting a wider spectrum of novel psychoactive substances and enhanced point-of-care testing solutions will continue to expand market reach. Strategic collaborations between industry players, academic institutions, and government bodies will foster a more integrated approach to combating substance abuse. The increasing emphasis on personalized medicine and data-driven interventions in addiction treatment further solidifies the market's future potential, promising sustained growth and innovation.
Drug of Abuse Testing Industry Segmentation
-
1. Product Type
-
1.1. Analyzers
- 1.1.1. Immunoassay Analyzers
- 1.1.2. Chromatographic Devices
- 1.1.3. Breath Analyzers
-
1.2. Rapid Testing Devices
- 1.2.1. Urine Testing Devices
- 1.2.2. Oral Fluid Testing Devices
- 1.3. Consumables
-
1.1. Analyzers
-
2. Sample Type
- 2.1. Saliva
- 2.2. Urine
- 2.3. Blood
- 2.4. Other Sample Types
-
3. End User
- 3.1. Hospitals
- 3.2. Diagnostic Laboratories
- 3.3. Forensic Laboratories
- 3.4. Other End Users
Drug of Abuse Testing Industry Segmentation By Geography
-
1. North America
- 1.1. United States
- 1.2. Canada
- 1.3. Mexico
-
2. Europe
- 2.1. Germany
- 2.2. United Kingdom
- 2.3. France
- 2.4. Italy
- 2.5. Spain
- 2.6. Rest of Europe
-
3. Asia Pacific
- 3.1. China
- 3.2. Japan
- 3.3. India
- 3.4. Australia
- 3.5. South Korea
- 3.6. Rest of Asia Pacific
-
4. Middle East and Africa
- 4.1. GCC
- 4.2. South Africa
- 4.3. Rest of Middle East and Africa
-
5. South America
- 5.1. Brazil
- 5.2. Argentina
- 5.3. Rest of South America
Drug of Abuse Testing Industry REPORT HIGHLIGHTS
| Aspects | Details |
|---|---|
| Study Period | 2019-2033 |
| Base Year | 2024 |
| Estimated Year | 2025 |
| Forecast Period | 2025-2033 |
| Historical Period | 2019-2024 |
| Growth Rate | CAGR of 7.50% from 2019-2033 |
| Segmentation |
|
Table of Contents
- 1. Introduction
- 1.1. Research Scope
- 1.2. Market Segmentation
- 1.3. Research Methodology
- 1.4. Definitions and Assumptions
- 2. Executive Summary
- 2.1. Introduction
- 3. Market Dynamics
- 3.1. Introduction
- 3.2. Market Drivers
- 3.2.1. Increasing Demand for Drug Abuse Treatment; Stringent Law Mandating Alcohol and Drug Testing; Rising Drug-related Mortality and Increasing Government Initiatives
- 3.3. Market Restrains
- 3.3.1. Perception of Drug Abuse Testing as a Violation of Rights; Lack of Awareness Regarding the Availability of Advanced Drug Testing Devices
- 3.4. Market Trends
- 3.4.1. The Urine Segment is Expected to Dominate in the Market Over the Forecast Period
- 4. Market Factor Analysis
- 4.1. Porters Five Forces
- 4.2. Supply/Value Chain
- 4.3. PESTEL analysis
- 4.4. Market Entropy
- 4.5. Patent/Trademark Analysis
- 5. Global Drug of Abuse Testing Industry Analysis, Insights and Forecast, 2019-2031
- 5.1. Market Analysis, Insights and Forecast - by Product Type
- 5.1.1. Analyzers
- 5.1.1.1. Immunoassay Analyzers
- 5.1.1.2. Chromatographic Devices
- 5.1.1.3. Breath Analyzers
- 5.1.2. Rapid Testing Devices
- 5.1.2.1. Urine Testing Devices
- 5.1.2.2. Oral Fluid Testing Devices
- 5.1.3. Consumables
- 5.1.1. Analyzers
- 5.2. Market Analysis, Insights and Forecast - by Sample Type
- 5.2.1. Saliva
- 5.2.2. Urine
- 5.2.3. Blood
- 5.2.4. Other Sample Types
- 5.3. Market Analysis, Insights and Forecast - by End User
- 5.3.1. Hospitals
- 5.3.2. Diagnostic Laboratories
- 5.3.3. Forensic Laboratories
- 5.3.4. Other End Users
- 5.4. Market Analysis, Insights and Forecast - by Region
- 5.4.1. North America
- 5.4.2. Europe
- 5.4.3. Asia Pacific
- 5.4.4. Middle East and Africa
- 5.4.5. South America
- 5.1. Market Analysis, Insights and Forecast - by Product Type
- 6. North America Drug of Abuse Testing Industry Analysis, Insights and Forecast, 2019-2031
- 6.1. Market Analysis, Insights and Forecast - by Product Type
- 6.1.1. Analyzers
- 6.1.1.1. Immunoassay Analyzers
- 6.1.1.2. Chromatographic Devices
- 6.1.1.3. Breath Analyzers
- 6.1.2. Rapid Testing Devices
- 6.1.2.1. Urine Testing Devices
- 6.1.2.2. Oral Fluid Testing Devices
- 6.1.3. Consumables
- 6.1.1. Analyzers
- 6.2. Market Analysis, Insights and Forecast - by Sample Type
- 6.2.1. Saliva
- 6.2.2. Urine
- 6.2.3. Blood
- 6.2.4. Other Sample Types
- 6.3. Market Analysis, Insights and Forecast - by End User
- 6.3.1. Hospitals
- 6.3.2. Diagnostic Laboratories
- 6.3.3. Forensic Laboratories
- 6.3.4. Other End Users
- 6.1. Market Analysis, Insights and Forecast - by Product Type
- 7. Europe Drug of Abuse Testing Industry Analysis, Insights and Forecast, 2019-2031
- 7.1. Market Analysis, Insights and Forecast - by Product Type
- 7.1.1. Analyzers
- 7.1.1.1. Immunoassay Analyzers
- 7.1.1.2. Chromatographic Devices
- 7.1.1.3. Breath Analyzers
- 7.1.2. Rapid Testing Devices
- 7.1.2.1. Urine Testing Devices
- 7.1.2.2. Oral Fluid Testing Devices
- 7.1.3. Consumables
- 7.1.1. Analyzers
- 7.2. Market Analysis, Insights and Forecast - by Sample Type
- 7.2.1. Saliva
- 7.2.2. Urine
- 7.2.3. Blood
- 7.2.4. Other Sample Types
- 7.3. Market Analysis, Insights and Forecast - by End User
- 7.3.1. Hospitals
- 7.3.2. Diagnostic Laboratories
- 7.3.3. Forensic Laboratories
- 7.3.4. Other End Users
- 7.1. Market Analysis, Insights and Forecast - by Product Type
- 8. Asia Pacific Drug of Abuse Testing Industry Analysis, Insights and Forecast, 2019-2031
- 8.1. Market Analysis, Insights and Forecast - by Product Type
- 8.1.1. Analyzers
- 8.1.1.1. Immunoassay Analyzers
- 8.1.1.2. Chromatographic Devices
- 8.1.1.3. Breath Analyzers
- 8.1.2. Rapid Testing Devices
- 8.1.2.1. Urine Testing Devices
- 8.1.2.2. Oral Fluid Testing Devices
- 8.1.3. Consumables
- 8.1.1. Analyzers
- 8.2. Market Analysis, Insights and Forecast - by Sample Type
- 8.2.1. Saliva
- 8.2.2. Urine
- 8.2.3. Blood
- 8.2.4. Other Sample Types
- 8.3. Market Analysis, Insights and Forecast - by End User
- 8.3.1. Hospitals
- 8.3.2. Diagnostic Laboratories
- 8.3.3. Forensic Laboratories
- 8.3.4. Other End Users
- 8.1. Market Analysis, Insights and Forecast - by Product Type
- 9. Middle East and Africa Drug of Abuse Testing Industry Analysis, Insights and Forecast, 2019-2031
- 9.1. Market Analysis, Insights and Forecast - by Product Type
- 9.1.1. Analyzers
- 9.1.1.1. Immunoassay Analyzers
- 9.1.1.2. Chromatographic Devices
- 9.1.1.3. Breath Analyzers
- 9.1.2. Rapid Testing Devices
- 9.1.2.1. Urine Testing Devices
- 9.1.2.2. Oral Fluid Testing Devices
- 9.1.3. Consumables
- 9.1.1. Analyzers
- 9.2. Market Analysis, Insights and Forecast - by Sample Type
- 9.2.1. Saliva
- 9.2.2. Urine
- 9.2.3. Blood
- 9.2.4. Other Sample Types
- 9.3. Market Analysis, Insights and Forecast - by End User
- 9.3.1. Hospitals
- 9.3.2. Diagnostic Laboratories
- 9.3.3. Forensic Laboratories
- 9.3.4. Other End Users
- 9.1. Market Analysis, Insights and Forecast - by Product Type
- 10. South America Drug of Abuse Testing Industry Analysis, Insights and Forecast, 2019-2031
- 10.1. Market Analysis, Insights and Forecast - by Product Type
- 10.1.1. Analyzers
- 10.1.1.1. Immunoassay Analyzers
- 10.1.1.2. Chromatographic Devices
- 10.1.1.3. Breath Analyzers
- 10.1.2. Rapid Testing Devices
- 10.1.2.1. Urine Testing Devices
- 10.1.2.2. Oral Fluid Testing Devices
- 10.1.3. Consumables
- 10.1.1. Analyzers
- 10.2. Market Analysis, Insights and Forecast - by Sample Type
- 10.2.1. Saliva
- 10.2.2. Urine
- 10.2.3. Blood
- 10.2.4. Other Sample Types
- 10.3. Market Analysis, Insights and Forecast - by End User
- 10.3.1. Hospitals
- 10.3.2. Diagnostic Laboratories
- 10.3.3. Forensic Laboratories
- 10.3.4. Other End Users
- 10.1. Market Analysis, Insights and Forecast - by Product Type
- 11. North America Drug of Abuse Testing Industry Analysis, Insights and Forecast, 2019-2031
- 11.1. Market Analysis, Insights and Forecast - By Country/Sub-region
- 11.1.1 United States
- 11.1.2 Canada
- 11.1.3 Mexico
- 12. Europe Drug of Abuse Testing Industry Analysis, Insights and Forecast, 2019-2031
- 12.1. Market Analysis, Insights and Forecast - By Country/Sub-region
- 12.1.1 Germany
- 12.1.2 United Kingdom
- 12.1.3 France
- 12.1.4 Italy
- 12.1.5 Spain
- 12.1.6 Rest of Europe
- 13. Asia Pacific Drug of Abuse Testing Industry Analysis, Insights and Forecast, 2019-2031
- 13.1. Market Analysis, Insights and Forecast - By Country/Sub-region
- 13.1.1 China
- 13.1.2 Japan
- 13.1.3 India
- 13.1.4 Australia
- 13.1.5 South Korea
- 13.1.6 Rest of Asia Pacific
- 14. Middle East and Africa Drug of Abuse Testing Industry Analysis, Insights and Forecast, 2019-2031
- 14.1. Market Analysis, Insights and Forecast - By Country/Sub-region
- 14.1.1 GCC
- 14.1.2 South Africa
- 14.1.3 Rest of Middle East and Africa
- 15. South America Drug of Abuse Testing Industry Analysis, Insights and Forecast, 2019-2031
- 15.1. Market Analysis, Insights and Forecast - By Country/Sub-region
- 15.1.1 Brazil
- 15.1.2 Argentina
- 15.1.3 Rest of South America
- 16. Competitive Analysis
- 16.1. Global Market Share Analysis 2024
- 16.2. Company Profiles
- 16.2.1 Randox Testing Services
- 16.2.1.1. Overview
- 16.2.1.2. Products
- 16.2.1.3. SWOT Analysis
- 16.2.1.4. Recent Developments
- 16.2.1.5. Financials (Based on Availability)
- 16.2.2 Quest Diagnostics Inc
- 16.2.2.1. Overview
- 16.2.2.2. Products
- 16.2.2.3. SWOT Analysis
- 16.2.2.4. Recent Developments
- 16.2.2.5. Financials (Based on Availability)
- 16.2.3 F Hoffmann-La Roche Ltd
- 16.2.3.1. Overview
- 16.2.3.2. Products
- 16.2.3.3. SWOT Analysis
- 16.2.3.4. Recent Developments
- 16.2.3.5. Financials (Based on Availability)
- 16.2.4 Omega Laboratories Inc
- 16.2.4.1. Overview
- 16.2.4.2. Products
- 16.2.4.3. SWOT Analysis
- 16.2.4.4. Recent Developments
- 16.2.4.5. Financials (Based on Availability)
- 16.2.5 Thermo Fisher Scientific Inc
- 16.2.5.1. Overview
- 16.2.5.2. Products
- 16.2.5.3. SWOT Analysis
- 16.2.5.4. Recent Developments
- 16.2.5.5. Financials (Based on Availability)
- 16.2.6 Abbott Laboratories
- 16.2.6.1. Overview
- 16.2.6.2. Products
- 16.2.6.3. SWOT Analysis
- 16.2.6.4. Recent Developments
- 16.2.6.5. Financials (Based on Availability)
- 16.2.7 Psychemedics Corporation
- 16.2.7.1. Overview
- 16.2.7.2. Products
- 16.2.7.3. SWOT Analysis
- 16.2.7.4. Recent Developments
- 16.2.7.5. Financials (Based on Availability)
- 16.2.8 Cordant Health Solutions
- 16.2.8.1. Overview
- 16.2.8.2. Products
- 16.2.8.3. SWOT Analysis
- 16.2.8.4. Recent Developments
- 16.2.8.5. Financials (Based on Availability)
- 16.2.9 Siemens Healthineers AG
- 16.2.9.1. Overview
- 16.2.9.2. Products
- 16.2.9.3. SWOT Analysis
- 16.2.9.4. Recent Developments
- 16.2.9.5. Financials (Based on Availability)
- 16.2.10 Clinical Reference Laboratory Inc
- 16.2.10.1. Overview
- 16.2.10.2. Products
- 16.2.10.3. SWOT Analysis
- 16.2.10.4. Recent Developments
- 16.2.10.5. Financials (Based on Availability)
- 16.2.11 United States Drug Testing Laboratories Inc (USDTL)
- 16.2.11.1. Overview
- 16.2.11.2. Products
- 16.2.11.3. SWOT Analysis
- 16.2.11.4. Recent Developments
- 16.2.11.5. Financials (Based on Availability)
- 16.2.12 Dragerwerk AG & Co KGaA
- 16.2.12.1. Overview
- 16.2.12.2. Products
- 16.2.12.3. SWOT Analysis
- 16.2.12.4. Recent Developments
- 16.2.12.5. Financials (Based on Availability)
- 16.2.13 Danaher Corporation (Beckman Coulter)
- 16.2.13.1. Overview
- 16.2.13.2. Products
- 16.2.13.3. SWOT Analysis
- 16.2.13.4. Recent Developments
- 16.2.13.5. Financials (Based on Availability)
- 16.2.14 Precision Diagnostics
- 16.2.14.1. Overview
- 16.2.14.2. Products
- 16.2.14.3. SWOT Analysis
- 16.2.14.4. Recent Developments
- 16.2.14.5. Financials (Based on Availability)
- 16.2.15 LabCorp
- 16.2.15.1. Overview
- 16.2.15.2. Products
- 16.2.15.3. SWOT Analysis
- 16.2.15.4. Recent Developments
- 16.2.15.5. Financials (Based on Availability)
- 16.2.1 Randox Testing Services
List of Figures
- Figure 1: Global Drug of Abuse Testing Industry Revenue Breakdown (Million, %) by Region 2024 & 2032
- Figure 2: Global Drug of Abuse Testing Industry Volume Breakdown (K Unit, %) by Region 2024 & 2032
- Figure 3: North America Drug of Abuse Testing Industry Revenue (Million), by Country 2024 & 2032
- Figure 4: North America Drug of Abuse Testing Industry Volume (K Unit), by Country 2024 & 2032
- Figure 5: North America Drug of Abuse Testing Industry Revenue Share (%), by Country 2024 & 2032
- Figure 6: North America Drug of Abuse Testing Industry Volume Share (%), by Country 2024 & 2032
- Figure 7: Europe Drug of Abuse Testing Industry Revenue (Million), by Country 2024 & 2032
- Figure 8: Europe Drug of Abuse Testing Industry Volume (K Unit), by Country 2024 & 2032
- Figure 9: Europe Drug of Abuse Testing Industry Revenue Share (%), by Country 2024 & 2032
- Figure 10: Europe Drug of Abuse Testing Industry Volume Share (%), by Country 2024 & 2032
- Figure 11: Asia Pacific Drug of Abuse Testing Industry Revenue (Million), by Country 2024 & 2032
- Figure 12: Asia Pacific Drug of Abuse Testing Industry Volume (K Unit), by Country 2024 & 2032
- Figure 13: Asia Pacific Drug of Abuse Testing Industry Revenue Share (%), by Country 2024 & 2032
- Figure 14: Asia Pacific Drug of Abuse Testing Industry Volume Share (%), by Country 2024 & 2032
- Figure 15: Middle East and Africa Drug of Abuse Testing Industry Revenue (Million), by Country 2024 & 2032
- Figure 16: Middle East and Africa Drug of Abuse Testing Industry Volume (K Unit), by Country 2024 & 2032
- Figure 17: Middle East and Africa Drug of Abuse Testing Industry Revenue Share (%), by Country 2024 & 2032
- Figure 18: Middle East and Africa Drug of Abuse Testing Industry Volume Share (%), by Country 2024 & 2032
- Figure 19: South America Drug of Abuse Testing Industry Revenue (Million), by Country 2024 & 2032
- Figure 20: South America Drug of Abuse Testing Industry Volume (K Unit), by Country 2024 & 2032
- Figure 21: South America Drug of Abuse Testing Industry Revenue Share (%), by Country 2024 & 2032
- Figure 22: South America Drug of Abuse Testing Industry Volume Share (%), by Country 2024 & 2032
- Figure 23: North America Drug of Abuse Testing Industry Revenue (Million), by Product Type 2024 & 2032
- Figure 24: North America Drug of Abuse Testing Industry Volume (K Unit), by Product Type 2024 & 2032
- Figure 25: North America Drug of Abuse Testing Industry Revenue Share (%), by Product Type 2024 & 2032
- Figure 26: North America Drug of Abuse Testing Industry Volume Share (%), by Product Type 2024 & 2032
- Figure 27: North America Drug of Abuse Testing Industry Revenue (Million), by Sample Type 2024 & 2032
- Figure 28: North America Drug of Abuse Testing Industry Volume (K Unit), by Sample Type 2024 & 2032
- Figure 29: North America Drug of Abuse Testing Industry Revenue Share (%), by Sample Type 2024 & 2032
- Figure 30: North America Drug of Abuse Testing Industry Volume Share (%), by Sample Type 2024 & 2032
- Figure 31: North America Drug of Abuse Testing Industry Revenue (Million), by End User 2024 & 2032
- Figure 32: North America Drug of Abuse Testing Industry Volume (K Unit), by End User 2024 & 2032
- Figure 33: North America Drug of Abuse Testing Industry Revenue Share (%), by End User 2024 & 2032
- Figure 34: North America Drug of Abuse Testing Industry Volume Share (%), by End User 2024 & 2032
- Figure 35: North America Drug of Abuse Testing Industry Revenue (Million), by Country 2024 & 2032
- Figure 36: North America Drug of Abuse Testing Industry Volume (K Unit), by Country 2024 & 2032
- Figure 37: North America Drug of Abuse Testing Industry Revenue Share (%), by Country 2024 & 2032
- Figure 38: North America Drug of Abuse Testing Industry Volume Share (%), by Country 2024 & 2032
- Figure 39: Europe Drug of Abuse Testing Industry Revenue (Million), by Product Type 2024 & 2032
- Figure 40: Europe Drug of Abuse Testing Industry Volume (K Unit), by Product Type 2024 & 2032
- Figure 41: Europe Drug of Abuse Testing Industry Revenue Share (%), by Product Type 2024 & 2032
- Figure 42: Europe Drug of Abuse Testing Industry Volume Share (%), by Product Type 2024 & 2032
- Figure 43: Europe Drug of Abuse Testing Industry Revenue (Million), by Sample Type 2024 & 2032
- Figure 44: Europe Drug of Abuse Testing Industry Volume (K Unit), by Sample Type 2024 & 2032
- Figure 45: Europe Drug of Abuse Testing Industry Revenue Share (%), by Sample Type 2024 & 2032
- Figure 46: Europe Drug of Abuse Testing Industry Volume Share (%), by Sample Type 2024 & 2032
- Figure 47: Europe Drug of Abuse Testing Industry Revenue (Million), by End User 2024 & 2032
- Figure 48: Europe Drug of Abuse Testing Industry Volume (K Unit), by End User 2024 & 2032
- Figure 49: Europe Drug of Abuse Testing Industry Revenue Share (%), by End User 2024 & 2032
- Figure 50: Europe Drug of Abuse Testing Industry Volume Share (%), by End User 2024 & 2032
- Figure 51: Europe Drug of Abuse Testing Industry Revenue (Million), by Country 2024 & 2032
- Figure 52: Europe Drug of Abuse Testing Industry Volume (K Unit), by Country 2024 & 2032
- Figure 53: Europe Drug of Abuse Testing Industry Revenue Share (%), by Country 2024 & 2032
- Figure 54: Europe Drug of Abuse Testing Industry Volume Share (%), by Country 2024 & 2032
- Figure 55: Asia Pacific Drug of Abuse Testing Industry Revenue (Million), by Product Type 2024 & 2032
- Figure 56: Asia Pacific Drug of Abuse Testing Industry Volume (K Unit), by Product Type 2024 & 2032
- Figure 57: Asia Pacific Drug of Abuse Testing Industry Revenue Share (%), by Product Type 2024 & 2032
- Figure 58: Asia Pacific Drug of Abuse Testing Industry Volume Share (%), by Product Type 2024 & 2032
- Figure 59: Asia Pacific Drug of Abuse Testing Industry Revenue (Million), by Sample Type 2024 & 2032
- Figure 60: Asia Pacific Drug of Abuse Testing Industry Volume (K Unit), by Sample Type 2024 & 2032
- Figure 61: Asia Pacific Drug of Abuse Testing Industry Revenue Share (%), by Sample Type 2024 & 2032
- Figure 62: Asia Pacific Drug of Abuse Testing Industry Volume Share (%), by Sample Type 2024 & 2032
- Figure 63: Asia Pacific Drug of Abuse Testing Industry Revenue (Million), by End User 2024 & 2032
- Figure 64: Asia Pacific Drug of Abuse Testing Industry Volume (K Unit), by End User 2024 & 2032
- Figure 65: Asia Pacific Drug of Abuse Testing Industry Revenue Share (%), by End User 2024 & 2032
- Figure 66: Asia Pacific Drug of Abuse Testing Industry Volume Share (%), by End User 2024 & 2032
- Figure 67: Asia Pacific Drug of Abuse Testing Industry Revenue (Million), by Country 2024 & 2032
- Figure 68: Asia Pacific Drug of Abuse Testing Industry Volume (K Unit), by Country 2024 & 2032
- Figure 69: Asia Pacific Drug of Abuse Testing Industry Revenue Share (%), by Country 2024 & 2032
- Figure 70: Asia Pacific Drug of Abuse Testing Industry Volume Share (%), by Country 2024 & 2032
- Figure 71: Middle East and Africa Drug of Abuse Testing Industry Revenue (Million), by Product Type 2024 & 2032
- Figure 72: Middle East and Africa Drug of Abuse Testing Industry Volume (K Unit), by Product Type 2024 & 2032
- Figure 73: Middle East and Africa Drug of Abuse Testing Industry Revenue Share (%), by Product Type 2024 & 2032
- Figure 74: Middle East and Africa Drug of Abuse Testing Industry Volume Share (%), by Product Type 2024 & 2032
- Figure 75: Middle East and Africa Drug of Abuse Testing Industry Revenue (Million), by Sample Type 2024 & 2032
- Figure 76: Middle East and Africa Drug of Abuse Testing Industry Volume (K Unit), by Sample Type 2024 & 2032
- Figure 77: Middle East and Africa Drug of Abuse Testing Industry Revenue Share (%), by Sample Type 2024 & 2032
- Figure 78: Middle East and Africa Drug of Abuse Testing Industry Volume Share (%), by Sample Type 2024 & 2032
- Figure 79: Middle East and Africa Drug of Abuse Testing Industry Revenue (Million), by End User 2024 & 2032
- Figure 80: Middle East and Africa Drug of Abuse Testing Industry Volume (K Unit), by End User 2024 & 2032
- Figure 81: Middle East and Africa Drug of Abuse Testing Industry Revenue Share (%), by End User 2024 & 2032
- Figure 82: Middle East and Africa Drug of Abuse Testing Industry Volume Share (%), by End User 2024 & 2032
- Figure 83: Middle East and Africa Drug of Abuse Testing Industry Revenue (Million), by Country 2024 & 2032
- Figure 84: Middle East and Africa Drug of Abuse Testing Industry Volume (K Unit), by Country 2024 & 2032
- Figure 85: Middle East and Africa Drug of Abuse Testing Industry Revenue Share (%), by Country 2024 & 2032
- Figure 86: Middle East and Africa Drug of Abuse Testing Industry Volume Share (%), by Country 2024 & 2032
- Figure 87: South America Drug of Abuse Testing Industry Revenue (Million), by Product Type 2024 & 2032
- Figure 88: South America Drug of Abuse Testing Industry Volume (K Unit), by Product Type 2024 & 2032
- Figure 89: South America Drug of Abuse Testing Industry Revenue Share (%), by Product Type 2024 & 2032
- Figure 90: South America Drug of Abuse Testing Industry Volume Share (%), by Product Type 2024 & 2032
- Figure 91: South America Drug of Abuse Testing Industry Revenue (Million), by Sample Type 2024 & 2032
- Figure 92: South America Drug of Abuse Testing Industry Volume (K Unit), by Sample Type 2024 & 2032
- Figure 93: South America Drug of Abuse Testing Industry Revenue Share (%), by Sample Type 2024 & 2032
- Figure 94: South America Drug of Abuse Testing Industry Volume Share (%), by Sample Type 2024 & 2032
- Figure 95: South America Drug of Abuse Testing Industry Revenue (Million), by End User 2024 & 2032
- Figure 96: South America Drug of Abuse Testing Industry Volume (K Unit), by End User 2024 & 2032
- Figure 97: South America Drug of Abuse Testing Industry Revenue Share (%), by End User 2024 & 2032
- Figure 98: South America Drug of Abuse Testing Industry Volume Share (%), by End User 2024 & 2032
- Figure 99: South America Drug of Abuse Testing Industry Revenue (Million), by Country 2024 & 2032
- Figure 100: South America Drug of Abuse Testing Industry Volume (K Unit), by Country 2024 & 2032
- Figure 101: South America Drug of Abuse Testing Industry Revenue Share (%), by Country 2024 & 2032
- Figure 102: South America Drug of Abuse Testing Industry Volume Share (%), by Country 2024 & 2032
List of Tables
- Table 1: Global Drug of Abuse Testing Industry Revenue Million Forecast, by Region 2019 & 2032
- Table 2: Global Drug of Abuse Testing Industry Volume K Unit Forecast, by Region 2019 & 2032
- Table 3: Global Drug of Abuse Testing Industry Revenue Million Forecast, by Product Type 2019 & 2032
- Table 4: Global Drug of Abuse Testing Industry Volume K Unit Forecast, by Product Type 2019 & 2032
- Table 5: Global Drug of Abuse Testing Industry Revenue Million Forecast, by Sample Type 2019 & 2032
- Table 6: Global Drug of Abuse Testing Industry Volume K Unit Forecast, by Sample Type 2019 & 2032
- Table 7: Global Drug of Abuse Testing Industry Revenue Million Forecast, by End User 2019 & 2032
- Table 8: Global Drug of Abuse Testing Industry Volume K Unit Forecast, by End User 2019 & 2032
- Table 9: Global Drug of Abuse Testing Industry Revenue Million Forecast, by Region 2019 & 2032
- Table 10: Global Drug of Abuse Testing Industry Volume K Unit Forecast, by Region 2019 & 2032
- Table 11: Global Drug of Abuse Testing Industry Revenue Million Forecast, by Country 2019 & 2032
- Table 12: Global Drug of Abuse Testing Industry Volume K Unit Forecast, by Country 2019 & 2032
- Table 13: United States Drug of Abuse Testing Industry Revenue (Million) Forecast, by Application 2019 & 2032
- Table 14: United States Drug of Abuse Testing Industry Volume (K Unit) Forecast, by Application 2019 & 2032
- Table 15: Canada Drug of Abuse Testing Industry Revenue (Million) Forecast, by Application 2019 & 2032
- Table 16: Canada Drug of Abuse Testing Industry Volume (K Unit) Forecast, by Application 2019 & 2032
- Table 17: Mexico Drug of Abuse Testing Industry Revenue (Million) Forecast, by Application 2019 & 2032
- Table 18: Mexico Drug of Abuse Testing Industry Volume (K Unit) Forecast, by Application 2019 & 2032
- Table 19: Global Drug of Abuse Testing Industry Revenue Million Forecast, by Country 2019 & 2032
- Table 20: Global Drug of Abuse Testing Industry Volume K Unit Forecast, by Country 2019 & 2032
- Table 21: Germany Drug of Abuse Testing Industry Revenue (Million) Forecast, by Application 2019 & 2032
- Table 22: Germany Drug of Abuse Testing Industry Volume (K Unit) Forecast, by Application 2019 & 2032
- Table 23: United Kingdom Drug of Abuse Testing Industry Revenue (Million) Forecast, by Application 2019 & 2032
- Table 24: United Kingdom Drug of Abuse Testing Industry Volume (K Unit) Forecast, by Application 2019 & 2032
- Table 25: France Drug of Abuse Testing Industry Revenue (Million) Forecast, by Application 2019 & 2032
- Table 26: France Drug of Abuse Testing Industry Volume (K Unit) Forecast, by Application 2019 & 2032
- Table 27: Italy Drug of Abuse Testing Industry Revenue (Million) Forecast, by Application 2019 & 2032
- Table 28: Italy Drug of Abuse Testing Industry Volume (K Unit) Forecast, by Application 2019 & 2032
- Table 29: Spain Drug of Abuse Testing Industry Revenue (Million) Forecast, by Application 2019 & 2032
- Table 30: Spain Drug of Abuse Testing Industry Volume (K Unit) Forecast, by Application 2019 & 2032
- Table 31: Rest of Europe Drug of Abuse Testing Industry Revenue (Million) Forecast, by Application 2019 & 2032
- Table 32: Rest of Europe Drug of Abuse Testing Industry Volume (K Unit) Forecast, by Application 2019 & 2032
- Table 33: Global Drug of Abuse Testing Industry Revenue Million Forecast, by Country 2019 & 2032
- Table 34: Global Drug of Abuse Testing Industry Volume K Unit Forecast, by Country 2019 & 2032
- Table 35: China Drug of Abuse Testing Industry Revenue (Million) Forecast, by Application 2019 & 2032
- Table 36: China Drug of Abuse Testing Industry Volume (K Unit) Forecast, by Application 2019 & 2032
- Table 37: Japan Drug of Abuse Testing Industry Revenue (Million) Forecast, by Application 2019 & 2032
- Table 38: Japan Drug of Abuse Testing Industry Volume (K Unit) Forecast, by Application 2019 & 2032
- Table 39: India Drug of Abuse Testing Industry Revenue (Million) Forecast, by Application 2019 & 2032
- Table 40: India Drug of Abuse Testing Industry Volume (K Unit) Forecast, by Application 2019 & 2032
- Table 41: Australia Drug of Abuse Testing Industry Revenue (Million) Forecast, by Application 2019 & 2032
- Table 42: Australia Drug of Abuse Testing Industry Volume (K Unit) Forecast, by Application 2019 & 2032
- Table 43: South Korea Drug of Abuse Testing Industry Revenue (Million) Forecast, by Application 2019 & 2032
- Table 44: South Korea Drug of Abuse Testing Industry Volume (K Unit) Forecast, by Application 2019 & 2032
- Table 45: Rest of Asia Pacific Drug of Abuse Testing Industry Revenue (Million) Forecast, by Application 2019 & 2032
- Table 46: Rest of Asia Pacific Drug of Abuse Testing Industry Volume (K Unit) Forecast, by Application 2019 & 2032
- Table 47: Global Drug of Abuse Testing Industry Revenue Million Forecast, by Country 2019 & 2032
- Table 48: Global Drug of Abuse Testing Industry Volume K Unit Forecast, by Country 2019 & 2032
- Table 49: GCC Drug of Abuse Testing Industry Revenue (Million) Forecast, by Application 2019 & 2032
- Table 50: GCC Drug of Abuse Testing Industry Volume (K Unit) Forecast, by Application 2019 & 2032
- Table 51: South Africa Drug of Abuse Testing Industry Revenue (Million) Forecast, by Application 2019 & 2032
- Table 52: South Africa Drug of Abuse Testing Industry Volume (K Unit) Forecast, by Application 2019 & 2032
- Table 53: Rest of Middle East and Africa Drug of Abuse Testing Industry Revenue (Million) Forecast, by Application 2019 & 2032
- Table 54: Rest of Middle East and Africa Drug of Abuse Testing Industry Volume (K Unit) Forecast, by Application 2019 & 2032
- Table 55: Global Drug of Abuse Testing Industry Revenue Million Forecast, by Country 2019 & 2032
- Table 56: Global Drug of Abuse Testing Industry Volume K Unit Forecast, by Country 2019 & 2032
- Table 57: Brazil Drug of Abuse Testing Industry Revenue (Million) Forecast, by Application 2019 & 2032
- Table 58: Brazil Drug of Abuse Testing Industry Volume (K Unit) Forecast, by Application 2019 & 2032
- Table 59: Argentina Drug of Abuse Testing Industry Revenue (Million) Forecast, by Application 2019 & 2032
- Table 60: Argentina Drug of Abuse Testing Industry Volume (K Unit) Forecast, by Application 2019 & 2032
- Table 61: Rest of South America Drug of Abuse Testing Industry Revenue (Million) Forecast, by Application 2019 & 2032
- Table 62: Rest of South America Drug of Abuse Testing Industry Volume (K Unit) Forecast, by Application 2019 & 2032
- Table 63: Global Drug of Abuse Testing Industry Revenue Million Forecast, by Product Type 2019 & 2032
- Table 64: Global Drug of Abuse Testing Industry Volume K Unit Forecast, by Product Type 2019 & 2032
- Table 65: Global Drug of Abuse Testing Industry Revenue Million Forecast, by Sample Type 2019 & 2032
- Table 66: Global Drug of Abuse Testing Industry Volume K Unit Forecast, by Sample Type 2019 & 2032
- Table 67: Global Drug of Abuse Testing Industry Revenue Million Forecast, by End User 2019 & 2032
- Table 68: Global Drug of Abuse Testing Industry Volume K Unit Forecast, by End User 2019 & 2032
- Table 69: Global Drug of Abuse Testing Industry Revenue Million Forecast, by Country 2019 & 2032
- Table 70: Global Drug of Abuse Testing Industry Volume K Unit Forecast, by Country 2019 & 2032
- Table 71: United States Drug of Abuse Testing Industry Revenue (Million) Forecast, by Application 2019 & 2032
- Table 72: United States Drug of Abuse Testing Industry Volume (K Unit) Forecast, by Application 2019 & 2032
- Table 73: Canada Drug of Abuse Testing Industry Revenue (Million) Forecast, by Application 2019 & 2032
- Table 74: Canada Drug of Abuse Testing Industry Volume (K Unit) Forecast, by Application 2019 & 2032
- Table 75: Mexico Drug of Abuse Testing Industry Revenue (Million) Forecast, by Application 2019 & 2032
- Table 76: Mexico Drug of Abuse Testing Industry Volume (K Unit) Forecast, by Application 2019 & 2032
- Table 77: Global Drug of Abuse Testing Industry Revenue Million Forecast, by Product Type 2019 & 2032
- Table 78: Global Drug of Abuse Testing Industry Volume K Unit Forecast, by Product Type 2019 & 2032
- Table 79: Global Drug of Abuse Testing Industry Revenue Million Forecast, by Sample Type 2019 & 2032
- Table 80: Global Drug of Abuse Testing Industry Volume K Unit Forecast, by Sample Type 2019 & 2032
- Table 81: Global Drug of Abuse Testing Industry Revenue Million Forecast, by End User 2019 & 2032
- Table 82: Global Drug of Abuse Testing Industry Volume K Unit Forecast, by End User 2019 & 2032
- Table 83: Global Drug of Abuse Testing Industry Revenue Million Forecast, by Country 2019 & 2032
- Table 84: Global Drug of Abuse Testing Industry Volume K Unit Forecast, by Country 2019 & 2032
- Table 85: Germany Drug of Abuse Testing Industry Revenue (Million) Forecast, by Application 2019 & 2032
- Table 86: Germany Drug of Abuse Testing Industry Volume (K Unit) Forecast, by Application 2019 & 2032
- Table 87: United Kingdom Drug of Abuse Testing Industry Revenue (Million) Forecast, by Application 2019 & 2032
- Table 88: United Kingdom Drug of Abuse Testing Industry Volume (K Unit) Forecast, by Application 2019 & 2032
- Table 89: France Drug of Abuse Testing Industry Revenue (Million) Forecast, by Application 2019 & 2032
- Table 90: France Drug of Abuse Testing Industry Volume (K Unit) Forecast, by Application 2019 & 2032
- Table 91: Italy Drug of Abuse Testing Industry Revenue (Million) Forecast, by Application 2019 & 2032
- Table 92: Italy Drug of Abuse Testing Industry Volume (K Unit) Forecast, by Application 2019 & 2032
- Table 93: Spain Drug of Abuse Testing Industry Revenue (Million) Forecast, by Application 2019 & 2032
- Table 94: Spain Drug of Abuse Testing Industry Volume (K Unit) Forecast, by Application 2019 & 2032
- Table 95: Rest of Europe Drug of Abuse Testing Industry Revenue (Million) Forecast, by Application 2019 & 2032
- Table 96: Rest of Europe Drug of Abuse Testing Industry Volume (K Unit) Forecast, by Application 2019 & 2032
- Table 97: Global Drug of Abuse Testing Industry Revenue Million Forecast, by Product Type 2019 & 2032
- Table 98: Global Drug of Abuse Testing Industry Volume K Unit Forecast, by Product Type 2019 & 2032
- Table 99: Global Drug of Abuse Testing Industry Revenue Million Forecast, by Sample Type 2019 & 2032
- Table 100: Global Drug of Abuse Testing Industry Volume K Unit Forecast, by Sample Type 2019 & 2032
- Table 101: Global Drug of Abuse Testing Industry Revenue Million Forecast, by End User 2019 & 2032
- Table 102: Global Drug of Abuse Testing Industry Volume K Unit Forecast, by End User 2019 & 2032
- Table 103: Global Drug of Abuse Testing Industry Revenue Million Forecast, by Country 2019 & 2032
- Table 104: Global Drug of Abuse Testing Industry Volume K Unit Forecast, by Country 2019 & 2032
- Table 105: China Drug of Abuse Testing Industry Revenue (Million) Forecast, by Application 2019 & 2032
- Table 106: China Drug of Abuse Testing Industry Volume (K Unit) Forecast, by Application 2019 & 2032
- Table 107: Japan Drug of Abuse Testing Industry Revenue (Million) Forecast, by Application 2019 & 2032
- Table 108: Japan Drug of Abuse Testing Industry Volume (K Unit) Forecast, by Application 2019 & 2032
- Table 109: India Drug of Abuse Testing Industry Revenue (Million) Forecast, by Application 2019 & 2032
- Table 110: India Drug of Abuse Testing Industry Volume (K Unit) Forecast, by Application 2019 & 2032
- Table 111: Australia Drug of Abuse Testing Industry Revenue (Million) Forecast, by Application 2019 & 2032
- Table 112: Australia Drug of Abuse Testing Industry Volume (K Unit) Forecast, by Application 2019 & 2032
- Table 113: South Korea Drug of Abuse Testing Industry Revenue (Million) Forecast, by Application 2019 & 2032
- Table 114: South Korea Drug of Abuse Testing Industry Volume (K Unit) Forecast, by Application 2019 & 2032
- Table 115: Rest of Asia Pacific Drug of Abuse Testing Industry Revenue (Million) Forecast, by Application 2019 & 2032
- Table 116: Rest of Asia Pacific Drug of Abuse Testing Industry Volume (K Unit) Forecast, by Application 2019 & 2032
- Table 117: Global Drug of Abuse Testing Industry Revenue Million Forecast, by Product Type 2019 & 2032
- Table 118: Global Drug of Abuse Testing Industry Volume K Unit Forecast, by Product Type 2019 & 2032
- Table 119: Global Drug of Abuse Testing Industry Revenue Million Forecast, by Sample Type 2019 & 2032
- Table 120: Global Drug of Abuse Testing Industry Volume K Unit Forecast, by Sample Type 2019 & 2032
- Table 121: Global Drug of Abuse Testing Industry Revenue Million Forecast, by End User 2019 & 2032
- Table 122: Global Drug of Abuse Testing Industry Volume K Unit Forecast, by End User 2019 & 2032
- Table 123: Global Drug of Abuse Testing Industry Revenue Million Forecast, by Country 2019 & 2032
- Table 124: Global Drug of Abuse Testing Industry Volume K Unit Forecast, by Country 2019 & 2032
- Table 125: GCC Drug of Abuse Testing Industry Revenue (Million) Forecast, by Application 2019 & 2032
- Table 126: GCC Drug of Abuse Testing Industry Volume (K Unit) Forecast, by Application 2019 & 2032
- Table 127: South Africa Drug of Abuse Testing Industry Revenue (Million) Forecast, by Application 2019 & 2032
- Table 128: South Africa Drug of Abuse Testing Industry Volume (K Unit) Forecast, by Application 2019 & 2032
- Table 129: Rest of Middle East and Africa Drug of Abuse Testing Industry Revenue (Million) Forecast, by Application 2019 & 2032
- Table 130: Rest of Middle East and Africa Drug of Abuse Testing Industry Volume (K Unit) Forecast, by Application 2019 & 2032
- Table 131: Global Drug of Abuse Testing Industry Revenue Million Forecast, by Product Type 2019 & 2032
- Table 132: Global Drug of Abuse Testing Industry Volume K Unit Forecast, by Product Type 2019 & 2032
- Table 133: Global Drug of Abuse Testing Industry Revenue Million Forecast, by Sample Type 2019 & 2032
- Table 134: Global Drug of Abuse Testing Industry Volume K Unit Forecast, by Sample Type 2019 & 2032
- Table 135: Global Drug of Abuse Testing Industry Revenue Million Forecast, by End User 2019 & 2032
- Table 136: Global Drug of Abuse Testing Industry Volume K Unit Forecast, by End User 2019 & 2032
- Table 137: Global Drug of Abuse Testing Industry Revenue Million Forecast, by Country 2019 & 2032
- Table 138: Global Drug of Abuse Testing Industry Volume K Unit Forecast, by Country 2019 & 2032
- Table 139: Brazil Drug of Abuse Testing Industry Revenue (Million) Forecast, by Application 2019 & 2032
- Table 140: Brazil Drug of Abuse Testing Industry Volume (K Unit) Forecast, by Application 2019 & 2032
- Table 141: Argentina Drug of Abuse Testing Industry Revenue (Million) Forecast, by Application 2019 & 2032
- Table 142: Argentina Drug of Abuse Testing Industry Volume (K Unit) Forecast, by Application 2019 & 2032
- Table 143: Rest of South America Drug of Abuse Testing Industry Revenue (Million) Forecast, by Application 2019 & 2032
- Table 144: Rest of South America Drug of Abuse Testing Industry Volume (K Unit) Forecast, by Application 2019 & 2032
Frequently Asked Questions
1. What is the projected Compound Annual Growth Rate (CAGR) of the Drug of Abuse Testing Industry?
The projected CAGR is approximately 7.50%.
2. Which companies are prominent players in the Drug of Abuse Testing Industry?
Key companies in the market include Randox Testing Services, Quest Diagnostics Inc, F Hoffmann-La Roche Ltd, Omega Laboratories Inc, Thermo Fisher Scientific Inc, Abbott Laboratories, Psychemedics Corporation, Cordant Health Solutions, Siemens Healthineers AG, Clinical Reference Laboratory Inc, United States Drug Testing Laboratories Inc (USDTL), Dragerwerk AG & Co KGaA, Danaher Corporation (Beckman Coulter), Precision Diagnostics, LabCorp.
3. What are the main segments of the Drug of Abuse Testing Industry?
The market segments include Product Type, Sample Type, End User.
4. Can you provide details about the market size?
The market size is estimated to be USD XX Million as of 2022.
5. What are some drivers contributing to market growth?
Increasing Demand for Drug Abuse Treatment; Stringent Law Mandating Alcohol and Drug Testing; Rising Drug-related Mortality and Increasing Government Initiatives.
6. What are the notable trends driving market growth?
The Urine Segment is Expected to Dominate in the Market Over the Forecast Period.
7. Are there any restraints impacting market growth?
Perception of Drug Abuse Testing as a Violation of Rights; Lack of Awareness Regarding the Availability of Advanced Drug Testing Devices.
8. Can you provide examples of recent developments in the market?
In August 2022, the Delaware Division of Public Health began including fentanyl strips in Narcan kits for distribution to the public. The effort was a part of a harm-reduction strategy aimed at preventing accidental overdoses due to fentanyl consumption.
9. What pricing options are available for accessing the report?
Pricing options include single-user, multi-user, and enterprise licenses priced at USD 4750, USD 5250, and USD 8750 respectively.
10. Is the market size provided in terms of value or volume?
The market size is provided in terms of value, measured in Million and volume, measured in K Unit.
11. Are there any specific market keywords associated with the report?
Yes, the market keyword associated with the report is "Drug of Abuse Testing Industry," which aids in identifying and referencing the specific market segment covered.
12. How do I determine which pricing option suits my needs best?
The pricing options vary based on user requirements and access needs. Individual users may opt for single-user licenses, while businesses requiring broader access may choose multi-user or enterprise licenses for cost-effective access to the report.
13. Are there any additional resources or data provided in the Drug of Abuse Testing Industry report?
While the report offers comprehensive insights, it's advisable to review the specific contents or supplementary materials provided to ascertain if additional resources or data are available.
14. How can I stay updated on further developments or reports in the Drug of Abuse Testing Industry?
To stay informed about further developments, trends, and reports in the Drug of Abuse Testing Industry, consider subscribing to industry newsletters, following relevant companies and organizations, or regularly checking reputable industry news sources and publications.
Methodology
Step 1 - Identification of Relevant Samples Size from Population Database


Step 2 - Approaches for Defining Global Market Size (Value, Volume* & Price*)

Note*: In applicable scenarios
Step 3 - Data Sources
Primary Research
- Web Analytics
- Survey Reports
- Research Institute
- Latest Research Reports
- Opinion Leaders
Secondary Research
- Annual Reports
- White Paper
- Latest Press Release
- Industry Association
- Paid Database
- Investor Presentations

Step 4 - Data Triangulation
Involves using different sources of information in order to increase the validity of a study
These sources are likely to be stakeholders in a program - participants, other researchers, program staff, other community members, and so on.
Then we put all data in single framework & apply various statistical tools to find out the dynamic on the market.
During the analysis stage, feedback from the stakeholder groups would be compared to determine areas of agreement as well as areas of divergence
