

Key Insights
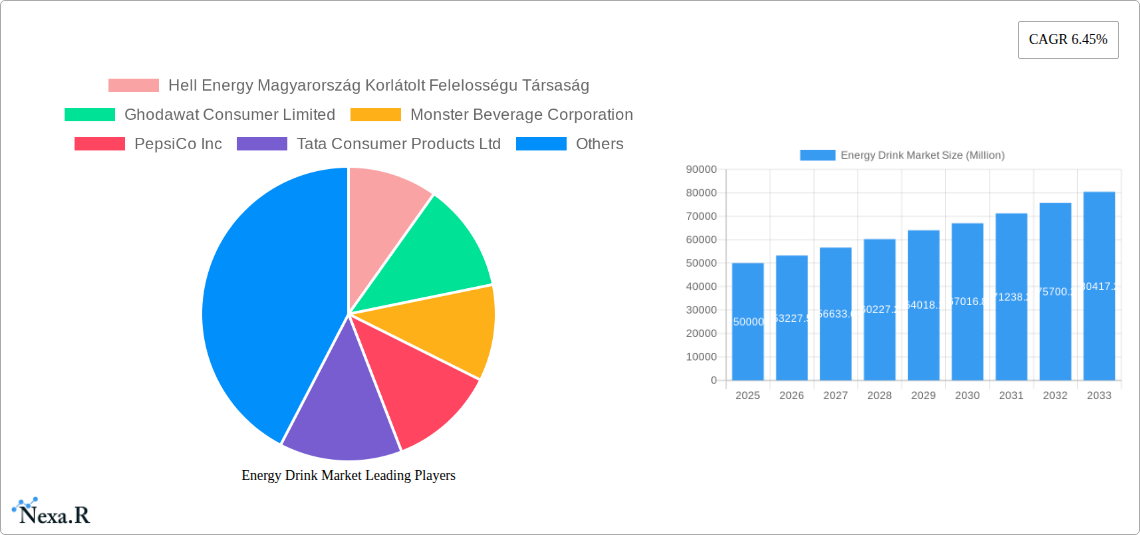
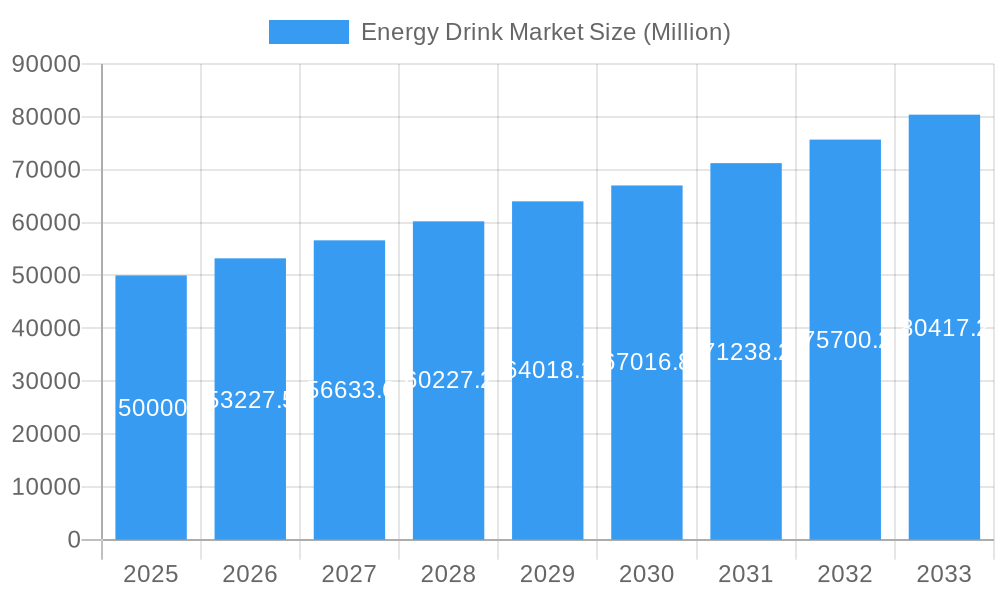
The global energy drink market is forecast to reach $87.8 billion by 2025, exhibiting a Compound Annual Growth Rate (CAGR) of 6.8%. This growth is propelled by factors including demanding lifestyles, increasing participation in fitness and sports, and product innovation offering sugar-free and natural alternatives. The market is segmented by distribution channel, soft drink type, and packaging. Competitive pressure is significant from global and emerging brands.
Energy Drink Market Market Size (In Billion)
Geographically, North America and Europe lead market share, while Asia-Pacific is projected for substantial expansion due to rising incomes and urbanization. Potential market restraints include health concerns and regulatory scrutiny surrounding sugar content, which the industry is addressing through reformulation and transparency.
Energy Drink Market Company Market Share
Energy Drink Market Report: 2019-2033 Forecast
This comprehensive report provides a deep dive into the global energy drink market, analyzing its dynamics, growth trends, and future outlook from 2019 to 2033. With a focus on key players like Red Bull GmbH and Monster Beverage Corporation, this report is essential for industry professionals, investors, and anyone seeking to understand this dynamic market. The report leverages extensive data analysis to offer actionable insights into market segments, including energy shots, natural/organic drinks, and sugar-free options, across various distribution channels (off-trade, on-trade) and packaging types (metal cans, PET bottles). We explore the parent market of functional beverages and the child market of energy drinks to provide a holistic view. The base year is 2025, with a forecast period spanning 2025-2033 and a historical period covering 2019-2024. All values are presented in million units.
Energy Drink Market Dynamics & Structure
The global energy drink market is characterized by intense competition among established players and emerging brands. Market concentration is relatively high, with a few dominant players holding significant market share. Technological innovation, particularly in formulations (e.g., natural ingredients, low-sugar options) and packaging, is a key driver of growth. Stringent regulatory frameworks concerning ingredients and labeling significantly influence market dynamics. The market also experiences pressure from competitive product substitutes, such as sports drinks and coffee. End-user demographics, primarily focused on young adults and active individuals, are central to market segmentation. M&A activity, while not excessively frequent, plays a role in shaping the market landscape. In recent years, we've seen approximately xx M&A deals annually, contributing to xx% market share changes among major players. Innovation barriers include high R&D costs and stringent regulatory approvals.
- Market Concentration: High, with top 5 players holding approximately xx% market share in 2024.
- Technological Innovation: Focus on natural ingredients, functional benefits, and sustainable packaging.
- Regulatory Framework: Varying regulations globally regarding sugar content, caffeine levels, and marketing.
- Competitive Substitutes: Sports drinks, coffee, and functional beverages pose significant competition.
- End-User Demographics: Primarily young adults (18-35) and health-conscious consumers.
- M&A Trends: xx M&A deals annually, resulting in xx% market share shifts over the past 5 years.
Energy Drink Market Growth Trends & Insights
The global energy drink market experienced robust growth during the historical period (2019-2024), with a CAGR of xx%. This growth is attributed to several factors, including rising disposable incomes, changing lifestyles, and increasing health consciousness, leading to demand for healthier, low-sugar options. The market size reached xx million units in 2024 and is projected to reach xx million units by 2033, exhibiting a CAGR of xx% during the forecast period (2025-2033). Technological disruptions, such as the introduction of innovative ingredients and packaging formats, have fueled market expansion. Consumer behavior shifts toward healthier alternatives and convenience have influenced market segmentation, particularly driving the growth of sugar-free and natural energy drinks. Market penetration in developing economies is steadily increasing, providing significant growth opportunities.
Dominant Regions, Countries, or Segments in Energy Drink Market
The North American region dominates the global energy drink market, accounting for approximately xx% of the total market share in 2024. This dominance is primarily driven by high per capita consumption, strong consumer preference for energy drinks, and the presence of major energy drink manufacturers. Within North America, the United States holds the largest market share, followed by Canada. Other significant markets include Western Europe and Asia-Pacific, which are expected to witness substantial growth in the coming years.
- Dominant Segment: Traditional energy drinks currently hold the largest market share (xx%), followed by sugar-free options (xx%)
- Key Drivers: Rising disposable incomes, increasing urbanization, and changing lifestyles.
- Growth Potential: Developing economies in Asia-Pacific and Latin America offer significant untapped potential.
- Distribution Channel: Off-trade channels (convenience stores, supermarkets) account for xx% of sales.
Energy Drink Market Product Landscape
The energy drink market offers a diverse range of products, from traditional high-sugar formulations to innovative low-sugar, natural, and organic options. Key product innovations include functional additions, like vitamins and antioxidants, and unique flavor profiles catering to evolving consumer preferences. Technological advancements in packaging, such as sustainable materials and convenient sizes, further enhance product appeal. Unique selling propositions (USPs) frequently focus on natural ingredients, enhanced functionality, and improved taste profiles.
Key Drivers, Barriers & Challenges in Energy Drink Market
Key Drivers:
- Growing demand for convenient energy boosts.
- Increasing health awareness leading to low-sugar and natural options' popularity.
- Technological advancements resulting in better flavors and functional benefits.
Key Challenges:
- Intense competition among numerous established and emerging brands.
- Concerns about high sugar and caffeine content impacting market growth.
- Stringent regulatory frameworks imposing restrictions on ingredients and marketing. These factors contribute to an estimated xx% reduction in market growth annually.
Emerging Opportunities in Energy Drink Market
Emerging opportunities exist in several areas: Firstly, tapping into untapped markets in developing economies offers substantial growth potential. Secondly, the demand for specialized functional energy drinks tailored to specific needs (e.g., pre-workout, post-workout) is increasing. Thirdly, evolving consumer preferences toward sustainability are creating a demand for eco-friendly packaging and natural ingredients. Finally, exploring collaborations and strategic partnerships can unlock innovation opportunities.
Growth Accelerators in the Energy Drink Market Industry
Technological breakthroughs in flavor development and ingredient sourcing, coupled with strategic partnerships, and aggressive market expansion strategies, are crucial factors driving long-term growth. These initiatives allow manufacturers to offer innovative products and expand their reach into new and existing markets, ensuring sustained growth within the energy drink sector.
Key Players Shaping the Energy Drink Market Market
- Hell Energy Magyarország Korlátolt Felelosségu Társaság
- Ghodawat Consumer Limited
- Monster Beverage Corporation
- PepsiCo Inc
- Tata Consumer Products Ltd
- The Coca-Cola Company
- Red Bull GmbH
- Ocean Drinks Private Limited
- BPI Sports LLC
- Hector Beverages Private Limited
- Anheuser-Busch InBev SA/NV
- Radiohead Brands Private Limited
Notable Milestones in Energy Drink Market Sector
- September 2023: PepsiCo India launched Sting Blue Current, a limited-edition flavor in 200 ml single-serve packs.
- July 2023: Radiohead Brands secured USD 1.3 million in pre-series A funding for its Hustle energy drink.
- May 2023: Anheuser-Busch InBev India launched Budweiser Beats energy drink (initially launched in 2021).
In-Depth Energy Drink Market Market Outlook
The future of the energy drink market is bright, with continued growth driven by innovation, evolving consumer preferences, and expansion into new markets. Strategic partnerships, sustainable packaging solutions, and health-conscious product development are key to success. The market is poised to experience significant growth over the forecast period (2025-2033), presenting lucrative opportunities for both established and emerging players.
Energy Drink Market Segmentation
-
1. Soft Drink Type
- 1.1. Energy Shots
- 1.2. Natural/Organic Energy Drinks
- 1.3. Sugar-free or Low-calories Energy Drinks
- 1.4. Traditional Energy Drinks
- 1.5. Other Energy Drinks
-
2. Packaging Type
- 2.1. Glass Bottles
- 2.2. Metal Can
- 2.3. PET Bottles
-
3. Distribution Channel
-
3.1. Off-trade
- 3.1.1. Convenience Stores
- 3.1.2. Online Retail
- 3.1.3. Supermarket/Hypermarket
- 3.1.4. Others
- 3.2. On-trade
-
3.1. Off-trade
Energy Drink Market Segmentation By Geography
-
1. North America
- 1.1. United States
- 1.2. Canada
- 1.3. Mexico
-
2. South America
- 2.1. Brazil
- 2.2. Argentina
- 2.3. Rest of South America
-
3. Europe
- 3.1. United Kingdom
- 3.2. Germany
- 3.3. France
- 3.4. Italy
- 3.5. Spain
- 3.6. Russia
- 3.7. Benelux
- 3.8. Nordics
- 3.9. Rest of Europe
-
4. Middle East & Africa
- 4.1. Turkey
- 4.2. Israel
- 4.3. GCC
- 4.4. North Africa
- 4.5. South Africa
- 4.6. Rest of Middle East & Africa
-
5. Asia Pacific
- 5.1. China
- 5.2. India
- 5.3. Japan
- 5.4. South Korea
- 5.5. ASEAN
- 5.6. Oceania
- 5.7. Rest of Asia Pacific
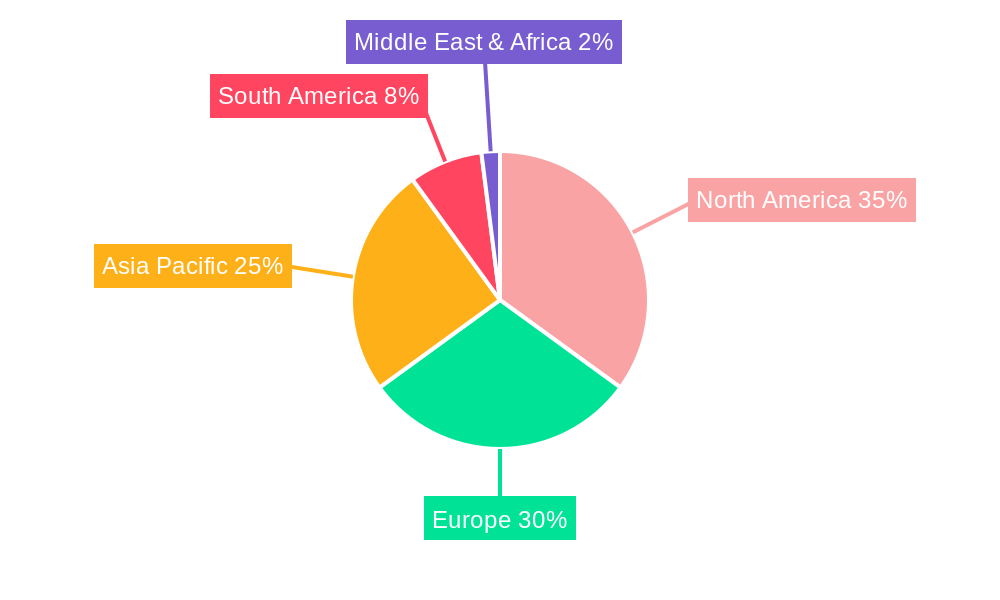
Energy Drink Market Regional Market Share
Geographic Coverage of Energy Drink Market
Energy Drink Market REPORT HIGHLIGHTS
| Aspects | Details |
|---|---|
| Study Period | 2020-2034 |
| Base Year | 2025 |
| Estimated Year | 2026 |
| Forecast Period | 2026-2034 |
| Historical Period | 2020-2025 |
| Growth Rate | CAGR of 6.8% from 2020-2034 |
| Segmentation |
|
Table of Contents
- 1. Introduction
- 1.1. Research Scope
- 1.2. Market Segmentation
- 1.3. Research Objective
- 1.4. Definitions and Assumptions
- 2. Executive Summary
- 2.1. Market Snapshot
- 3. Market Dynamics
- 3.1. Market Drivers
- 3.2. Market Restrains
- 3.3. Market Trends
- 3.4. Market Opportunities
- 4. Market Factor Analysis
- 4.1. Porters Five Forces
- 4.1.1. Bargaining Power of Suppliers
- 4.1.2. Bargaining Power of Buyers
- 4.1.3. Threat of New Entrants
- 4.1.4. Threat of Substitutes
- 4.1.5. Competitive Rivalry
- 4.2. PESTEL analysis
- 4.3. BCG Analysis
- 4.3.1. Stars (High Growth, High Market Share)
- 4.3.2. Cash Cows (Low Growth, High Market Share)
- 4.3.3. Question Mark (High Growth, Low Market Share)
- 4.3.4. Dogs (Low Growth, Low Market Share)
- 4.4. Ansoff Matrix Analysis
- 4.5. Supply Chain Analysis
- 4.6. Regulatory Landscape
- 4.7. Current Market Potential and Opportunity Assessment (TAM–SAM–SOM Framework)
- 4.8. NRP Analyst Note
- 4.1. Porters Five Forces
- 5. Market Analysis, Insights and Forecast 2021-2033
- 5.1. Market Analysis, Insights and Forecast - by Soft Drink Type
- 5.1.1. Energy Shots
- 5.1.2. Natural/Organic Energy Drinks
- 5.1.3. Sugar-free or Low-calories Energy Drinks
- 5.1.4. Traditional Energy Drinks
- 5.1.5. Other Energy Drinks
- 5.2. Market Analysis, Insights and Forecast - by Packaging Type
- 5.2.1. Glass Bottles
- 5.2.2. Metal Can
- 5.2.3. PET Bottles
- 5.3. Market Analysis, Insights and Forecast - by Distribution Channel
- 5.3.1. Off-trade
- 5.3.1.1. Convenience Stores
- 5.3.1.2. Online Retail
- 5.3.1.3. Supermarket/Hypermarket
- 5.3.1.4. Others
- 5.3.2. On-trade
- 5.3.1. Off-trade
- 5.4. Market Analysis, Insights and Forecast - by Region
- 5.4.1. North America
- 5.4.2. South America
- 5.4.3. Europe
- 5.4.4. Middle East & Africa
- 5.4.5. Asia Pacific
- 5.1. Market Analysis, Insights and Forecast - by Soft Drink Type
- 6. Global Energy Drink Market Analysis, Insights and Forecast, 2021-2033
- 6.1. Market Analysis, Insights and Forecast - by Soft Drink Type
- 6.1.1. Energy Shots
- 6.1.2. Natural/Organic Energy Drinks
- 6.1.3. Sugar-free or Low-calories Energy Drinks
- 6.1.4. Traditional Energy Drinks
- 6.1.5. Other Energy Drinks
- 6.2. Market Analysis, Insights and Forecast - by Packaging Type
- 6.2.1. Glass Bottles
- 6.2.2. Metal Can
- 6.2.3. PET Bottles
- 6.3. Market Analysis, Insights and Forecast - by Distribution Channel
- 6.3.1. Off-trade
- 6.3.1.1. Convenience Stores
- 6.3.1.2. Online Retail
- 6.3.1.3. Supermarket/Hypermarket
- 6.3.1.4. Others
- 6.3.2. On-trade
- 6.3.1. Off-trade
- 6.1. Market Analysis, Insights and Forecast - by Soft Drink Type
- 7. North America Energy Drink Market Analysis, Insights and Forecast, 2020-2032
- 7.1. Market Analysis, Insights and Forecast - by Soft Drink Type
- 7.1.1. Energy Shots
- 7.1.2. Natural/Organic Energy Drinks
- 7.1.3. Sugar-free or Low-calories Energy Drinks
- 7.1.4. Traditional Energy Drinks
- 7.1.5. Other Energy Drinks
- 7.2. Market Analysis, Insights and Forecast - by Packaging Type
- 7.2.1. Glass Bottles
- 7.2.2. Metal Can
- 7.2.3. PET Bottles
- 7.3. Market Analysis, Insights and Forecast - by Distribution Channel
- 7.3.1. Off-trade
- 7.3.1.1. Convenience Stores
- 7.3.1.2. Online Retail
- 7.3.1.3. Supermarket/Hypermarket
- 7.3.1.4. Others
- 7.3.2. On-trade
- 7.3.1. Off-trade
- 7.1. Market Analysis, Insights and Forecast - by Soft Drink Type
- 8. South America Energy Drink Market Analysis, Insights and Forecast, 2020-2032
- 8.1. Market Analysis, Insights and Forecast - by Soft Drink Type
- 8.1.1. Energy Shots
- 8.1.2. Natural/Organic Energy Drinks
- 8.1.3. Sugar-free or Low-calories Energy Drinks
- 8.1.4. Traditional Energy Drinks
- 8.1.5. Other Energy Drinks
- 8.2. Market Analysis, Insights and Forecast - by Packaging Type
- 8.2.1. Glass Bottles
- 8.2.2. Metal Can
- 8.2.3. PET Bottles
- 8.3. Market Analysis, Insights and Forecast - by Distribution Channel
- 8.3.1. Off-trade
- 8.3.1.1. Convenience Stores
- 8.3.1.2. Online Retail
- 8.3.1.3. Supermarket/Hypermarket
- 8.3.1.4. Others
- 8.3.2. On-trade
- 8.3.1. Off-trade
- 8.1. Market Analysis, Insights and Forecast - by Soft Drink Type
- 9. Europe Energy Drink Market Analysis, Insights and Forecast, 2020-2032
- 9.1. Market Analysis, Insights and Forecast - by Soft Drink Type
- 9.1.1. Energy Shots
- 9.1.2. Natural/Organic Energy Drinks
- 9.1.3. Sugar-free or Low-calories Energy Drinks
- 9.1.4. Traditional Energy Drinks
- 9.1.5. Other Energy Drinks
- 9.2. Market Analysis, Insights and Forecast - by Packaging Type
- 9.2.1. Glass Bottles
- 9.2.2. Metal Can
- 9.2.3. PET Bottles
- 9.3. Market Analysis, Insights and Forecast - by Distribution Channel
- 9.3.1. Off-trade
- 9.3.1.1. Convenience Stores
- 9.3.1.2. Online Retail
- 9.3.1.3. Supermarket/Hypermarket
- 9.3.1.4. Others
- 9.3.2. On-trade
- 9.3.1. Off-trade
- 9.1. Market Analysis, Insights and Forecast - by Soft Drink Type
- 10. Middle East & Africa Energy Drink Market Analysis, Insights and Forecast, 2020-2032
- 10.1. Market Analysis, Insights and Forecast - by Soft Drink Type
- 10.1.1. Energy Shots
- 10.1.2. Natural/Organic Energy Drinks
- 10.1.3. Sugar-free or Low-calories Energy Drinks
- 10.1.4. Traditional Energy Drinks
- 10.1.5. Other Energy Drinks
- 10.2. Market Analysis, Insights and Forecast - by Packaging Type
- 10.2.1. Glass Bottles
- 10.2.2. Metal Can
- 10.2.3. PET Bottles
- 10.3. Market Analysis, Insights and Forecast - by Distribution Channel
- 10.3.1. Off-trade
- 10.3.1.1. Convenience Stores
- 10.3.1.2. Online Retail
- 10.3.1.3. Supermarket/Hypermarket
- 10.3.1.4. Others
- 10.3.2. On-trade
- 10.3.1. Off-trade
- 10.1. Market Analysis, Insights and Forecast - by Soft Drink Type
- 11. Asia Pacific Energy Drink Market Analysis, Insights and Forecast, 2020-2032
- 11.1. Market Analysis, Insights and Forecast - by Soft Drink Type
- 11.1.1. Energy Shots
- 11.1.2. Natural/Organic Energy Drinks
- 11.1.3. Sugar-free or Low-calories Energy Drinks
- 11.1.4. Traditional Energy Drinks
- 11.1.5. Other Energy Drinks
- 11.2. Market Analysis, Insights and Forecast - by Packaging Type
- 11.2.1. Glass Bottles
- 11.2.2. Metal Can
- 11.2.3. PET Bottles
- 11.3. Market Analysis, Insights and Forecast - by Distribution Channel
- 11.3.1. Off-trade
- 11.3.1.1. Convenience Stores
- 11.3.1.2. Online Retail
- 11.3.1.3. Supermarket/Hypermarket
- 11.3.1.4. Others
- 11.3.2. On-trade
- 11.3.1. Off-trade
- 11.1. Market Analysis, Insights and Forecast - by Soft Drink Type
- 12. Competitive Analysis
- 12.1. Company Profiles
- 12.1.1 Hell Energy Magyarország Korlátolt Felelosségu Társaság
- 12.1.1.1. Company Overview
- 12.1.1.2. Products
- 12.1.1.3. Company Financials
- 12.1.1.4. SWOT Analysis
- 12.1.2 Ghodawat Consumer Limited
- 12.1.2.1. Company Overview
- 12.1.2.2. Products
- 12.1.2.3. Company Financials
- 12.1.2.4. SWOT Analysis
- 12.1.3 Monster Beverage Corporation
- 12.1.3.1. Company Overview
- 12.1.3.2. Products
- 12.1.3.3. Company Financials
- 12.1.3.4. SWOT Analysis
- 12.1.4 PepsiCo Inc
- 12.1.4.1. Company Overview
- 12.1.4.2. Products
- 12.1.4.3. Company Financials
- 12.1.4.4. SWOT Analysis
- 12.1.5 Tata Consumer Products Ltd
- 12.1.5.1. Company Overview
- 12.1.5.2. Products
- 12.1.5.3. Company Financials
- 12.1.5.4. SWOT Analysis
- 12.1.6 The Coca-Cola Compan
- 12.1.6.1. Company Overview
- 12.1.6.2. Products
- 12.1.6.3. Company Financials
- 12.1.6.4. SWOT Analysis
- 12.1.7 Red Bull GmbH
- 12.1.7.1. Company Overview
- 12.1.7.2. Products
- 12.1.7.3. Company Financials
- 12.1.7.4. SWOT Analysis
- 12.1.8 Ocean Drinks Private Limited
- 12.1.8.1. Company Overview
- 12.1.8.2. Products
- 12.1.8.3. Company Financials
- 12.1.8.4. SWOT Analysis
- 12.1.9 BPI Sports LLC
- 12.1.9.1. Company Overview
- 12.1.9.2. Products
- 12.1.9.3. Company Financials
- 12.1.9.4. SWOT Analysis
- 12.1.10 Hector Beverages Private Limited
- 12.1.10.1. Company Overview
- 12.1.10.2. Products
- 12.1.10.3. Company Financials
- 12.1.10.4. SWOT Analysis
- 12.1.11 Anheuser-Busch InBev SA/NV
- 12.1.11.1. Company Overview
- 12.1.11.2. Products
- 12.1.11.3. Company Financials
- 12.1.11.4. SWOT Analysis
- 12.1.12 Radiohead Brands Private Limited
- 12.1.12.1. Company Overview
- 12.1.12.2. Products
- 12.1.12.3. Company Financials
- 12.1.12.4. SWOT Analysis
- 12.1.1 Hell Energy Magyarország Korlátolt Felelosségu Társaság
- 12.2. Market Entropy
- 12.2.1 Company's Key Areas Served
- 12.2.2 Recent Developments
- 12.3. Company Market Share Analysis 2025
- 12.3.1 Top 5 Companies Market Share Analysis
- 12.3.2 Top 3 Companies Market Share Analysis
- 12.4. List of Potential Customers
- 13. Research Methodology
List of Figures
- Figure 1: Global Energy Drink Market Revenue Breakdown (billion, %) by Region 2025 & 2033
- Figure 2: Global Energy Drink Market Volume Breakdown (K Units, %) by Region 2025 & 2033
- Figure 3: North America Energy Drink Market Revenue (billion), by Soft Drink Type 2025 & 2033
- Figure 4: North America Energy Drink Market Volume (K Units), by Soft Drink Type 2025 & 2033
- Figure 5: North America Energy Drink Market Revenue Share (%), by Soft Drink Type 2025 & 2033
- Figure 6: North America Energy Drink Market Volume Share (%), by Soft Drink Type 2025 & 2033
- Figure 7: North America Energy Drink Market Revenue (billion), by Packaging Type 2025 & 2033
- Figure 8: North America Energy Drink Market Volume (K Units), by Packaging Type 2025 & 2033
- Figure 9: North America Energy Drink Market Revenue Share (%), by Packaging Type 2025 & 2033
- Figure 10: North America Energy Drink Market Volume Share (%), by Packaging Type 2025 & 2033
- Figure 11: North America Energy Drink Market Revenue (billion), by Distribution Channel 2025 & 2033
- Figure 12: North America Energy Drink Market Volume (K Units), by Distribution Channel 2025 & 2033
- Figure 13: North America Energy Drink Market Revenue Share (%), by Distribution Channel 2025 & 2033
- Figure 14: North America Energy Drink Market Volume Share (%), by Distribution Channel 2025 & 2033
- Figure 15: North America Energy Drink Market Revenue (billion), by Country 2025 & 2033
- Figure 16: North America Energy Drink Market Volume (K Units), by Country 2025 & 2033
- Figure 17: North America Energy Drink Market Revenue Share (%), by Country 2025 & 2033
- Figure 18: North America Energy Drink Market Volume Share (%), by Country 2025 & 2033
- Figure 19: South America Energy Drink Market Revenue (billion), by Soft Drink Type 2025 & 2033
- Figure 20: South America Energy Drink Market Volume (K Units), by Soft Drink Type 2025 & 2033
- Figure 21: South America Energy Drink Market Revenue Share (%), by Soft Drink Type 2025 & 2033
- Figure 22: South America Energy Drink Market Volume Share (%), by Soft Drink Type 2025 & 2033
- Figure 23: South America Energy Drink Market Revenue (billion), by Packaging Type 2025 & 2033
- Figure 24: South America Energy Drink Market Volume (K Units), by Packaging Type 2025 & 2033
- Figure 25: South America Energy Drink Market Revenue Share (%), by Packaging Type 2025 & 2033
- Figure 26: South America Energy Drink Market Volume Share (%), by Packaging Type 2025 & 2033
- Figure 27: South America Energy Drink Market Revenue (billion), by Distribution Channel 2025 & 2033
- Figure 28: South America Energy Drink Market Volume (K Units), by Distribution Channel 2025 & 2033
- Figure 29: South America Energy Drink Market Revenue Share (%), by Distribution Channel 2025 & 2033
- Figure 30: South America Energy Drink Market Volume Share (%), by Distribution Channel 2025 & 2033
- Figure 31: South America Energy Drink Market Revenue (billion), by Country 2025 & 2033
- Figure 32: South America Energy Drink Market Volume (K Units), by Country 2025 & 2033
- Figure 33: South America Energy Drink Market Revenue Share (%), by Country 2025 & 2033
- Figure 34: South America Energy Drink Market Volume Share (%), by Country 2025 & 2033
- Figure 35: Europe Energy Drink Market Revenue (billion), by Soft Drink Type 2025 & 2033
- Figure 36: Europe Energy Drink Market Volume (K Units), by Soft Drink Type 2025 & 2033
- Figure 37: Europe Energy Drink Market Revenue Share (%), by Soft Drink Type 2025 & 2033
- Figure 38: Europe Energy Drink Market Volume Share (%), by Soft Drink Type 2025 & 2033
- Figure 39: Europe Energy Drink Market Revenue (billion), by Packaging Type 2025 & 2033
- Figure 40: Europe Energy Drink Market Volume (K Units), by Packaging Type 2025 & 2033
- Figure 41: Europe Energy Drink Market Revenue Share (%), by Packaging Type 2025 & 2033
- Figure 42: Europe Energy Drink Market Volume Share (%), by Packaging Type 2025 & 2033
- Figure 43: Europe Energy Drink Market Revenue (billion), by Distribution Channel 2025 & 2033
- Figure 44: Europe Energy Drink Market Volume (K Units), by Distribution Channel 2025 & 2033
- Figure 45: Europe Energy Drink Market Revenue Share (%), by Distribution Channel 2025 & 2033
- Figure 46: Europe Energy Drink Market Volume Share (%), by Distribution Channel 2025 & 2033
- Figure 47: Europe Energy Drink Market Revenue (billion), by Country 2025 & 2033
- Figure 48: Europe Energy Drink Market Volume (K Units), by Country 2025 & 2033
- Figure 49: Europe Energy Drink Market Revenue Share (%), by Country 2025 & 2033
- Figure 50: Europe Energy Drink Market Volume Share (%), by Country 2025 & 2033
- Figure 51: Middle East & Africa Energy Drink Market Revenue (billion), by Soft Drink Type 2025 & 2033
- Figure 52: Middle East & Africa Energy Drink Market Volume (K Units), by Soft Drink Type 2025 & 2033
- Figure 53: Middle East & Africa Energy Drink Market Revenue Share (%), by Soft Drink Type 2025 & 2033
- Figure 54: Middle East & Africa Energy Drink Market Volume Share (%), by Soft Drink Type 2025 & 2033
- Figure 55: Middle East & Africa Energy Drink Market Revenue (billion), by Packaging Type 2025 & 2033
- Figure 56: Middle East & Africa Energy Drink Market Volume (K Units), by Packaging Type 2025 & 2033
- Figure 57: Middle East & Africa Energy Drink Market Revenue Share (%), by Packaging Type 2025 & 2033
- Figure 58: Middle East & Africa Energy Drink Market Volume Share (%), by Packaging Type 2025 & 2033
- Figure 59: Middle East & Africa Energy Drink Market Revenue (billion), by Distribution Channel 2025 & 2033
- Figure 60: Middle East & Africa Energy Drink Market Volume (K Units), by Distribution Channel 2025 & 2033
- Figure 61: Middle East & Africa Energy Drink Market Revenue Share (%), by Distribution Channel 2025 & 2033
- Figure 62: Middle East & Africa Energy Drink Market Volume Share (%), by Distribution Channel 2025 & 2033
- Figure 63: Middle East & Africa Energy Drink Market Revenue (billion), by Country 2025 & 2033
- Figure 64: Middle East & Africa Energy Drink Market Volume (K Units), by Country 2025 & 2033
- Figure 65: Middle East & Africa Energy Drink Market Revenue Share (%), by Country 2025 & 2033
- Figure 66: Middle East & Africa Energy Drink Market Volume Share (%), by Country 2025 & 2033
- Figure 67: Asia Pacific Energy Drink Market Revenue (billion), by Soft Drink Type 2025 & 2033
- Figure 68: Asia Pacific Energy Drink Market Volume (K Units), by Soft Drink Type 2025 & 2033
- Figure 69: Asia Pacific Energy Drink Market Revenue Share (%), by Soft Drink Type 2025 & 2033
- Figure 70: Asia Pacific Energy Drink Market Volume Share (%), by Soft Drink Type 2025 & 2033
- Figure 71: Asia Pacific Energy Drink Market Revenue (billion), by Packaging Type 2025 & 2033
- Figure 72: Asia Pacific Energy Drink Market Volume (K Units), by Packaging Type 2025 & 2033
- Figure 73: Asia Pacific Energy Drink Market Revenue Share (%), by Packaging Type 2025 & 2033
- Figure 74: Asia Pacific Energy Drink Market Volume Share (%), by Packaging Type 2025 & 2033
- Figure 75: Asia Pacific Energy Drink Market Revenue (billion), by Distribution Channel 2025 & 2033
- Figure 76: Asia Pacific Energy Drink Market Volume (K Units), by Distribution Channel 2025 & 2033
- Figure 77: Asia Pacific Energy Drink Market Revenue Share (%), by Distribution Channel 2025 & 2033
- Figure 78: Asia Pacific Energy Drink Market Volume Share (%), by Distribution Channel 2025 & 2033
- Figure 79: Asia Pacific Energy Drink Market Revenue (billion), by Country 2025 & 2033
- Figure 80: Asia Pacific Energy Drink Market Volume (K Units), by Country 2025 & 2033
- Figure 81: Asia Pacific Energy Drink Market Revenue Share (%), by Country 2025 & 2033
- Figure 82: Asia Pacific Energy Drink Market Volume Share (%), by Country 2025 & 2033
List of Tables
- Table 1: Global Energy Drink Market Revenue billion Forecast, by Soft Drink Type 2020 & 2033
- Table 2: Global Energy Drink Market Volume K Units Forecast, by Soft Drink Type 2020 & 2033
- Table 3: Global Energy Drink Market Revenue billion Forecast, by Packaging Type 2020 & 2033
- Table 4: Global Energy Drink Market Volume K Units Forecast, by Packaging Type 2020 & 2033
- Table 5: Global Energy Drink Market Revenue billion Forecast, by Distribution Channel 2020 & 2033
- Table 6: Global Energy Drink Market Volume K Units Forecast, by Distribution Channel 2020 & 2033
- Table 7: Global Energy Drink Market Revenue billion Forecast, by Region 2020 & 2033
- Table 8: Global Energy Drink Market Volume K Units Forecast, by Region 2020 & 2033
- Table 9: Global Energy Drink Market Revenue billion Forecast, by Soft Drink Type 2020 & 2033
- Table 10: Global Energy Drink Market Volume K Units Forecast, by Soft Drink Type 2020 & 2033
- Table 11: Global Energy Drink Market Revenue billion Forecast, by Packaging Type 2020 & 2033
- Table 12: Global Energy Drink Market Volume K Units Forecast, by Packaging Type 2020 & 2033
- Table 13: Global Energy Drink Market Revenue billion Forecast, by Distribution Channel 2020 & 2033
- Table 14: Global Energy Drink Market Volume K Units Forecast, by Distribution Channel 2020 & 2033
- Table 15: Global Energy Drink Market Revenue billion Forecast, by Country 2020 & 2033
- Table 16: Global Energy Drink Market Volume K Units Forecast, by Country 2020 & 2033
- Table 17: United States Energy Drink Market Revenue (billion) Forecast, by Application 2020 & 2033
- Table 18: United States Energy Drink Market Volume (K Units) Forecast, by Application 2020 & 2033
- Table 19: Canada Energy Drink Market Revenue (billion) Forecast, by Application 2020 & 2033
- Table 20: Canada Energy Drink Market Volume (K Units) Forecast, by Application 2020 & 2033
- Table 21: Mexico Energy Drink Market Revenue (billion) Forecast, by Application 2020 & 2033
- Table 22: Mexico Energy Drink Market Volume (K Units) Forecast, by Application 2020 & 2033
- Table 23: Global Energy Drink Market Revenue billion Forecast, by Soft Drink Type 2020 & 2033
- Table 24: Global Energy Drink Market Volume K Units Forecast, by Soft Drink Type 2020 & 2033
- Table 25: Global Energy Drink Market Revenue billion Forecast, by Packaging Type 2020 & 2033
- Table 26: Global Energy Drink Market Volume K Units Forecast, by Packaging Type 2020 & 2033
- Table 27: Global Energy Drink Market Revenue billion Forecast, by Distribution Channel 2020 & 2033
- Table 28: Global Energy Drink Market Volume K Units Forecast, by Distribution Channel 2020 & 2033
- Table 29: Global Energy Drink Market Revenue billion Forecast, by Country 2020 & 2033
- Table 30: Global Energy Drink Market Volume K Units Forecast, by Country 2020 & 2033
- Table 31: Brazil Energy Drink Market Revenue (billion) Forecast, by Application 2020 & 2033
- Table 32: Brazil Energy Drink Market Volume (K Units) Forecast, by Application 2020 & 2033
- Table 33: Argentina Energy Drink Market Revenue (billion) Forecast, by Application 2020 & 2033
- Table 34: Argentina Energy Drink Market Volume (K Units) Forecast, by Application 2020 & 2033
- Table 35: Rest of South America Energy Drink Market Revenue (billion) Forecast, by Application 2020 & 2033
- Table 36: Rest of South America Energy Drink Market Volume (K Units) Forecast, by Application 2020 & 2033
- Table 37: Global Energy Drink Market Revenue billion Forecast, by Soft Drink Type 2020 & 2033
- Table 38: Global Energy Drink Market Volume K Units Forecast, by Soft Drink Type 2020 & 2033
- Table 39: Global Energy Drink Market Revenue billion Forecast, by Packaging Type 2020 & 2033
- Table 40: Global Energy Drink Market Volume K Units Forecast, by Packaging Type 2020 & 2033
- Table 41: Global Energy Drink Market Revenue billion Forecast, by Distribution Channel 2020 & 2033
- Table 42: Global Energy Drink Market Volume K Units Forecast, by Distribution Channel 2020 & 2033
- Table 43: Global Energy Drink Market Revenue billion Forecast, by Country 2020 & 2033
- Table 44: Global Energy Drink Market Volume K Units Forecast, by Country 2020 & 2033
- Table 45: United Kingdom Energy Drink Market Revenue (billion) Forecast, by Application 2020 & 2033
- Table 46: United Kingdom Energy Drink Market Volume (K Units) Forecast, by Application 2020 & 2033
- Table 47: Germany Energy Drink Market Revenue (billion) Forecast, by Application 2020 & 2033
- Table 48: Germany Energy Drink Market Volume (K Units) Forecast, by Application 2020 & 2033
- Table 49: France Energy Drink Market Revenue (billion) Forecast, by Application 2020 & 2033
- Table 50: France Energy Drink Market Volume (K Units) Forecast, by Application 2020 & 2033
- Table 51: Italy Energy Drink Market Revenue (billion) Forecast, by Application 2020 & 2033
- Table 52: Italy Energy Drink Market Volume (K Units) Forecast, by Application 2020 & 2033
- Table 53: Spain Energy Drink Market Revenue (billion) Forecast, by Application 2020 & 2033
- Table 54: Spain Energy Drink Market Volume (K Units) Forecast, by Application 2020 & 2033
- Table 55: Russia Energy Drink Market Revenue (billion) Forecast, by Application 2020 & 2033
- Table 56: Russia Energy Drink Market Volume (K Units) Forecast, by Application 2020 & 2033
- Table 57: Benelux Energy Drink Market Revenue (billion) Forecast, by Application 2020 & 2033
- Table 58: Benelux Energy Drink Market Volume (K Units) Forecast, by Application 2020 & 2033
- Table 59: Nordics Energy Drink Market Revenue (billion) Forecast, by Application 2020 & 2033
- Table 60: Nordics Energy Drink Market Volume (K Units) Forecast, by Application 2020 & 2033
- Table 61: Rest of Europe Energy Drink Market Revenue (billion) Forecast, by Application 2020 & 2033
- Table 62: Rest of Europe Energy Drink Market Volume (K Units) Forecast, by Application 2020 & 2033
- Table 63: Global Energy Drink Market Revenue billion Forecast, by Soft Drink Type 2020 & 2033
- Table 64: Global Energy Drink Market Volume K Units Forecast, by Soft Drink Type 2020 & 2033
- Table 65: Global Energy Drink Market Revenue billion Forecast, by Packaging Type 2020 & 2033
- Table 66: Global Energy Drink Market Volume K Units Forecast, by Packaging Type 2020 & 2033
- Table 67: Global Energy Drink Market Revenue billion Forecast, by Distribution Channel 2020 & 2033
- Table 68: Global Energy Drink Market Volume K Units Forecast, by Distribution Channel 2020 & 2033
- Table 69: Global Energy Drink Market Revenue billion Forecast, by Country 2020 & 2033
- Table 70: Global Energy Drink Market Volume K Units Forecast, by Country 2020 & 2033
- Table 71: Turkey Energy Drink Market Revenue (billion) Forecast, by Application 2020 & 2033
- Table 72: Turkey Energy Drink Market Volume (K Units) Forecast, by Application 2020 & 2033
- Table 73: Israel Energy Drink Market Revenue (billion) Forecast, by Application 2020 & 2033
- Table 74: Israel Energy Drink Market Volume (K Units) Forecast, by Application 2020 & 2033
- Table 75: GCC Energy Drink Market Revenue (billion) Forecast, by Application 2020 & 2033
- Table 76: GCC Energy Drink Market Volume (K Units) Forecast, by Application 2020 & 2033
- Table 77: North Africa Energy Drink Market Revenue (billion) Forecast, by Application 2020 & 2033
- Table 78: North Africa Energy Drink Market Volume (K Units) Forecast, by Application 2020 & 2033
- Table 79: South Africa Energy Drink Market Revenue (billion) Forecast, by Application 2020 & 2033
- Table 80: South Africa Energy Drink Market Volume (K Units) Forecast, by Application 2020 & 2033
- Table 81: Rest of Middle East & Africa Energy Drink Market Revenue (billion) Forecast, by Application 2020 & 2033
- Table 82: Rest of Middle East & Africa Energy Drink Market Volume (K Units) Forecast, by Application 2020 & 2033
- Table 83: Global Energy Drink Market Revenue billion Forecast, by Soft Drink Type 2020 & 2033
- Table 84: Global Energy Drink Market Volume K Units Forecast, by Soft Drink Type 2020 & 2033
- Table 85: Global Energy Drink Market Revenue billion Forecast, by Packaging Type 2020 & 2033
- Table 86: Global Energy Drink Market Volume K Units Forecast, by Packaging Type 2020 & 2033
- Table 87: Global Energy Drink Market Revenue billion Forecast, by Distribution Channel 2020 & 2033
- Table 88: Global Energy Drink Market Volume K Units Forecast, by Distribution Channel 2020 & 2033
- Table 89: Global Energy Drink Market Revenue billion Forecast, by Country 2020 & 2033
- Table 90: Global Energy Drink Market Volume K Units Forecast, by Country 2020 & 2033
- Table 91: China Energy Drink Market Revenue (billion) Forecast, by Application 2020 & 2033
- Table 92: China Energy Drink Market Volume (K Units) Forecast, by Application 2020 & 2033
- Table 93: India Energy Drink Market Revenue (billion) Forecast, by Application 2020 & 2033
- Table 94: India Energy Drink Market Volume (K Units) Forecast, by Application 2020 & 2033
- Table 95: Japan Energy Drink Market Revenue (billion) Forecast, by Application 2020 & 2033
- Table 96: Japan Energy Drink Market Volume (K Units) Forecast, by Application 2020 & 2033
- Table 97: South Korea Energy Drink Market Revenue (billion) Forecast, by Application 2020 & 2033
- Table 98: South Korea Energy Drink Market Volume (K Units) Forecast, by Application 2020 & 2033
- Table 99: ASEAN Energy Drink Market Revenue (billion) Forecast, by Application 2020 & 2033
- Table 100: ASEAN Energy Drink Market Volume (K Units) Forecast, by Application 2020 & 2033
- Table 101: Oceania Energy Drink Market Revenue (billion) Forecast, by Application 2020 & 2033
- Table 102: Oceania Energy Drink Market Volume (K Units) Forecast, by Application 2020 & 2033
- Table 103: Rest of Asia Pacific Energy Drink Market Revenue (billion) Forecast, by Application 2020 & 2033
- Table 104: Rest of Asia Pacific Energy Drink Market Volume (K Units) Forecast, by Application 2020 & 2033
Frequently Asked Questions
1. What is the projected Compound Annual Growth Rate (CAGR) of the Energy Drink Market?
The projected CAGR is approximately 6.8%.
2. Which companies are prominent players in the Energy Drink Market?
Key companies in the market include Hell Energy Magyarország Korlátolt Felelosségu Társaság, Ghodawat Consumer Limited, Monster Beverage Corporation, PepsiCo Inc, Tata Consumer Products Ltd, The Coca-Cola Compan, Red Bull GmbH, Ocean Drinks Private Limited, BPI Sports LLC, Hector Beverages Private Limited, Anheuser-Busch InBev SA/NV, Radiohead Brands Private Limited.
3. What are the main segments of the Energy Drink Market?
The market segments include Soft Drink Type, Packaging Type, Distribution Channel.
4. Can you provide details about the market size?
The market size is estimated to be USD 87.8 billion as of 2022.
5. What are some drivers contributing to market growth?
Increasing Focus on Maintaining Health and Well-Being; Launching Supplements For Specific Purposes and Targeted Population.
6. What are the notable trends driving market growth?
OTHER KEY INDUSTRY TRENDS COVERED IN THE REPORT.
7. Are there any restraints impacting market growth?
Supplement Consumption and Their Side-effects; Inclination Towards Substitute Products.
8. Can you provide examples of recent developments in the market?
September 2023: PepsiCo India launched a limited edition flavor of its Sting Energy drink, called Sting Blue Current. Sting Blue Current is available at 200 ml in single-serve packs across India.July 2023: Radiohead Brands, the parent company of Jimmy’s Cocktails, has secured USD 1.3 Million in a pre-series A funding round from Vijay Shekhar Sharma and Prath Ventures. The proceeds will be used for the expansion of its new energy drink, Hustle.May 2023: Anheuser Busch InBev India (AB InBev) has launched its new energy drink Budweiser Beats in India in 2021.
9. What pricing options are available for accessing the report?
Pricing options include single-user, multi-user, and enterprise licenses priced at USD 3800, USD 4500, and USD 5800 respectively.
10. Is the market size provided in terms of value or volume?
The market size is provided in terms of value, measured in billion and volume, measured in K Units.
11. Are there any specific market keywords associated with the report?
Yes, the market keyword associated with the report is "Energy Drink Market," which aids in identifying and referencing the specific market segment covered.
12. How do I determine which pricing option suits my needs best?
The pricing options vary based on user requirements and access needs. Individual users may opt for single-user licenses, while businesses requiring broader access may choose multi-user or enterprise licenses for cost-effective access to the report.
13. Are there any additional resources or data provided in the Energy Drink Market report?
While the report offers comprehensive insights, it's advisable to review the specific contents or supplementary materials provided to ascertain if additional resources or data are available.
14. How can I stay updated on further developments or reports in the Energy Drink Market?
To stay informed about further developments, trends, and reports in the Energy Drink Market, consider subscribing to industry newsletters, following relevant companies and organizations, or regularly checking reputable industry news sources and publications.
Methodology
Step 1 - Identification of Relevant Samples Size from Population Database


Step 2 - Approaches for Defining Global Market Size (Value, Volume* & Price*)

Note*: In applicable scenarios
Step 3 - Data Sources
Primary Research
- Web Analytics
- Survey Reports
- Research Institute
- Latest Research Reports
- Opinion Leaders
Secondary Research
- Annual Reports
- White Paper
- Latest Press Release
- Industry Association
- Paid Database
- Investor Presentations

Step 4 - Data Triangulation
Involves using different sources of information in order to increase the validity of a study
These sources are likely to be stakeholders in a program - participants, other researchers, program staff, other community members, and so on.
Then we put all data in single framework & apply various statistical tools to find out the dynamic on the market.
During the analysis stage, feedback from the stakeholder groups would be compared to determine areas of agreement as well as areas of divergence