

Key Insights
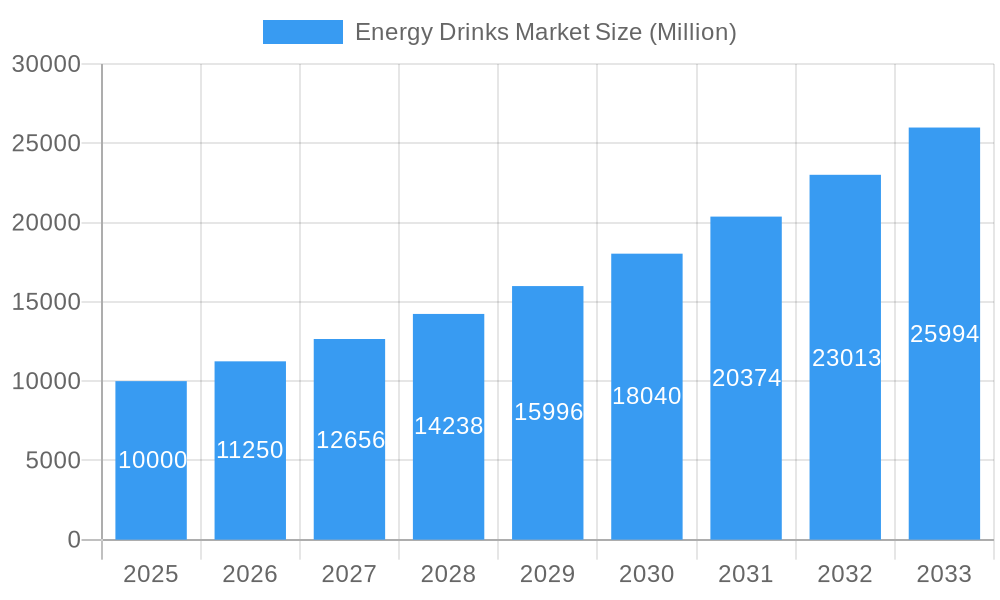
The global energy drink market, currently valued at $23.9 billion, is projected to reach substantial future market values by 2033, driven by a CAGR of 9.7% from the base year 2025. This robust growth is attributed to escalating demand from consumers with demanding lifestyles seeking convenient energy solutions. Innovations in product formulations, including sugar-free, low-calorie, natural, organic, and functional energy shots, are catering to a growing health-conscious demographic. Aggressive marketing strategies highlighting enhanced athletic performance and cognitive function further stimulate market expansion. Diverse packaging options and multi-channel distribution strategies, encompassing both on-trade and off-trade sectors, support broad market penetration. However, concerns regarding the health implications of high sugar content in traditional offerings present a market restraint, fostering a shift towards healthier alternatives.
Energy Drinks Market Market Size (In Billion)
Despite challenges, market segmentation reveals significant opportunities, particularly within functional energy drinks and shots, underscoring consumer preference for efficacy and convenience. The market is characterized by intense competition, with major players like Red Bull and Monster Beverage Corporation investing heavily in R&D, branding, and strategic alliances. Emerging regional markets also represent considerable growth potential. Future market dynamics will be shaped by a continued emphasis on health-conscious formulations, impactful marketing, and strategic collaborations, encouraging product diversification and geographical expansion to capitalize on burgeoning demand.
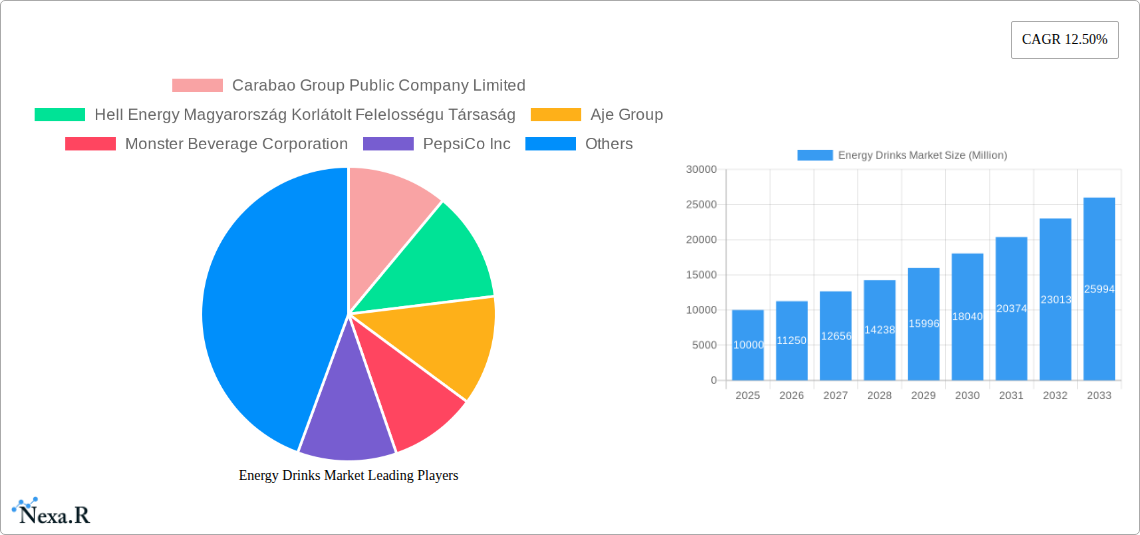
Energy Drinks Market Company Market Share
This comprehensive report offers an in-depth analysis of the global energy drinks market, covering historical data, current estimates for 2025, and future projections through 2033. The study examines market dynamics, growth trends, regional performance, product segmentation by type (Energy Shots, Natural/Organic, Sugar-free/Low-Calorie, Traditional, Other), packaging (Glass Bottles, Metal Cans, PET Bottles), and distribution channels (Off-trade, On-trade). It provides critical insights for industry professionals and investors, enabling informed strategic planning by clarifying consumer preferences, technological advancements, and competitive landscapes.
Energy Drinks Market Dynamics & Structure
The global energy drink market, valued at xx Million units in 2024, is characterized by a moderately concentrated structure with key players holding significant market shares. Technological innovation, particularly in natural and low-sugar formulations, is a key driver, alongside evolving consumer preferences towards healthier options. Regulatory frameworks concerning sugar content and marketing practices influence market dynamics significantly. Competitive substitutes, such as sports drinks and functional beverages, pose a challenge. The market exhibits considerable end-user diversity, encompassing young adults, athletes, and professionals seeking enhanced energy and focus. M&A activity is moderate, with strategic acquisitions aimed at expanding product portfolios and geographical reach.
- Market Concentration: High, with top 10 players holding approximately xx% market share in 2024.
- Technological Innovation: Focus on natural ingredients, functional benefits, and sustainable packaging.
- Regulatory Frameworks: Varying regulations on sugar content and marketing across different regions.
- Competitive Substitutes: Sports drinks, coffee, and functional beverages.
- End-User Demographics: Primarily young adults (18-35), athletes, and professionals.
- M&A Trends: Strategic acquisitions for portfolio diversification and market expansion (xx deals in 2024).
Energy Drinks Market Growth Trends & Insights
The global energy drinks market demonstrates robust growth, exhibiting a CAGR of xx% during the historical period (2019-2024). This growth is attributed to increasing consumer demand for convenient energy boosts, coupled with the introduction of innovative product formulations, such as sugar-free and natural options. Technological disruptions, including the use of advanced packaging and distribution systems, are enhancing market reach and efficiency. Consumer behavior is shifting towards healthier choices, with a rising preference for natural and functional ingredients. Market penetration varies across regions, with developed economies exhibiting higher saturation levels compared to emerging markets. The forecast period (2025-2033) anticipates continued growth, driven by expanding product portfolios, improved distribution networks, and increasing consumer awareness.
- Market Size (2024): xx Million units
- CAGR (2019-2024): xx%
- Market Penetration (2024): xx% in developed markets; xx% in emerging markets.
- Key Growth Drivers: Product innovation, expanding distribution, changing consumer preferences.
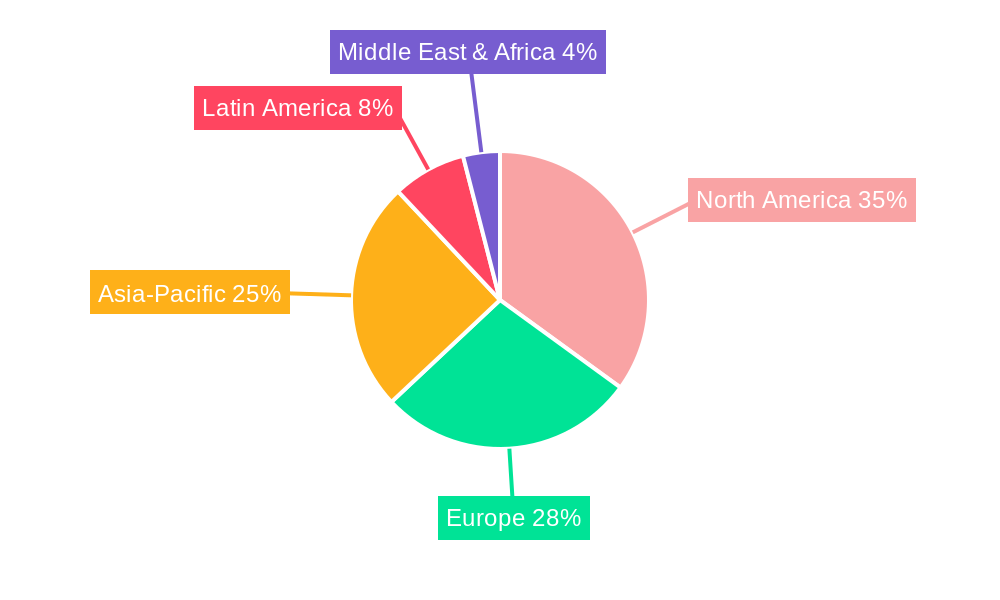
Dominant Regions, Countries, or Segments in Energy Drinks Market
The North American market holds the largest market share in the energy drink sector, driven by high consumer spending power and strong brand presence. Within North America, the United States exhibits significant dominance, fueled by established distribution networks and a large consumer base. However, Asia-Pacific is expected to experience rapid growth during the forecast period, owing to rising disposable incomes, and increasing health consciousness in emerging economies. Among product segments, Traditional Energy Drinks maintains the largest share; however, Sugar-free or Low-calories Energy Drinks are experiencing the fastest growth rate due to increasing health awareness. The Metal Can packaging type holds a considerable market share due to its cost-effectiveness and suitability for long shelf-life. The Off-trade distribution channel dominates, reflecting increased consumer purchasing from retail outlets.
- Leading Region: North America (Market share xx% in 2024)
- Fastest-Growing Region: Asia-Pacific (Projected CAGR of xx% during 2025-2033)
- Dominant Segment (Soft Drink Type): Traditional Energy Drinks (Market share xx% in 2024)
- Fastest-Growing Segment (Soft Drink Type): Sugar-free/Low-calorie Energy Drinks (Projected CAGR of xx% during 2025-2033)
- Dominant Packaging Type: Metal Can (Market share xx% in 2024)
- Dominant Distribution Channel: Off-trade (Market share xx% in 2024)
Energy Drinks Market Product Landscape
The energy drink market features diverse product offerings, from traditional high-sugar formulations to innovative low-sugar, natural, and organic variations. Key product innovations include the introduction of functional ingredients, such as vitamins, antioxidants, and nootropics. Companies are focusing on enhancing taste profiles and incorporating unique flavor combinations to cater to evolving consumer preferences. Performance metrics, such as sugar content, caffeine levels, and overall nutritional value, are increasingly emphasized on product labels. Brands compete on the basis of taste, functional benefits, and brand image, with some employing sustainability practices to attract environmentally conscious consumers.
Key Drivers, Barriers & Challenges in Energy Drinks Market
Key Drivers:
- Growing demand for convenient energy boosts.
- Increasing health consciousness leading to the development of healthier options (sugar-free, natural).
- Expansion of distribution networks into emerging markets.
- Technological advancements in packaging and manufacturing.
Challenges:
- Intense competition among established and emerging brands.
- Stringent regulations on sugar content and marketing in several regions.
- Supply chain disruptions impacting the availability of raw materials.
- Fluctuations in commodity prices increasing production costs.
Emerging Opportunities in Energy Drinks Market
- Growing demand for natural and organic energy drinks.
- Expansion into untapped markets in developing countries.
- Development of functional energy drinks with added health benefits.
- Growing interest in sustainable and eco-friendly packaging solutions.
Growth Accelerators in the Energy Drinks Market Industry
Technological advancements in formulation, packaging, and manufacturing will continue to accelerate growth. Strategic partnerships between energy drink companies and retailers will ensure broader market reach. Expansion into new geographic markets, especially in developing economies, presents considerable potential for growth. Furthermore, the development of novel product lines catering to specific health trends will drive long-term growth.
Key Players Shaping the Energy Drinks Market Market
- Carabao Group Public Company Limited
- Hell Energy Magyarország Korlátolt Felelosségu Társaság
- Aje Group
- Monster Beverage Corporation
- PepsiCo Inc
- The Coca-Cola Company
- Suntory Holdings Limited
- Red Bull GmbH
- Living Essentials LLC
- T C Pharmaceutical Industries Company Limited
- Taisho Pharmaceutical Holdings Co Ltd
- Congo Brands
- Osotspa Public Company Limited
Notable Milestones in Energy Drinks Market Sector
- September 2023: PepsiCo India launched Sting Blue Current, a limited-edition flavor.
- September 2023: Red Bull launched its first limited Winter Edition in the UK.
- October 2023: Quality Pack International (Hell Group) and an Azerbaijani company established Quality Pack Capian LLC, a joint venture for aluminum can manufacturing and beverage filling.
In-Depth Energy Drinks Market Market Outlook
The future of the energy drinks market is promising, driven by sustained demand, product innovation, and expansion into new markets. Strategic partnerships, mergers and acquisitions, and continued investment in research and development will shape the competitive landscape. Companies that successfully adapt to evolving consumer preferences and regulatory changes will capture significant market share. The market will witness further diversification in product offerings, catering to the demand for healthy, functional beverages with unique flavor profiles and enhanced consumer experiences.
Energy Drinks Market Segmentation
-
1. Soft Drink Type
- 1.1. Energy Shots
- 1.2. Natural/Organic Energy Drinks
- 1.3. Sugar-free or Low-calories Energy Drinks
- 1.4. Traditional Energy Drinks
- 1.5. Other Energy Drinks
-
2. Packaging Type
- 2.1. Glass Bottles
- 2.2. Metal Can
- 2.3. PET Bottles
-
3. Distribution Channel
-
3.1. Off-trade
- 3.1.1. Convenience Stores
- 3.1.2. Online Retail
- 3.1.3. Supermarket/Hypermarket
- 3.1.4. Others
- 3.2. On-trade
-
3.1. Off-trade
Energy Drinks Market Segmentation By Geography
-
1. North America
- 1.1. United States
- 1.2. Canada
- 1.3. Mexico
-
2. South America
- 2.1. Brazil
- 2.2. Argentina
- 2.3. Rest of South America
-
3. Europe
- 3.1. United Kingdom
- 3.2. Germany
- 3.3. France
- 3.4. Italy
- 3.5. Spain
- 3.6. Russia
- 3.7. Benelux
- 3.8. Nordics
- 3.9. Rest of Europe
-
4. Middle East & Africa
- 4.1. Turkey
- 4.2. Israel
- 4.3. GCC
- 4.4. North Africa
- 4.5. South Africa
- 4.6. Rest of Middle East & Africa
-
5. Asia Pacific
- 5.1. China
- 5.2. India
- 5.3. Japan
- 5.4. South Korea
- 5.5. ASEAN
- 5.6. Oceania
- 5.7. Rest of Asia Pacific
Energy Drinks Market Regional Market Share
Geographic Coverage of Energy Drinks Market
Energy Drinks Market REPORT HIGHLIGHTS
| Aspects | Details |
|---|---|
| Study Period | 2020-2034 |
| Base Year | 2025 |
| Estimated Year | 2026 |
| Forecast Period | 2026-2034 |
| Historical Period | 2020-2025 |
| Growth Rate | CAGR of 9.7% from 2020-2034 |
| Segmentation |
|
Table of Contents
- 1. Introduction
- 1.1. Research Scope
- 1.2. Market Segmentation
- 1.3. Research Objective
- 1.4. Definitions and Assumptions
- 2. Executive Summary
- 2.1. Market Snapshot
- 3. Market Dynamics
- 3.1. Market Drivers
- 3.2. Market Restrains
- 3.3. Market Trends
- 3.4. Market Opportunities
- 4. Market Factor Analysis
- 4.1. Porters Five Forces
- 4.1.1. Bargaining Power of Suppliers
- 4.1.2. Bargaining Power of Buyers
- 4.1.3. Threat of New Entrants
- 4.1.4. Threat of Substitutes
- 4.1.5. Competitive Rivalry
- 4.2. PESTEL analysis
- 4.3. BCG Analysis
- 4.3.1. Stars (High Growth, High Market Share)
- 4.3.2. Cash Cows (Low Growth, High Market Share)
- 4.3.3. Question Mark (High Growth, Low Market Share)
- 4.3.4. Dogs (Low Growth, Low Market Share)
- 4.4. Ansoff Matrix Analysis
- 4.5. Supply Chain Analysis
- 4.6. Regulatory Landscape
- 4.7. Current Market Potential and Opportunity Assessment (TAM–SAM–SOM Framework)
- 4.8. NRP Analyst Note
- 4.1. Porters Five Forces
- 5. Market Analysis, Insights and Forecast 2021-2033
- 5.1. Market Analysis, Insights and Forecast - by Soft Drink Type
- 5.1.1. Energy Shots
- 5.1.2. Natural/Organic Energy Drinks
- 5.1.3. Sugar-free or Low-calories Energy Drinks
- 5.1.4. Traditional Energy Drinks
- 5.1.5. Other Energy Drinks
- 5.2. Market Analysis, Insights and Forecast - by Packaging Type
- 5.2.1. Glass Bottles
- 5.2.2. Metal Can
- 5.2.3. PET Bottles
- 5.3. Market Analysis, Insights and Forecast - by Distribution Channel
- 5.3.1. Off-trade
- 5.3.1.1. Convenience Stores
- 5.3.1.2. Online Retail
- 5.3.1.3. Supermarket/Hypermarket
- 5.3.1.4. Others
- 5.3.2. On-trade
- 5.3.1. Off-trade
- 5.4. Market Analysis, Insights and Forecast - by Region
- 5.4.1. North America
- 5.4.2. South America
- 5.4.3. Europe
- 5.4.4. Middle East & Africa
- 5.4.5. Asia Pacific
- 5.1. Market Analysis, Insights and Forecast - by Soft Drink Type
- 6. Global Energy Drinks Market Analysis, Insights and Forecast, 2021-2033
- 6.1. Market Analysis, Insights and Forecast - by Soft Drink Type
- 6.1.1. Energy Shots
- 6.1.2. Natural/Organic Energy Drinks
- 6.1.3. Sugar-free or Low-calories Energy Drinks
- 6.1.4. Traditional Energy Drinks
- 6.1.5. Other Energy Drinks
- 6.2. Market Analysis, Insights and Forecast - by Packaging Type
- 6.2.1. Glass Bottles
- 6.2.2. Metal Can
- 6.2.3. PET Bottles
- 6.3. Market Analysis, Insights and Forecast - by Distribution Channel
- 6.3.1. Off-trade
- 6.3.1.1. Convenience Stores
- 6.3.1.2. Online Retail
- 6.3.1.3. Supermarket/Hypermarket
- 6.3.1.4. Others
- 6.3.2. On-trade
- 6.3.1. Off-trade
- 6.1. Market Analysis, Insights and Forecast - by Soft Drink Type
- 7. North America Energy Drinks Market Analysis, Insights and Forecast, 2020-2032
- 7.1. Market Analysis, Insights and Forecast - by Soft Drink Type
- 7.1.1. Energy Shots
- 7.1.2. Natural/Organic Energy Drinks
- 7.1.3. Sugar-free or Low-calories Energy Drinks
- 7.1.4. Traditional Energy Drinks
- 7.1.5. Other Energy Drinks
- 7.2. Market Analysis, Insights and Forecast - by Packaging Type
- 7.2.1. Glass Bottles
- 7.2.2. Metal Can
- 7.2.3. PET Bottles
- 7.3. Market Analysis, Insights and Forecast - by Distribution Channel
- 7.3.1. Off-trade
- 7.3.1.1. Convenience Stores
- 7.3.1.2. Online Retail
- 7.3.1.3. Supermarket/Hypermarket
- 7.3.1.4. Others
- 7.3.2. On-trade
- 7.3.1. Off-trade
- 7.1. Market Analysis, Insights and Forecast - by Soft Drink Type
- 8. South America Energy Drinks Market Analysis, Insights and Forecast, 2020-2032
- 8.1. Market Analysis, Insights and Forecast - by Soft Drink Type
- 8.1.1. Energy Shots
- 8.1.2. Natural/Organic Energy Drinks
- 8.1.3. Sugar-free or Low-calories Energy Drinks
- 8.1.4. Traditional Energy Drinks
- 8.1.5. Other Energy Drinks
- 8.2. Market Analysis, Insights and Forecast - by Packaging Type
- 8.2.1. Glass Bottles
- 8.2.2. Metal Can
- 8.2.3. PET Bottles
- 8.3. Market Analysis, Insights and Forecast - by Distribution Channel
- 8.3.1. Off-trade
- 8.3.1.1. Convenience Stores
- 8.3.1.2. Online Retail
- 8.3.1.3. Supermarket/Hypermarket
- 8.3.1.4. Others
- 8.3.2. On-trade
- 8.3.1. Off-trade
- 8.1. Market Analysis, Insights and Forecast - by Soft Drink Type
- 9. Europe Energy Drinks Market Analysis, Insights and Forecast, 2020-2032
- 9.1. Market Analysis, Insights and Forecast - by Soft Drink Type
- 9.1.1. Energy Shots
- 9.1.2. Natural/Organic Energy Drinks
- 9.1.3. Sugar-free or Low-calories Energy Drinks
- 9.1.4. Traditional Energy Drinks
- 9.1.5. Other Energy Drinks
- 9.2. Market Analysis, Insights and Forecast - by Packaging Type
- 9.2.1. Glass Bottles
- 9.2.2. Metal Can
- 9.2.3. PET Bottles
- 9.3. Market Analysis, Insights and Forecast - by Distribution Channel
- 9.3.1. Off-trade
- 9.3.1.1. Convenience Stores
- 9.3.1.2. Online Retail
- 9.3.1.3. Supermarket/Hypermarket
- 9.3.1.4. Others
- 9.3.2. On-trade
- 9.3.1. Off-trade
- 9.1. Market Analysis, Insights and Forecast - by Soft Drink Type
- 10. Middle East & Africa Energy Drinks Market Analysis, Insights and Forecast, 2020-2032
- 10.1. Market Analysis, Insights and Forecast - by Soft Drink Type
- 10.1.1. Energy Shots
- 10.1.2. Natural/Organic Energy Drinks
- 10.1.3. Sugar-free or Low-calories Energy Drinks
- 10.1.4. Traditional Energy Drinks
- 10.1.5. Other Energy Drinks
- 10.2. Market Analysis, Insights and Forecast - by Packaging Type
- 10.2.1. Glass Bottles
- 10.2.2. Metal Can
- 10.2.3. PET Bottles
- 10.3. Market Analysis, Insights and Forecast - by Distribution Channel
- 10.3.1. Off-trade
- 10.3.1.1. Convenience Stores
- 10.3.1.2. Online Retail
- 10.3.1.3. Supermarket/Hypermarket
- 10.3.1.4. Others
- 10.3.2. On-trade
- 10.3.1. Off-trade
- 10.1. Market Analysis, Insights and Forecast - by Soft Drink Type
- 11. Asia Pacific Energy Drinks Market Analysis, Insights and Forecast, 2020-2032
- 11.1. Market Analysis, Insights and Forecast - by Soft Drink Type
- 11.1.1. Energy Shots
- 11.1.2. Natural/Organic Energy Drinks
- 11.1.3. Sugar-free or Low-calories Energy Drinks
- 11.1.4. Traditional Energy Drinks
- 11.1.5. Other Energy Drinks
- 11.2. Market Analysis, Insights and Forecast - by Packaging Type
- 11.2.1. Glass Bottles
- 11.2.2. Metal Can
- 11.2.3. PET Bottles
- 11.3. Market Analysis, Insights and Forecast - by Distribution Channel
- 11.3.1. Off-trade
- 11.3.1.1. Convenience Stores
- 11.3.1.2. Online Retail
- 11.3.1.3. Supermarket/Hypermarket
- 11.3.1.4. Others
- 11.3.2. On-trade
- 11.3.1. Off-trade
- 11.1. Market Analysis, Insights and Forecast - by Soft Drink Type
- 12. Competitive Analysis
- 12.1. Company Profiles
- 12.1.1 Carabao Group Public Company Limited
- 12.1.1.1. Company Overview
- 12.1.1.2. Products
- 12.1.1.3. Company Financials
- 12.1.1.4. SWOT Analysis
- 12.1.2 Hell Energy Magyarország Korlátolt Felelosségu Társaság
- 12.1.2.1. Company Overview
- 12.1.2.2. Products
- 12.1.2.3. Company Financials
- 12.1.2.4. SWOT Analysis
- 12.1.3 Aje Group
- 12.1.3.1. Company Overview
- 12.1.3.2. Products
- 12.1.3.3. Company Financials
- 12.1.3.4. SWOT Analysis
- 12.1.4 Monster Beverage Corporation
- 12.1.4.1. Company Overview
- 12.1.4.2. Products
- 12.1.4.3. Company Financials
- 12.1.4.4. SWOT Analysis
- 12.1.5 PepsiCo Inc
- 12.1.5.1. Company Overview
- 12.1.5.2. Products
- 12.1.5.3. Company Financials
- 12.1.5.4. SWOT Analysis
- 12.1.6 The Coca-Cola Compan
- 12.1.6.1. Company Overview
- 12.1.6.2. Products
- 12.1.6.3. Company Financials
- 12.1.6.4. SWOT Analysis
- 12.1.7 Suntory Holdings Limited
- 12.1.7.1. Company Overview
- 12.1.7.2. Products
- 12.1.7.3. Company Financials
- 12.1.7.4. SWOT Analysis
- 12.1.8 Red Bull GmbH
- 12.1.8.1. Company Overview
- 12.1.8.2. Products
- 12.1.8.3. Company Financials
- 12.1.8.4. SWOT Analysis
- 12.1.9 Living Essentials LLC
- 12.1.9.1. Company Overview
- 12.1.9.2. Products
- 12.1.9.3. Company Financials
- 12.1.9.4. SWOT Analysis
- 12.1.10 T C Pharmaceutical Industries Company Limited
- 12.1.10.1. Company Overview
- 12.1.10.2. Products
- 12.1.10.3. Company Financials
- 12.1.10.4. SWOT Analysis
- 12.1.11 Taisho Pharmaceutical Holdings Co Ltd
- 12.1.11.1. Company Overview
- 12.1.11.2. Products
- 12.1.11.3. Company Financials
- 12.1.11.4. SWOT Analysis
- 12.1.12 Congo Brands
- 12.1.12.1. Company Overview
- 12.1.12.2. Products
- 12.1.12.3. Company Financials
- 12.1.12.4. SWOT Analysis
- 12.1.13 Osotspa Public Company Limited
- 12.1.13.1. Company Overview
- 12.1.13.2. Products
- 12.1.13.3. Company Financials
- 12.1.13.4. SWOT Analysis
- 12.1.1 Carabao Group Public Company Limited
- 12.2. Market Entropy
- 12.2.1 Company's Key Areas Served
- 12.2.2 Recent Developments
- 12.3. Company Market Share Analysis 2025
- 12.3.1 Top 5 Companies Market Share Analysis
- 12.3.2 Top 3 Companies Market Share Analysis
- 12.4. List of Potential Customers
- 13. Research Methodology
List of Figures
- Figure 1: Global Energy Drinks Market Revenue Breakdown (billion, %) by Region 2025 & 2033
- Figure 2: North America Energy Drinks Market Revenue (billion), by Soft Drink Type 2025 & 2033
- Figure 3: North America Energy Drinks Market Revenue Share (%), by Soft Drink Type 2025 & 2033
- Figure 4: North America Energy Drinks Market Revenue (billion), by Packaging Type 2025 & 2033
- Figure 5: North America Energy Drinks Market Revenue Share (%), by Packaging Type 2025 & 2033
- Figure 6: North America Energy Drinks Market Revenue (billion), by Distribution Channel 2025 & 2033
- Figure 7: North America Energy Drinks Market Revenue Share (%), by Distribution Channel 2025 & 2033
- Figure 8: North America Energy Drinks Market Revenue (billion), by Country 2025 & 2033
- Figure 9: North America Energy Drinks Market Revenue Share (%), by Country 2025 & 2033
- Figure 10: South America Energy Drinks Market Revenue (billion), by Soft Drink Type 2025 & 2033
- Figure 11: South America Energy Drinks Market Revenue Share (%), by Soft Drink Type 2025 & 2033
- Figure 12: South America Energy Drinks Market Revenue (billion), by Packaging Type 2025 & 2033
- Figure 13: South America Energy Drinks Market Revenue Share (%), by Packaging Type 2025 & 2033
- Figure 14: South America Energy Drinks Market Revenue (billion), by Distribution Channel 2025 & 2033
- Figure 15: South America Energy Drinks Market Revenue Share (%), by Distribution Channel 2025 & 2033
- Figure 16: South America Energy Drinks Market Revenue (billion), by Country 2025 & 2033
- Figure 17: South America Energy Drinks Market Revenue Share (%), by Country 2025 & 2033
- Figure 18: Europe Energy Drinks Market Revenue (billion), by Soft Drink Type 2025 & 2033
- Figure 19: Europe Energy Drinks Market Revenue Share (%), by Soft Drink Type 2025 & 2033
- Figure 20: Europe Energy Drinks Market Revenue (billion), by Packaging Type 2025 & 2033
- Figure 21: Europe Energy Drinks Market Revenue Share (%), by Packaging Type 2025 & 2033
- Figure 22: Europe Energy Drinks Market Revenue (billion), by Distribution Channel 2025 & 2033
- Figure 23: Europe Energy Drinks Market Revenue Share (%), by Distribution Channel 2025 & 2033
- Figure 24: Europe Energy Drinks Market Revenue (billion), by Country 2025 & 2033
- Figure 25: Europe Energy Drinks Market Revenue Share (%), by Country 2025 & 2033
- Figure 26: Middle East & Africa Energy Drinks Market Revenue (billion), by Soft Drink Type 2025 & 2033
- Figure 27: Middle East & Africa Energy Drinks Market Revenue Share (%), by Soft Drink Type 2025 & 2033
- Figure 28: Middle East & Africa Energy Drinks Market Revenue (billion), by Packaging Type 2025 & 2033
- Figure 29: Middle East & Africa Energy Drinks Market Revenue Share (%), by Packaging Type 2025 & 2033
- Figure 30: Middle East & Africa Energy Drinks Market Revenue (billion), by Distribution Channel 2025 & 2033
- Figure 31: Middle East & Africa Energy Drinks Market Revenue Share (%), by Distribution Channel 2025 & 2033
- Figure 32: Middle East & Africa Energy Drinks Market Revenue (billion), by Country 2025 & 2033
- Figure 33: Middle East & Africa Energy Drinks Market Revenue Share (%), by Country 2025 & 2033
- Figure 34: Asia Pacific Energy Drinks Market Revenue (billion), by Soft Drink Type 2025 & 2033
- Figure 35: Asia Pacific Energy Drinks Market Revenue Share (%), by Soft Drink Type 2025 & 2033
- Figure 36: Asia Pacific Energy Drinks Market Revenue (billion), by Packaging Type 2025 & 2033
- Figure 37: Asia Pacific Energy Drinks Market Revenue Share (%), by Packaging Type 2025 & 2033
- Figure 38: Asia Pacific Energy Drinks Market Revenue (billion), by Distribution Channel 2025 & 2033
- Figure 39: Asia Pacific Energy Drinks Market Revenue Share (%), by Distribution Channel 2025 & 2033
- Figure 40: Asia Pacific Energy Drinks Market Revenue (billion), by Country 2025 & 2033
- Figure 41: Asia Pacific Energy Drinks Market Revenue Share (%), by Country 2025 & 2033
List of Tables
- Table 1: Global Energy Drinks Market Revenue billion Forecast, by Soft Drink Type 2020 & 2033
- Table 2: Global Energy Drinks Market Revenue billion Forecast, by Packaging Type 2020 & 2033
- Table 3: Global Energy Drinks Market Revenue billion Forecast, by Distribution Channel 2020 & 2033
- Table 4: Global Energy Drinks Market Revenue billion Forecast, by Region 2020 & 2033
- Table 5: Global Energy Drinks Market Revenue billion Forecast, by Soft Drink Type 2020 & 2033
- Table 6: Global Energy Drinks Market Revenue billion Forecast, by Packaging Type 2020 & 2033
- Table 7: Global Energy Drinks Market Revenue billion Forecast, by Distribution Channel 2020 & 2033
- Table 8: Global Energy Drinks Market Revenue billion Forecast, by Country 2020 & 2033
- Table 9: United States Energy Drinks Market Revenue (billion) Forecast, by Application 2020 & 2033
- Table 10: Canada Energy Drinks Market Revenue (billion) Forecast, by Application 2020 & 2033
- Table 11: Mexico Energy Drinks Market Revenue (billion) Forecast, by Application 2020 & 2033
- Table 12: Global Energy Drinks Market Revenue billion Forecast, by Soft Drink Type 2020 & 2033
- Table 13: Global Energy Drinks Market Revenue billion Forecast, by Packaging Type 2020 & 2033
- Table 14: Global Energy Drinks Market Revenue billion Forecast, by Distribution Channel 2020 & 2033
- Table 15: Global Energy Drinks Market Revenue billion Forecast, by Country 2020 & 2033
- Table 16: Brazil Energy Drinks Market Revenue (billion) Forecast, by Application 2020 & 2033
- Table 17: Argentina Energy Drinks Market Revenue (billion) Forecast, by Application 2020 & 2033
- Table 18: Rest of South America Energy Drinks Market Revenue (billion) Forecast, by Application 2020 & 2033
- Table 19: Global Energy Drinks Market Revenue billion Forecast, by Soft Drink Type 2020 & 2033
- Table 20: Global Energy Drinks Market Revenue billion Forecast, by Packaging Type 2020 & 2033
- Table 21: Global Energy Drinks Market Revenue billion Forecast, by Distribution Channel 2020 & 2033
- Table 22: Global Energy Drinks Market Revenue billion Forecast, by Country 2020 & 2033
- Table 23: United Kingdom Energy Drinks Market Revenue (billion) Forecast, by Application 2020 & 2033
- Table 24: Germany Energy Drinks Market Revenue (billion) Forecast, by Application 2020 & 2033
- Table 25: France Energy Drinks Market Revenue (billion) Forecast, by Application 2020 & 2033
- Table 26: Italy Energy Drinks Market Revenue (billion) Forecast, by Application 2020 & 2033
- Table 27: Spain Energy Drinks Market Revenue (billion) Forecast, by Application 2020 & 2033
- Table 28: Russia Energy Drinks Market Revenue (billion) Forecast, by Application 2020 & 2033
- Table 29: Benelux Energy Drinks Market Revenue (billion) Forecast, by Application 2020 & 2033
- Table 30: Nordics Energy Drinks Market Revenue (billion) Forecast, by Application 2020 & 2033
- Table 31: Rest of Europe Energy Drinks Market Revenue (billion) Forecast, by Application 2020 & 2033
- Table 32: Global Energy Drinks Market Revenue billion Forecast, by Soft Drink Type 2020 & 2033
- Table 33: Global Energy Drinks Market Revenue billion Forecast, by Packaging Type 2020 & 2033
- Table 34: Global Energy Drinks Market Revenue billion Forecast, by Distribution Channel 2020 & 2033
- Table 35: Global Energy Drinks Market Revenue billion Forecast, by Country 2020 & 2033
- Table 36: Turkey Energy Drinks Market Revenue (billion) Forecast, by Application 2020 & 2033
- Table 37: Israel Energy Drinks Market Revenue (billion) Forecast, by Application 2020 & 2033
- Table 38: GCC Energy Drinks Market Revenue (billion) Forecast, by Application 2020 & 2033
- Table 39: North Africa Energy Drinks Market Revenue (billion) Forecast, by Application 2020 & 2033
- Table 40: South Africa Energy Drinks Market Revenue (billion) Forecast, by Application 2020 & 2033
- Table 41: Rest of Middle East & Africa Energy Drinks Market Revenue (billion) Forecast, by Application 2020 & 2033
- Table 42: Global Energy Drinks Market Revenue billion Forecast, by Soft Drink Type 2020 & 2033
- Table 43: Global Energy Drinks Market Revenue billion Forecast, by Packaging Type 2020 & 2033
- Table 44: Global Energy Drinks Market Revenue billion Forecast, by Distribution Channel 2020 & 2033
- Table 45: Global Energy Drinks Market Revenue billion Forecast, by Country 2020 & 2033
- Table 46: China Energy Drinks Market Revenue (billion) Forecast, by Application 2020 & 2033
- Table 47: India Energy Drinks Market Revenue (billion) Forecast, by Application 2020 & 2033
- Table 48: Japan Energy Drinks Market Revenue (billion) Forecast, by Application 2020 & 2033
- Table 49: South Korea Energy Drinks Market Revenue (billion) Forecast, by Application 2020 & 2033
- Table 50: ASEAN Energy Drinks Market Revenue (billion) Forecast, by Application 2020 & 2033
- Table 51: Oceania Energy Drinks Market Revenue (billion) Forecast, by Application 2020 & 2033
- Table 52: Rest of Asia Pacific Energy Drinks Market Revenue (billion) Forecast, by Application 2020 & 2033
Frequently Asked Questions
1. What is the projected Compound Annual Growth Rate (CAGR) of the Energy Drinks Market?
The projected CAGR is approximately 9.7%.
2. Which companies are prominent players in the Energy Drinks Market?
Key companies in the market include Carabao Group Public Company Limited, Hell Energy Magyarország Korlátolt Felelosségu Társaság, Aje Group, Monster Beverage Corporation, PepsiCo Inc, The Coca-Cola Compan, Suntory Holdings Limited, Red Bull GmbH, Living Essentials LLC, T C Pharmaceutical Industries Company Limited, Taisho Pharmaceutical Holdings Co Ltd, Congo Brands, Osotspa Public Company Limited.
3. What are the main segments of the Energy Drinks Market?
The market segments include Soft Drink Type, Packaging Type, Distribution Channel.
4. Can you provide details about the market size?
The market size is estimated to be USD 23.9 billion as of 2022.
5. What are some drivers contributing to market growth?
Increasing Demand for Supplement Nutrition; Growing Casein Application in Processed Food Products.
6. What are the notable trends driving market growth?
OTHER KEY INDUSTRY TRENDS COVERED IN THE REPORT.
7. Are there any restraints impacting market growth?
Competition from Vegan/Plant-based Protein Powders.
8. Can you provide examples of recent developments in the market?
October 2023: Quality Pack International, a member of Hell Group and the Azerbijan company signed an agreement to establish a joint venture company the Quality Pack Capian LLC. QPC’s objective is to implement a vertically integrated aluminum beverage can manufacturing and non-alcoholic beverage filling factory in the Alat Free Economic Zone of Azerbaijan, which can serve as a regional production hub for local and regional beverage brands, either selling empty cans alone or also filling them.September 2023: PepsiCo India launched a limited edition flavor of its Sting Energy drink, called Sting Blue Current. Sting Blue Current is available at 200 ml in single-serve packs across India.September 2023: Red Bull unveiled its first limited Winter Edition in the United Kingdom. Red Bull Winter Edition Spiced Pear offers a blend of pear accented with a dash of cinnamon.
9. What pricing options are available for accessing the report?
Pricing options include single-user, multi-user, and enterprise licenses priced at USD 3800, USD 4500, and USD 5800 respectively.
10. Is the market size provided in terms of value or volume?
The market size is provided in terms of value, measured in billion.
11. Are there any specific market keywords associated with the report?
Yes, the market keyword associated with the report is "Energy Drinks Market," which aids in identifying and referencing the specific market segment covered.
12. How do I determine which pricing option suits my needs best?
The pricing options vary based on user requirements and access needs. Individual users may opt for single-user licenses, while businesses requiring broader access may choose multi-user or enterprise licenses for cost-effective access to the report.
13. Are there any additional resources or data provided in the Energy Drinks Market report?
While the report offers comprehensive insights, it's advisable to review the specific contents or supplementary materials provided to ascertain if additional resources or data are available.
14. How can I stay updated on further developments or reports in the Energy Drinks Market?
To stay informed about further developments, trends, and reports in the Energy Drinks Market, consider subscribing to industry newsletters, following relevant companies and organizations, or regularly checking reputable industry news sources and publications.
Methodology
Step 1 - Identification of Relevant Samples Size from Population Database


Step 2 - Approaches for Defining Global Market Size (Value, Volume* & Price*)

Note*: In applicable scenarios
Step 3 - Data Sources
Primary Research
- Web Analytics
- Survey Reports
- Research Institute
- Latest Research Reports
- Opinion Leaders
Secondary Research
- Annual Reports
- White Paper
- Latest Press Release
- Industry Association
- Paid Database
- Investor Presentations

Step 4 - Data Triangulation
Involves using different sources of information in order to increase the validity of a study
These sources are likely to be stakeholders in a program - participants, other researchers, program staff, other community members, and so on.
Then we put all data in single framework & apply various statistical tools to find out the dynamic on the market.
During the analysis stage, feedback from the stakeholder groups would be compared to determine areas of agreement as well as areas of divergence