

Key Insights
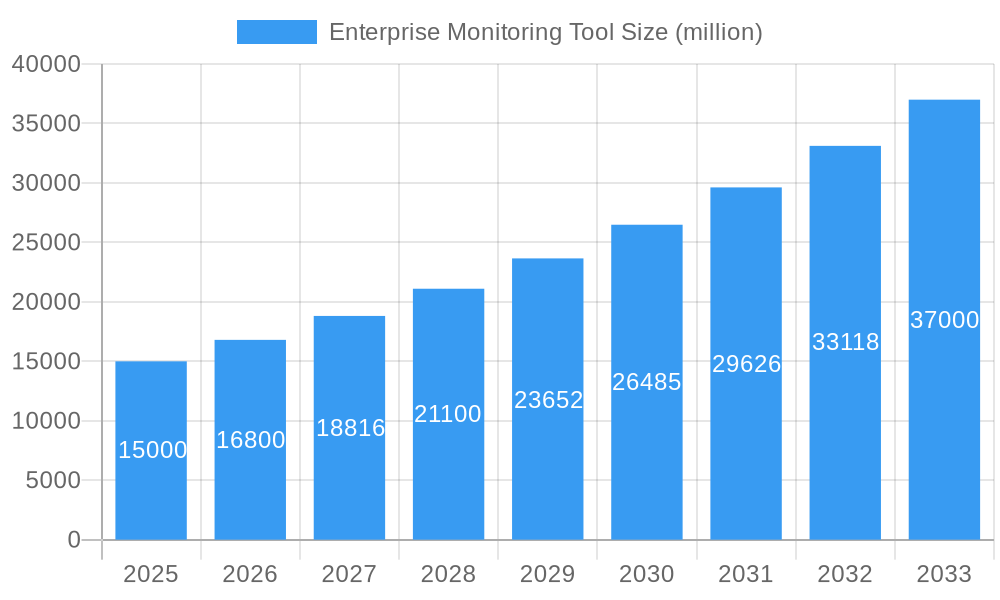
The Enterprise Monitoring Tool market is experiencing robust growth, driven by the increasing adoption of cloud-based infrastructure, the proliferation of IoT devices, and the rising demand for enhanced application performance and security. The market, estimated at $15 billion in 2025, is projected to maintain a healthy Compound Annual Growth Rate (CAGR) of 12% from 2025 to 2033, reaching an estimated $40 billion by 2033. Key drivers include the need for real-time visibility into complex IT environments, proactive identification and resolution of performance bottlenecks, and the ability to comply with stringent data security and regulatory requirements. The market is segmented by deployment type (cloud, on-premise, hybrid), organization size (small, medium, large enterprises), and industry vertical (BFSI, IT & Telecom, Healthcare, Retail, etc.). The competitive landscape is characterized by a mix of established players like Datadog, Splunk, and IBM, alongside emerging specialized vendors offering niche solutions. The trend towards AIOps (Artificial Intelligence for IT Operations) is significantly impacting the market, enabling more proactive and automated monitoring and incident management. However, challenges remain, including the complexity of implementing and managing monitoring solutions, the high cost of adoption for some enterprises, and the integration difficulties with existing IT infrastructure.
Enterprise Monitoring Tool Market Size (In Billion)
The market's growth trajectory is influenced by several key trends. Increased adoption of DevOps practices necessitates robust and agile monitoring capabilities. The growing importance of data security and compliance demands advanced threat detection and response mechanisms within the monitoring framework. The expansion of hybrid and multi-cloud environments creates a need for unified monitoring platforms that provide a single pane of glass across diverse infrastructure. Furthermore, the increasing sophistication of monitoring tools with AI and machine learning capabilities is leading to more accurate predictions and proactive interventions. Despite some restraints, the long-term outlook for the Enterprise Monitoring Tool market remains exceptionally positive, fueled by the continuous digital transformation and the need for reliable and efficient IT infrastructure.
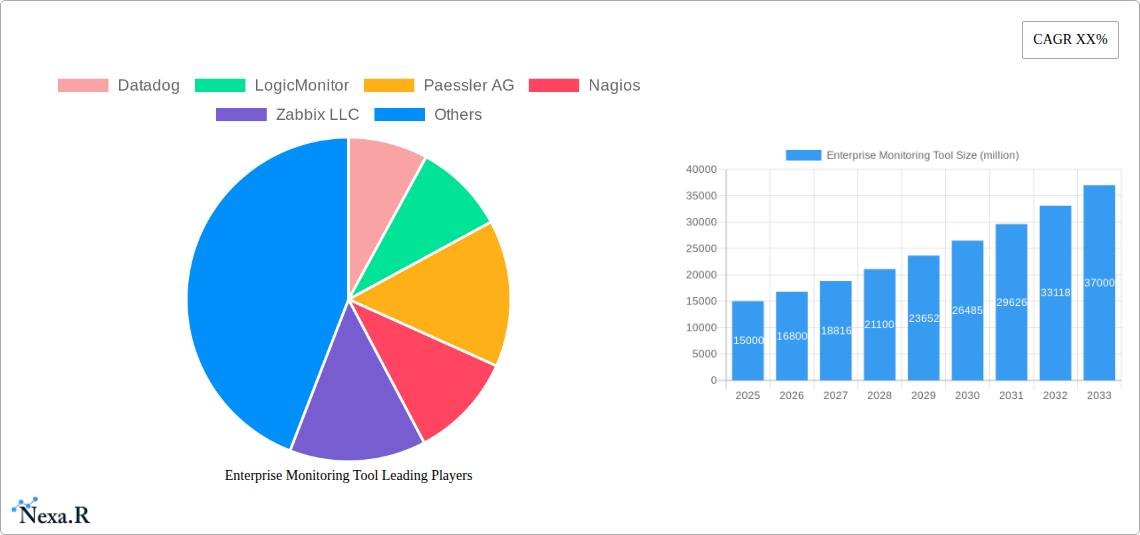
Enterprise Monitoring Tool Company Market Share
Enterprise Monitoring Tool Market Report: 2019-2033
This comprehensive report provides an in-depth analysis of the Enterprise Monitoring Tool market, encompassing market dynamics, growth trends, regional dominance, product landscape, key players, and future outlook. The study period covers 2019-2033, with 2025 as the base and estimated year. The forecast period spans 2025-2033, and the historical period covers 2019-2024. This report is crucial for businesses operating in the IT infrastructure monitoring and management (parent market) and specifically within the application performance monitoring (child market) segments.
Enterprise Monitoring Tool Market Dynamics & Structure
The Enterprise Monitoring Tool market is characterized by a moderately concentrated landscape, with key players like Datadog, Splunk, and IBM holding significant market share. However, numerous smaller players and specialized solutions contribute to a dynamic competitive environment. Technological innovation, driven by advancements in artificial intelligence (AI), machine learning (ML), and big data analytics, is a major growth driver. Stringent regulatory frameworks regarding data privacy (e.g., GDPR) influence product development and deployment strategies. The rise of cloud-based solutions and the increasing adoption of DevOps methodologies present both opportunities and challenges for existing players. M&A activity within the sector has been significant in recent years, with an estimated xx million USD in deal volume during 2022-2024, primarily focusing on consolidation and expansion into adjacent markets.
- Market Concentration: Moderately concentrated, with top 5 players holding approximately xx% market share in 2024.
- Technological Innovation: AI/ML integration, cloud-native solutions, and enhanced visualization are key innovation drivers.
- Regulatory Landscape: GDPR and other data privacy regulations significantly impact market operations.
- Competitive Substitutes: Open-source solutions and custom-built monitoring systems pose a competitive threat.
- End-User Demographics: Primarily large enterprises and government organizations, with increasing adoption by SMEs.
- M&A Trends: Consolidation and expansion into related software services are prevalent.
Enterprise Monitoring Tool Growth Trends & Insights
The global Enterprise Monitoring Tool market experienced significant growth during the historical period (2019-2024), reaching an estimated value of xx million USD in 2024. This growth is primarily attributed to the increasing adoption of cloud computing, the rise of DevOps practices, and the growing need for real-time application performance monitoring across diverse industries. The market is projected to maintain a strong Compound Annual Growth Rate (CAGR) of xx% during the forecast period (2025-2033), driven by factors such as the expanding IoT ecosystem and the increasing complexity of IT infrastructures. Technological disruptions, such as the emergence of serverless computing and edge computing, are reshaping the market landscape, creating opportunities for innovative solutions and further market expansion. Consumer behavior shifts towards increased reliance on cloud-based services and demand for improved user experience will continue driving market growth. Market penetration in key sectors such as finance and healthcare remains relatively low, indicating substantial future growth potential.
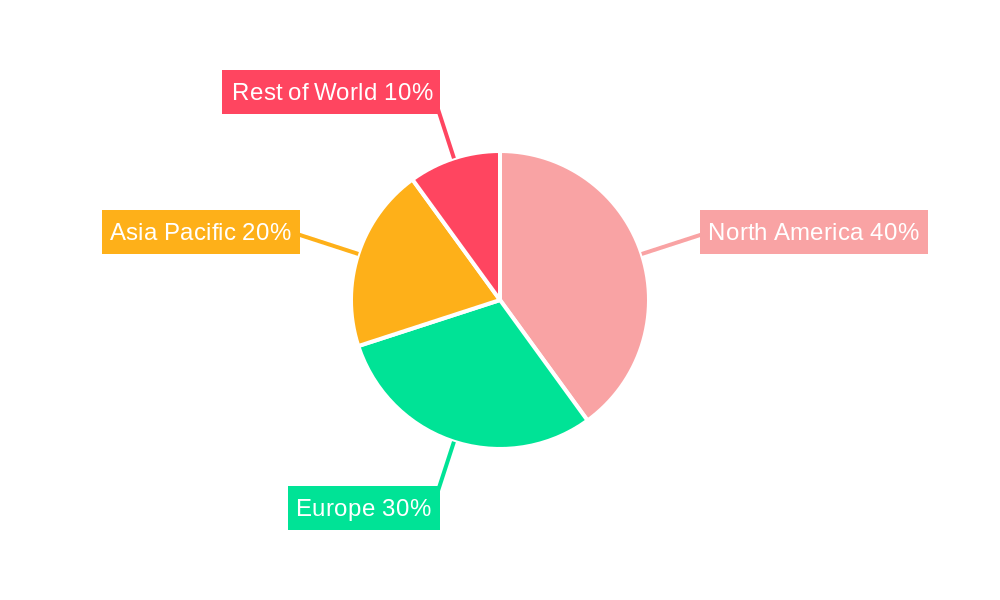
Dominant Regions, Countries, or Segments in Enterprise Monitoring Tool
North America currently dominates the Enterprise Monitoring Tool market, holding approximately xx% of the global market share in 2024. This dominance is fueled by high technology adoption rates, robust IT infrastructure, and the presence of numerous large enterprises and technology companies. However, the Asia-Pacific region is projected to witness the highest growth rate during the forecast period, driven by rapid economic development, increasing digitalization, and government initiatives promoting technology adoption. Europe is expected to show steady growth, while other regions will contribute to overall market expansion.
- North America: High technology adoption, robust IT infrastructure, and presence of major players drive market dominance.
- Asia-Pacific: Rapid economic growth, increasing digitalization, and government support fuel high growth projections.
- Europe: Steady growth driven by adoption in key sectors like finance and healthcare.
- Key Drivers: Strong IT spending, government regulations promoting digital infrastructure, and adoption of cloud services.
Enterprise Monitoring Tool Product Landscape
The Enterprise Monitoring Tool market offers a diverse range of products, including on-premises solutions, cloud-based platforms, and hybrid models. Innovation focuses on enhanced visualization, AI-powered anomaly detection, and seamless integration with DevOps workflows. Unique selling propositions often include superior performance metrics, comprehensive monitoring capabilities, and user-friendly interfaces. Technological advancements in areas like AIOps (AI for IT Operations) are revolutionizing the way enterprises monitor and manage their IT systems, leading to more efficient operations and improved decision-making.
Key Drivers, Barriers & Challenges in Enterprise Monitoring Tool
Key Drivers:
- Increasing adoption of cloud computing and DevOps practices.
- Growing demand for real-time application performance monitoring.
- Rise of the Internet of Things (IoT) and edge computing.
- Need for improved IT security and compliance.
Key Challenges & Restraints:
- High initial investment costs for enterprise-grade solutions.
- Complexity of integrating monitoring tools with existing IT infrastructure.
- Data security concerns and privacy regulations.
- Competition from open-source alternatives.
- Supply chain disruptions can impact the availability of hardware components impacting the production of some solutions. The impact of such disruptions was observed in 2022–2023 resulting in xx% increase in prices of certain monitoring tools.
Emerging Opportunities in Enterprise Monitoring Tool
- Growth in the IoT market: Monitoring and managing the growing number of connected devices presents significant opportunities.
- Expansion into new sectors: Untapped markets in sectors like manufacturing, energy, and transportation offer considerable growth potential.
- Development of AI-powered solutions: Advanced analytics and automation capabilities will drive innovation and adoption.
- Focus on improved user experience and simplified interfaces.
Growth Accelerators in the Enterprise Monitoring Tool Industry
The Enterprise Monitoring Tool market is poised for sustained growth fueled by continuous advancements in AI/ML technologies, strategic partnerships between monitoring tool providers and cloud providers, and expansion into new geographic markets. The integration of advanced security features and compliance with evolving regulatory frameworks will further enhance market adoption.
Key Players Shaping the Enterprise Monitoring Tool Market
- Datadog
- LogicMonitor
- Paessler AG
- Nagios
- Zabbix LLC
- Integral GmbH
- Micro Focus
- SignalFx, Inc
- VMware
- Splunk
- IBM
- NITOROM INC.
- Optanix
- Sematext
- Verax Systems
Notable Milestones in Enterprise Monitoring Tool Sector
- 2020: Datadog IPO signals increasing investor confidence in the sector.
- 2021: Several major players announce significant investments in AI/ML capabilities for their monitoring platforms.
- 2022: Increased focus on cloud-native monitoring solutions due to surge in cloud adoption.
- 2023: Several mergers and acquisitions consolidate market share among key players.
In-Depth Enterprise Monitoring Tool Market Outlook
The Enterprise Monitoring Tool market is poised for continued robust growth driven by technological advancements, increasing digitalization across various industries, and the growing need for efficient and secure IT infrastructure management. Opportunities abound for companies that can effectively leverage AI/ML, provide seamless cloud integration, and offer tailored solutions to meet the specific needs of diverse customer segments. The market's future potential is substantial, with continued expansion predicted across all major regions.
Enterprise Monitoring Tool Segmentation
-
1. Application
- 1.1. Large Enterprises
- 1.2. SMEs
-
2. Types
- 2.1. Cloud-Based
- 2.2. Web-Based
Enterprise Monitoring Tool Segmentation By Geography
-
1. North America
- 1.1. United States
- 1.2. Canada
- 1.3. Mexico
-
2. South America
- 2.1. Brazil
- 2.2. Argentina
- 2.3. Rest of South America
-
3. Europe
- 3.1. United Kingdom
- 3.2. Germany
- 3.3. France
- 3.4. Italy
- 3.5. Spain
- 3.6. Russia
- 3.7. Benelux
- 3.8. Nordics
- 3.9. Rest of Europe
-
4. Middle East & Africa
- 4.1. Turkey
- 4.2. Israel
- 4.3. GCC
- 4.4. North Africa
- 4.5. South Africa
- 4.6. Rest of Middle East & Africa
-
5. Asia Pacific
- 5.1. China
- 5.2. India
- 5.3. Japan
- 5.4. South Korea
- 5.5. ASEAN
- 5.6. Oceania
- 5.7. Rest of Asia Pacific
Enterprise Monitoring Tool Regional Market Share
Geographic Coverage of Enterprise Monitoring Tool
Enterprise Monitoring Tool REPORT HIGHLIGHTS
| Aspects | Details |
|---|---|
| Study Period | 2020-2034 |
| Base Year | 2025 |
| Estimated Year | 2026 |
| Forecast Period | 2026-2034 |
| Historical Period | 2020-2025 |
| Growth Rate | CAGR of XX% from 2020-2034 |
| Segmentation |
|
Table of Contents
- 1. Introduction
- 1.1. Research Scope
- 1.2. Market Segmentation
- 1.3. Research Methodology
- 1.4. Definitions and Assumptions
- 2. Executive Summary
- 2.1. Introduction
- 3. Market Dynamics
- 3.1. Introduction
- 3.2. Market Drivers
- 3.3. Market Restrains
- 3.4. Market Trends
- 4. Market Factor Analysis
- 4.1. Porters Five Forces
- 4.2. Supply/Value Chain
- 4.3. PESTEL analysis
- 4.4. Market Entropy
- 4.5. Patent/Trademark Analysis
- 5. Global Enterprise Monitoring Tool Analysis, Insights and Forecast, 2020-2032
- 5.1. Market Analysis, Insights and Forecast - by Application
- 5.1.1. Large Enterprises
- 5.1.2. SMEs
- 5.2. Market Analysis, Insights and Forecast - by Types
- 5.2.1. Cloud-Based
- 5.2.2. Web-Based
- 5.3. Market Analysis, Insights and Forecast - by Region
- 5.3.1. North America
- 5.3.2. South America
- 5.3.3. Europe
- 5.3.4. Middle East & Africa
- 5.3.5. Asia Pacific
- 5.1. Market Analysis, Insights and Forecast - by Application
- 6. North America Enterprise Monitoring Tool Analysis, Insights and Forecast, 2020-2032
- 6.1. Market Analysis, Insights and Forecast - by Application
- 6.1.1. Large Enterprises
- 6.1.2. SMEs
- 6.2. Market Analysis, Insights and Forecast - by Types
- 6.2.1. Cloud-Based
- 6.2.2. Web-Based
- 6.1. Market Analysis, Insights and Forecast - by Application
- 7. South America Enterprise Monitoring Tool Analysis, Insights and Forecast, 2020-2032
- 7.1. Market Analysis, Insights and Forecast - by Application
- 7.1.1. Large Enterprises
- 7.1.2. SMEs
- 7.2. Market Analysis, Insights and Forecast - by Types
- 7.2.1. Cloud-Based
- 7.2.2. Web-Based
- 7.1. Market Analysis, Insights and Forecast - by Application
- 8. Europe Enterprise Monitoring Tool Analysis, Insights and Forecast, 2020-2032
- 8.1. Market Analysis, Insights and Forecast - by Application
- 8.1.1. Large Enterprises
- 8.1.2. SMEs
- 8.2. Market Analysis, Insights and Forecast - by Types
- 8.2.1. Cloud-Based
- 8.2.2. Web-Based
- 8.1. Market Analysis, Insights and Forecast - by Application
- 9. Middle East & Africa Enterprise Monitoring Tool Analysis, Insights and Forecast, 2020-2032
- 9.1. Market Analysis, Insights and Forecast - by Application
- 9.1.1. Large Enterprises
- 9.1.2. SMEs
- 9.2. Market Analysis, Insights and Forecast - by Types
- 9.2.1. Cloud-Based
- 9.2.2. Web-Based
- 9.1. Market Analysis, Insights and Forecast - by Application
- 10. Asia Pacific Enterprise Monitoring Tool Analysis, Insights and Forecast, 2020-2032
- 10.1. Market Analysis, Insights and Forecast - by Application
- 10.1.1. Large Enterprises
- 10.1.2. SMEs
- 10.2. Market Analysis, Insights and Forecast - by Types
- 10.2.1. Cloud-Based
- 10.2.2. Web-Based
- 10.1. Market Analysis, Insights and Forecast - by Application
- 11. Competitive Analysis
- 11.1. Global Market Share Analysis 2025
- 11.2. Company Profiles
- 11.2.1 Datadog
- 11.2.1.1. Overview
- 11.2.1.2. Products
- 11.2.1.3. SWOT Analysis
- 11.2.1.4. Recent Developments
- 11.2.1.5. Financials (Based on Availability)
- 11.2.2 LogicMonitor
- 11.2.2.1. Overview
- 11.2.2.2. Products
- 11.2.2.3. SWOT Analysis
- 11.2.2.4. Recent Developments
- 11.2.2.5. Financials (Based on Availability)
- 11.2.3 Paessler AG
- 11.2.3.1. Overview
- 11.2.3.2. Products
- 11.2.3.3. SWOT Analysis
- 11.2.3.4. Recent Developments
- 11.2.3.5. Financials (Based on Availability)
- 11.2.4 Nagios
- 11.2.4.1. Overview
- 11.2.4.2. Products
- 11.2.4.3. SWOT Analysis
- 11.2.4.4. Recent Developments
- 11.2.4.5. Financials (Based on Availability)
- 11.2.5 Zabbix LLC
- 11.2.5.1. Overview
- 11.2.5.2. Products
- 11.2.5.3. SWOT Analysis
- 11.2.5.4. Recent Developments
- 11.2.5.5. Financials (Based on Availability)
- 11.2.6 Intergral GmbH
- 11.2.6.1. Overview
- 11.2.6.2. Products
- 11.2.6.3. SWOT Analysis
- 11.2.6.4. Recent Developments
- 11.2.6.5. Financials (Based on Availability)
- 11.2.7 Micro Focus
- 11.2.7.1. Overview
- 11.2.7.2. Products
- 11.2.7.3. SWOT Analysis
- 11.2.7.4. Recent Developments
- 11.2.7.5. Financials (Based on Availability)
- 11.2.8 SignalFx
- 11.2.8.1. Overview
- 11.2.8.2. Products
- 11.2.8.3. SWOT Analysis
- 11.2.8.4. Recent Developments
- 11.2.8.5. Financials (Based on Availability)
- 11.2.9 Inc
- 11.2.9.1. Overview
- 11.2.9.2. Products
- 11.2.9.3. SWOT Analysis
- 11.2.9.4. Recent Developments
- 11.2.9.5. Financials (Based on Availability)
- 11.2.10 VMware
- 11.2.10.1. Overview
- 11.2.10.2. Products
- 11.2.10.3. SWOT Analysis
- 11.2.10.4. Recent Developments
- 11.2.10.5. Financials (Based on Availability)
- 11.2.11 Splunk
- 11.2.11.1. Overview
- 11.2.11.2. Products
- 11.2.11.3. SWOT Analysis
- 11.2.11.4. Recent Developments
- 11.2.11.5. Financials (Based on Availability)
- 11.2.12 IBM
- 11.2.12.1. Overview
- 11.2.12.2. Products
- 11.2.12.3. SWOT Analysis
- 11.2.12.4. Recent Developments
- 11.2.12.5. Financials (Based on Availability)
- 11.2.13 NITOROM INC.
- 11.2.13.1. Overview
- 11.2.13.2. Products
- 11.2.13.3. SWOT Analysis
- 11.2.13.4. Recent Developments
- 11.2.13.5. Financials (Based on Availability)
- 11.2.14 Optanix
- 11.2.14.1. Overview
- 11.2.14.2. Products
- 11.2.14.3. SWOT Analysis
- 11.2.14.4. Recent Developments
- 11.2.14.5. Financials (Based on Availability)
- 11.2.15 Sematext
- 11.2.15.1. Overview
- 11.2.15.2. Products
- 11.2.15.3. SWOT Analysis
- 11.2.15.4. Recent Developments
- 11.2.15.5. Financials (Based on Availability)
- 11.2.16 Verax Systems
- 11.2.16.1. Overview
- 11.2.16.2. Products
- 11.2.16.3. SWOT Analysis
- 11.2.16.4. Recent Developments
- 11.2.16.5. Financials (Based on Availability)
- 11.2.1 Datadog
List of Figures
- Figure 1: Global Enterprise Monitoring Tool Revenue Breakdown (million, %) by Region 2025 & 2033
- Figure 2: North America Enterprise Monitoring Tool Revenue (million), by Application 2025 & 2033
- Figure 3: North America Enterprise Monitoring Tool Revenue Share (%), by Application 2025 & 2033
- Figure 4: North America Enterprise Monitoring Tool Revenue (million), by Types 2025 & 2033
- Figure 5: North America Enterprise Monitoring Tool Revenue Share (%), by Types 2025 & 2033
- Figure 6: North America Enterprise Monitoring Tool Revenue (million), by Country 2025 & 2033
- Figure 7: North America Enterprise Monitoring Tool Revenue Share (%), by Country 2025 & 2033
- Figure 8: South America Enterprise Monitoring Tool Revenue (million), by Application 2025 & 2033
- Figure 9: South America Enterprise Monitoring Tool Revenue Share (%), by Application 2025 & 2033
- Figure 10: South America Enterprise Monitoring Tool Revenue (million), by Types 2025 & 2033
- Figure 11: South America Enterprise Monitoring Tool Revenue Share (%), by Types 2025 & 2033
- Figure 12: South America Enterprise Monitoring Tool Revenue (million), by Country 2025 & 2033
- Figure 13: South America Enterprise Monitoring Tool Revenue Share (%), by Country 2025 & 2033
- Figure 14: Europe Enterprise Monitoring Tool Revenue (million), by Application 2025 & 2033
- Figure 15: Europe Enterprise Monitoring Tool Revenue Share (%), by Application 2025 & 2033
- Figure 16: Europe Enterprise Monitoring Tool Revenue (million), by Types 2025 & 2033
- Figure 17: Europe Enterprise Monitoring Tool Revenue Share (%), by Types 2025 & 2033
- Figure 18: Europe Enterprise Monitoring Tool Revenue (million), by Country 2025 & 2033
- Figure 19: Europe Enterprise Monitoring Tool Revenue Share (%), by Country 2025 & 2033
- Figure 20: Middle East & Africa Enterprise Monitoring Tool Revenue (million), by Application 2025 & 2033
- Figure 21: Middle East & Africa Enterprise Monitoring Tool Revenue Share (%), by Application 2025 & 2033
- Figure 22: Middle East & Africa Enterprise Monitoring Tool Revenue (million), by Types 2025 & 2033
- Figure 23: Middle East & Africa Enterprise Monitoring Tool Revenue Share (%), by Types 2025 & 2033
- Figure 24: Middle East & Africa Enterprise Monitoring Tool Revenue (million), by Country 2025 & 2033
- Figure 25: Middle East & Africa Enterprise Monitoring Tool Revenue Share (%), by Country 2025 & 2033
- Figure 26: Asia Pacific Enterprise Monitoring Tool Revenue (million), by Application 2025 & 2033
- Figure 27: Asia Pacific Enterprise Monitoring Tool Revenue Share (%), by Application 2025 & 2033
- Figure 28: Asia Pacific Enterprise Monitoring Tool Revenue (million), by Types 2025 & 2033
- Figure 29: Asia Pacific Enterprise Monitoring Tool Revenue Share (%), by Types 2025 & 2033
- Figure 30: Asia Pacific Enterprise Monitoring Tool Revenue (million), by Country 2025 & 2033
- Figure 31: Asia Pacific Enterprise Monitoring Tool Revenue Share (%), by Country 2025 & 2033
List of Tables
- Table 1: Global Enterprise Monitoring Tool Revenue million Forecast, by Application 2020 & 2033
- Table 2: Global Enterprise Monitoring Tool Revenue million Forecast, by Types 2020 & 2033
- Table 3: Global Enterprise Monitoring Tool Revenue million Forecast, by Region 2020 & 2033
- Table 4: Global Enterprise Monitoring Tool Revenue million Forecast, by Application 2020 & 2033
- Table 5: Global Enterprise Monitoring Tool Revenue million Forecast, by Types 2020 & 2033
- Table 6: Global Enterprise Monitoring Tool Revenue million Forecast, by Country 2020 & 2033
- Table 7: United States Enterprise Monitoring Tool Revenue (million) Forecast, by Application 2020 & 2033
- Table 8: Canada Enterprise Monitoring Tool Revenue (million) Forecast, by Application 2020 & 2033
- Table 9: Mexico Enterprise Monitoring Tool Revenue (million) Forecast, by Application 2020 & 2033
- Table 10: Global Enterprise Monitoring Tool Revenue million Forecast, by Application 2020 & 2033
- Table 11: Global Enterprise Monitoring Tool Revenue million Forecast, by Types 2020 & 2033
- Table 12: Global Enterprise Monitoring Tool Revenue million Forecast, by Country 2020 & 2033
- Table 13: Brazil Enterprise Monitoring Tool Revenue (million) Forecast, by Application 2020 & 2033
- Table 14: Argentina Enterprise Monitoring Tool Revenue (million) Forecast, by Application 2020 & 2033
- Table 15: Rest of South America Enterprise Monitoring Tool Revenue (million) Forecast, by Application 2020 & 2033
- Table 16: Global Enterprise Monitoring Tool Revenue million Forecast, by Application 2020 & 2033
- Table 17: Global Enterprise Monitoring Tool Revenue million Forecast, by Types 2020 & 2033
- Table 18: Global Enterprise Monitoring Tool Revenue million Forecast, by Country 2020 & 2033
- Table 19: United Kingdom Enterprise Monitoring Tool Revenue (million) Forecast, by Application 2020 & 2033
- Table 20: Germany Enterprise Monitoring Tool Revenue (million) Forecast, by Application 2020 & 2033
- Table 21: France Enterprise Monitoring Tool Revenue (million) Forecast, by Application 2020 & 2033
- Table 22: Italy Enterprise Monitoring Tool Revenue (million) Forecast, by Application 2020 & 2033
- Table 23: Spain Enterprise Monitoring Tool Revenue (million) Forecast, by Application 2020 & 2033
- Table 24: Russia Enterprise Monitoring Tool Revenue (million) Forecast, by Application 2020 & 2033
- Table 25: Benelux Enterprise Monitoring Tool Revenue (million) Forecast, by Application 2020 & 2033
- Table 26: Nordics Enterprise Monitoring Tool Revenue (million) Forecast, by Application 2020 & 2033
- Table 27: Rest of Europe Enterprise Monitoring Tool Revenue (million) Forecast, by Application 2020 & 2033
- Table 28: Global Enterprise Monitoring Tool Revenue million Forecast, by Application 2020 & 2033
- Table 29: Global Enterprise Monitoring Tool Revenue million Forecast, by Types 2020 & 2033
- Table 30: Global Enterprise Monitoring Tool Revenue million Forecast, by Country 2020 & 2033
- Table 31: Turkey Enterprise Monitoring Tool Revenue (million) Forecast, by Application 2020 & 2033
- Table 32: Israel Enterprise Monitoring Tool Revenue (million) Forecast, by Application 2020 & 2033
- Table 33: GCC Enterprise Monitoring Tool Revenue (million) Forecast, by Application 2020 & 2033
- Table 34: North Africa Enterprise Monitoring Tool Revenue (million) Forecast, by Application 2020 & 2033
- Table 35: South Africa Enterprise Monitoring Tool Revenue (million) Forecast, by Application 2020 & 2033
- Table 36: Rest of Middle East & Africa Enterprise Monitoring Tool Revenue (million) Forecast, by Application 2020 & 2033
- Table 37: Global Enterprise Monitoring Tool Revenue million Forecast, by Application 2020 & 2033
- Table 38: Global Enterprise Monitoring Tool Revenue million Forecast, by Types 2020 & 2033
- Table 39: Global Enterprise Monitoring Tool Revenue million Forecast, by Country 2020 & 2033
- Table 40: China Enterprise Monitoring Tool Revenue (million) Forecast, by Application 2020 & 2033
- Table 41: India Enterprise Monitoring Tool Revenue (million) Forecast, by Application 2020 & 2033
- Table 42: Japan Enterprise Monitoring Tool Revenue (million) Forecast, by Application 2020 & 2033
- Table 43: South Korea Enterprise Monitoring Tool Revenue (million) Forecast, by Application 2020 & 2033
- Table 44: ASEAN Enterprise Monitoring Tool Revenue (million) Forecast, by Application 2020 & 2033
- Table 45: Oceania Enterprise Monitoring Tool Revenue (million) Forecast, by Application 2020 & 2033
- Table 46: Rest of Asia Pacific Enterprise Monitoring Tool Revenue (million) Forecast, by Application 2020 & 2033
Frequently Asked Questions
1. What is the projected Compound Annual Growth Rate (CAGR) of the Enterprise Monitoring Tool?
The projected CAGR is approximately XX%.
2. Which companies are prominent players in the Enterprise Monitoring Tool?
Key companies in the market include Datadog, LogicMonitor, Paessler AG, Nagios, Zabbix LLC, Intergral GmbH, Micro Focus, SignalFx, Inc, VMware, Splunk, IBM, NITOROM INC., Optanix, Sematext, Verax Systems.
3. What are the main segments of the Enterprise Monitoring Tool?
The market segments include Application, Types.
4. Can you provide details about the market size?
The market size is estimated to be USD XXX million as of 2022.
5. What are some drivers contributing to market growth?
N/A
6. What are the notable trends driving market growth?
N/A
7. Are there any restraints impacting market growth?
N/A
8. Can you provide examples of recent developments in the market?
N/A
9. What pricing options are available for accessing the report?
Pricing options include single-user, multi-user, and enterprise licenses priced at USD 3350.00, USD 5025.00, and USD 6700.00 respectively.
10. Is the market size provided in terms of value or volume?
The market size is provided in terms of value, measured in million.
11. Are there any specific market keywords associated with the report?
Yes, the market keyword associated with the report is "Enterprise Monitoring Tool," which aids in identifying and referencing the specific market segment covered.
12. How do I determine which pricing option suits my needs best?
The pricing options vary based on user requirements and access needs. Individual users may opt for single-user licenses, while businesses requiring broader access may choose multi-user or enterprise licenses for cost-effective access to the report.
13. Are there any additional resources or data provided in the Enterprise Monitoring Tool report?
While the report offers comprehensive insights, it's advisable to review the specific contents or supplementary materials provided to ascertain if additional resources or data are available.
14. How can I stay updated on further developments or reports in the Enterprise Monitoring Tool?
To stay informed about further developments, trends, and reports in the Enterprise Monitoring Tool, consider subscribing to industry newsletters, following relevant companies and organizations, or regularly checking reputable industry news sources and publications.
Methodology
Step 1 - Identification of Relevant Samples Size from Population Database


Step 2 - Approaches for Defining Global Market Size (Value, Volume* & Price*)

Note*: In applicable scenarios
Step 3 - Data Sources
Primary Research
- Web Analytics
- Survey Reports
- Research Institute
- Latest Research Reports
- Opinion Leaders
Secondary Research
- Annual Reports
- White Paper
- Latest Press Release
- Industry Association
- Paid Database
- Investor Presentations

Step 4 - Data Triangulation
Involves using different sources of information in order to increase the validity of a study
These sources are likely to be stakeholders in a program - participants, other researchers, program staff, other community members, and so on.
Then we put all data in single framework & apply various statistical tools to find out the dynamic on the market.
During the analysis stage, feedback from the stakeholder groups would be compared to determine areas of agreement as well as areas of divergence