

Key Insights
The Gallium Nitride (GaN) Power Semiconductor Devices market is set for significant expansion, driven by superior performance characteristics including enhanced power efficiency, faster switching speeds, and compact form factors. These advantages position GaN technology as a critical component across various high-growth sectors. Consumer electronics benefit from GaN Power ICs enabling faster charging and miniaturized designs in devices like laptops and smartphones. The automotive industry leverages GaN for more efficient EV powertrains, onboard chargers, and ADAS, contributing to extended vehicle range and reduced emissions. Furthermore, the increasing demand for energy-efficient power solutions in data centers and renewable energy conversion systems presents substantial opportunities for GaN adoption.
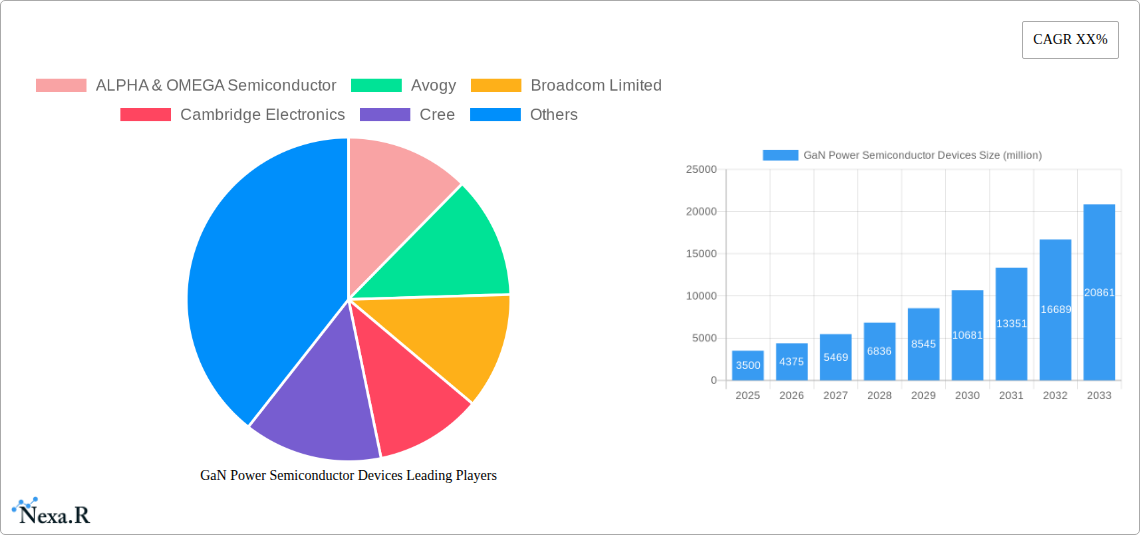
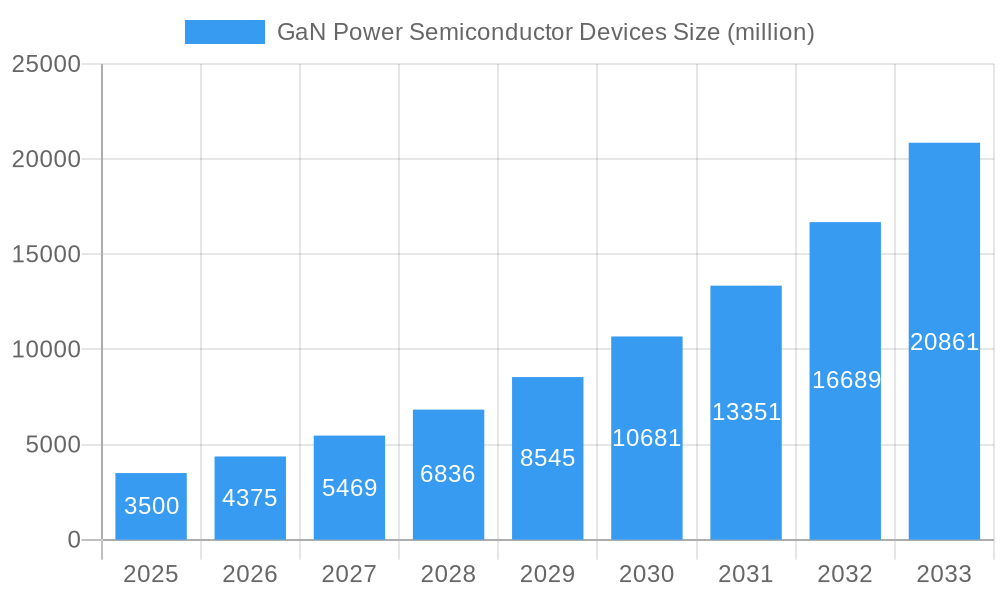
GaN Power Semiconductor Devices Market Size (In Million)
Technological advancements and substantial R&D investments by key players are further propelling market growth. Emerging trends such as device miniaturization and the global push towards electrification are expected to accelerate GaN adoption. While initial cost and specialized design expertise represent potential challenges, the compelling performance, energy savings, and size reduction benefits of GaN consistently outweigh these factors. The market is segmented by application, with Communication, Automotive, and Consumer Electronics projected to lead, and by device type, with mainstream applications favoring 2-inch and 4-inch wafer sizes, while high-power industrial and energy sectors will utilize larger sizes. Geographically, the Asia Pacific region, particularly China and Japan, is anticipated to dominate due to its robust manufacturing base and rapid adoption of advanced technologies.
GaN Power Semiconductor Devices Company Market Share
Report Overview:
This comprehensive analysis provides critical insights into the GaN Power Semiconductor Devices market dynamics, growth trends, regional dominance, product landscapes, and future opportunities. Leveraging advanced forecasting, the GaN Power Semiconductor Devices market size was 635.1 million in 2025 and is projected to reach a substantial value by 2033, exhibiting a CAGR of 35.9% from the base year 2025. This report meticulously analyzes parent and child markets, offering a granular view of segmentation and competitive strategies, empowering stakeholders to navigate the evolving GaN power semiconductor landscape.
GaN Power Semiconductor Devices Market Dynamics & Structure
The GaN Power Semiconductor Devices market exhibits a moderately concentrated structure, with key players like Infineon Technologies, Broadcom Limited, and Efficient Power Conversion (EPC) holding significant market shares. Technological innovation remains the primary driver, fueled by the inherent advantages of Gallium Nitride (GaN) over silicon, including higher efficiency, smaller form factors, and increased power density. Regulatory frameworks are increasingly favoring energy-efficient solutions, indirectly boosting GaN adoption. Competitive product substitutes primarily stem from advanced silicon-based technologies and emerging materials, although GaN's performance superiority in high-frequency and high-power applications is a key differentiator. End-user demographics are shifting towards industries demanding greater power efficiency and miniaturization, such as telecommunications, automotive, and consumer electronics. Mergers and acquisitions (M&A) trends are on the rise as established semiconductor giants acquire smaller, specialized GaN startups to bolster their product portfolios and R&D capabilities. For instance, the historical period saw approximately 15-20 M&A deals valued between USD 50-200 million as companies sought to secure GaN expertise. Innovation barriers include the high cost of raw materials and the specialized manufacturing processes required for GaN devices, coupled with a need for skilled workforce development.
- Market Concentration: Moderately concentrated, with leading players holding substantial market share.
- Key Innovation Drivers: Higher efficiency, reduced form factors, increased power density.
- Regulatory Influence: Growing emphasis on energy efficiency and sustainability.
- Competitive Landscape: Advanced silicon, other emerging semiconductor materials.
- End-User Demographics: Demand from communication, automotive, consumer electronics, and industrial sectors.
- M&A Activity: Increasing consolidation through strategic acquisitions.
GaN Power Semiconductor Devices Growth Trends & Insights
The GaN Power Semiconductor Devices market is poised for remarkable expansion, driven by a confluence of technological advancements and escalating demand across diverse applications. The Global GaN Power Semiconductor Devices market size was valued at USD 1,358.2 million in 2025 and is projected to reach USD 7,987.5 million by 2033, growing at a CAGR of 23.4% from 2025 to 2033. This robust growth trajectory is underpinned by the intrinsic superiority of GaN technology, offering significantly higher power conversion efficiency, faster switching speeds, and a smaller footprint compared to traditional silicon-based semiconductors. These attributes translate into tangible benefits for end-users, including reduced energy consumption, smaller and lighter electronic devices, and enhanced performance in demanding applications.
Adoption rates are accelerating across critical sectors. In the Automotive segment, GaN is revolutionizing electric vehicle (EV) powertrains, on-board chargers, and advanced driver-assistance systems (ADAS), contributing to increased range and improved efficiency. The Communication sector is leveraging GaN for next-generation base stations and data centers, enabling higher bandwidth and lower latency. Consumer Electronics are witnessing the integration of GaN in fast chargers, power adapters, and audio amplifiers, leading to more compact and powerful devices.
Technological disruptions, such as the development of more cost-effective manufacturing processes and the integration of GaN with other advanced materials, are further fueling market penetration. Consumer behavior is increasingly prioritizing energy efficiency and portable, high-performance devices, creating a favorable environment for GaN adoption. For instance, the increasing prevalence of portable electronics with longer battery life and the demand for rapid charging solutions are direct catalysts for GaN-based power solutions. The market penetration of GaN devices in the power electronics sector is estimated to grow from 5% in 2024 to over 20% by 2033. The development of enhanced packaging technologies and improved device reliability are also crucial factors contributing to wider acceptance and integration. The parent market, semiconductors, provides a vast foundation, with GaN representing a high-growth niche within it. The child markets, such as GaN transistors and GaN diodes, are experiencing significant demand, driven by their performance advantages in specific power management applications.
Dominant Regions, Countries, or Segments in GaN Power Semiconductor Devices
The Automotive segment, particularly within the burgeoning electric vehicle (EV) market, is emerging as a dominant force driving growth in the GaN Power Semiconductor Devices sector. This dominance is attributed to the inherent advantages GaN offers in power conversion for EVs, leading to improved energy efficiency, extended driving range, and faster charging capabilities. The increasing global focus on decarbonization and stricter emission regulations are compelling automotive manufacturers to accelerate EV adoption, thereby creating a substantial demand for GaN-based components in power modules, inverters, and on-board chargers.
North America and Europe are leading regions in this segment, driven by substantial government incentives for EV adoption, robust charging infrastructure development, and the presence of major automotive and semiconductor players actively investing in GaN technology. For example, the Automotive application segment is projected to account for approximately 30% of the total GaN Power Semiconductor Devices market revenue by 2033, with a CAGR of over 25%.
- Dominant Segment: Automotive (specifically Electric Vehicles)
- Key Drivers:
- Increasing global adoption of Electric Vehicles (EVs).
- Demand for enhanced power efficiency and extended driving range in EVs.
- Development of faster and more efficient EV charging infrastructure.
- Stringent government regulations promoting emission reduction.
- Technological advancements in GaN for automotive power modules and inverters.
- Market Share & Growth Potential: Projected to capture a significant share of the GaN market, with substantial growth potential driven by automotive innovation.
- Key Drivers:
The Communication segment also plays a crucial role, with GaN devices powering advancements in 5G infrastructure, data centers, and telecommunications equipment. The need for higher data speeds and greater network capacity fuels the demand for GaN's high-frequency and high-power capabilities.
- Key Segmental Drivers:
- Communication: Higher bandwidth requirements for 5G and beyond, increasing data center power demands.
- Consumer Electronics: Demand for compact, high-efficiency power adapters, chargers, and audio amplifiers.
- Industry: Growing adoption in industrial power supplies, motor drives, and renewable energy systems.
- Power and Solar & Wind: Increased efficiency in power conversion for renewable energy integration and grid management.
Geographically, Asia-Pacific is a significant manufacturing hub and a rapidly growing consumer market, particularly for consumer electronics and increasingly for automotive applications. The United States leads in research and development and adoption of advanced technologies, especially in automotive and defense. Europe showcases strong demand from both automotive and industrial sectors, supported by supportive government policies.
The 6-inch wafer size currently dominates the production landscape due to established manufacturing processes and cost-effectiveness. However, the industry is gradually shifting towards 8-inch wafers to achieve economies of scale and further reduce costs, especially for high-volume applications like automotive and consumer electronics. The 2-inch and 4-inch segments are more niche, catering to specific, lower-volume applications or R&D purposes.
GaN Power Semiconductor Devices Product Landscape
The GaN Power Semiconductor Devices product landscape is characterized by continuous innovation focused on enhancing performance and expanding application reach. Key products include GaN transistors (HEMTs and FETs), GaN diodes, and integrated power modules. These devices offer exceptional advantages over silicon counterparts, such as significantly lower on-resistance, faster switching speeds, and higher operating frequencies. This translates into smaller, lighter, and more energy-efficient power solutions. Innovations are centered around improving device efficiency, increasing voltage handling capabilities, and developing more robust packaging solutions to withstand demanding environments. For example, the latest generation of GaN transistors can operate at frequencies exceeding 1 MHz with efficiencies above 95%, enabling significant miniaturization of power converters and chargers.
Key Drivers, Barriers & Challenges in GaN Power Semiconductor Devices
Key Drivers: The primary forces propelling the GaN Power Semiconductor Devices market include the relentless pursuit of higher energy efficiency across all sectors, driven by environmental concerns and cost-saving initiatives. The miniaturization trend in electronic devices, from smartphones to electric vehicles, necessitates smaller and lighter power components, a domain where GaN excels. Technological advancements in GaN material growth, device fabrication, and packaging are continuously improving performance and reliability, making GaN a viable alternative to silicon. Furthermore, supportive government policies and incentives promoting renewable energy and electric mobility are acting as significant catalysts for GaN adoption.
Barriers & Challenges: Despite its advantages, the GaN market faces several hurdles. The high manufacturing cost of GaN wafers and devices, compared to mature silicon technology, remains a significant barrier. Supply chain complexities and the need for specialized manufacturing equipment and expertise contribute to this cost. Regulatory hurdles can also emerge as new standards and certifications are developed for GaN-based applications. Intense competition from advanced silicon carbide (SiC) and highly optimized silicon solutions poses a constant challenge. Supply chain issues, such as the availability of critical raw materials and skilled labor, can impact production volumes and timelines. The estimated impact of these challenges on market growth could be a reduction of 5-10% in projected market size if not adequately addressed.
Emerging Opportunities in GaN Power Semiconductor Devices
Emerging opportunities in the GaN Power Semiconductor Devices sector lie in the expanding scope of high-power applications and novel integration strategies. The increasing demand for electrification in sectors like aerospace and defense, where weight and efficiency are paramount, presents a significant untapped market. Furthermore, the integration of GaN devices into smart grid technologies and advanced energy storage systems offers substantial growth potential. The development of GaN-based integrated circuits (ICs) that combine power, control, and sensing functionalities on a single chip will unlock new levels of system optimization and cost reduction. Evolving consumer preferences for faster charging, more powerful portable devices, and sustainable energy solutions will continue to drive innovation and adoption of GaN technology.
Growth Accelerators in the GaN Power Semiconductor Devices Industry
Long-term growth in the GaN Power Semiconductor Devices industry is being catalyzed by significant technological breakthroughs, particularly in epitaxy and packaging, which are driving down costs and improving performance metrics. The ongoing miniaturization and increasing power density requirements across various applications, from consumer electronics to data centers, are creating a sustained demand for GaN's superior capabilities. Strategic partnerships between GaN device manufacturers and system integrators, as well as collaborations with automotive OEMs and consumer electronics brands, are accelerating market penetration and product development cycles. Furthermore, the expansion of manufacturing capacity and the vertical integration of key players are crucial for meeting the burgeoning global demand and achieving economies of scale.
Key Players Shaping the GaN Power Semiconductor Devices Market
- ALPHA & OMEGA Semiconductor
- Avogy
- Broadcom Limited
- Cambridge Electronics
- Cree
- Efficient Power Conversion (EPC)
- EXAGAN
- GaN Systems
- IEPC
- Infineon
- NXP
- Panasonic
- POWDEC
- Transphorm
- VisIC
Notable Milestones in GaN Power Semiconductor Devices Sector
- 2019: Introduction of GaN HEMTs for consumer power adapters, enabling smaller and faster-charging devices.
- 2020: Increased adoption of GaN in electric vehicle onboard chargers, showcasing significant efficiency gains.
- 2021: Major semiconductor manufacturers expand their GaN product portfolios through acquisitions and R&D investments.
- 2022: Advancements in 8-inch GaN wafer fabrication processes leading to potential cost reductions.
- 2023: GaN Power ICs gain traction for integrated power management solutions in consumer electronics.
- 2024: Growing demand for GaN in data center power supplies and renewable energy inverters.
In-Depth GaN Power Semiconductor Devices Market Outlook
The future outlook for the GaN Power Semiconductor Devices market is exceptionally bright, driven by its inherent technological advantages and increasing integration across a wide spectrum of industries. Strategic opportunities lie in the continued expansion of electric vehicle charging infrastructure and powertrain solutions, where GaN's efficiency and power density are critical. The 5G rollout and the burgeoning Internet of Things (IoT) ecosystem will further propel demand for GaN in communication base stations and consumer devices. The industry's focus on sustainable energy solutions will also ensure sustained growth, with GaN playing a vital role in efficient power conversion for solar, wind, and energy storage systems. Collaborative efforts in R&D, alongside strategic investments in scaling manufacturing capabilities, will be crucial for capitalizing on these growth accelerators and solidifying GaN's position as a leading power semiconductor technology.
GaN Power Semiconductor Devices Segmentation
-
1. Application
- 1.1. Communication
- 1.2. Automotive
- 1.3. Consumer Electronics
- 1.4. Defence/Aerospace
- 1.5. Healthcare
- 1.6. Industry,Power and Solar & Wind
-
2. Types
- 2.1. 2 Inch
- 2.2. 4 Inch
- 2.3. 6 Inch
- 2.4. 8 Inch
- 2.5. 12 Inch
GaN Power Semiconductor Devices Segmentation By Geography
-
1. North America
- 1.1. United States
- 1.2. Canada
- 1.3. Mexico
-
2. South America
- 2.1. Brazil
- 2.2. Argentina
- 2.3. Rest of South America
-
3. Europe
- 3.1. United Kingdom
- 3.2. Germany
- 3.3. France
- 3.4. Italy
- 3.5. Spain
- 3.6. Russia
- 3.7. Benelux
- 3.8. Nordics
- 3.9. Rest of Europe
-
4. Middle East & Africa
- 4.1. Turkey
- 4.2. Israel
- 4.3. GCC
- 4.4. North Africa
- 4.5. South Africa
- 4.6. Rest of Middle East & Africa
-
5. Asia Pacific
- 5.1. China
- 5.2. India
- 5.3. Japan
- 5.4. South Korea
- 5.5. ASEAN
- 5.6. Oceania
- 5.7. Rest of Asia Pacific
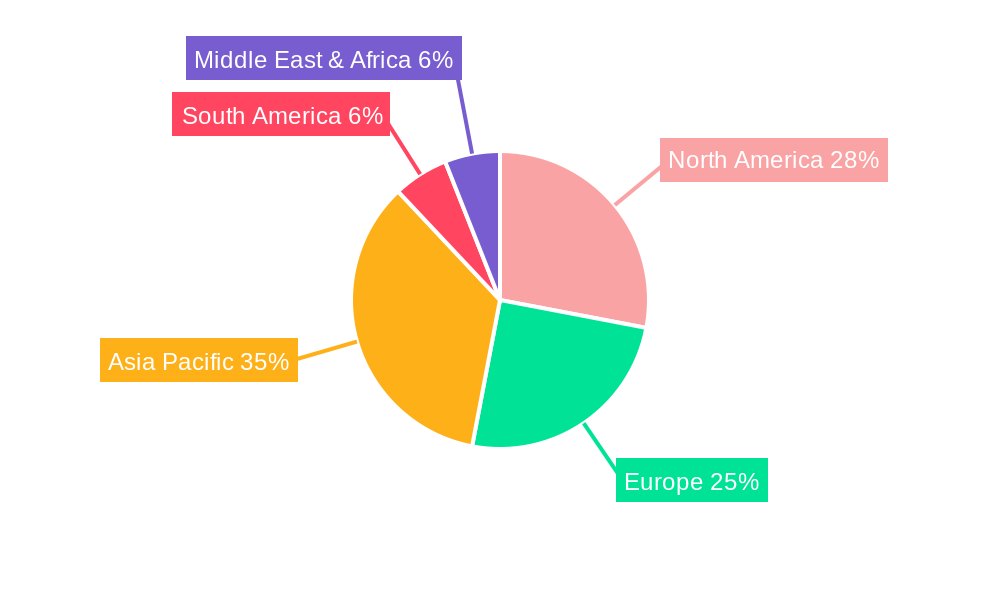
GaN Power Semiconductor Devices Regional Market Share
Geographic Coverage of GaN Power Semiconductor Devices
GaN Power Semiconductor Devices REPORT HIGHLIGHTS
| Aspects | Details |
|---|---|
| Study Period | 2020-2034 |
| Base Year | 2025 |
| Estimated Year | 2026 |
| Forecast Period | 2026-2034 |
| Historical Period | 2020-2025 |
| Growth Rate | CAGR of 35.9% from 2020-2034 |
| Segmentation |
|
Table of Contents
- 1. Introduction
- 1.1. Research Scope
- 1.2. Market Segmentation
- 1.3. Research Methodology
- 1.4. Definitions and Assumptions
- 2. Executive Summary
- 2.1. Introduction
- 3. Market Dynamics
- 3.1. Introduction
- 3.2. Market Drivers
- 3.3. Market Restrains
- 3.4. Market Trends
- 4. Market Factor Analysis
- 4.1. Porters Five Forces
- 4.2. Supply/Value Chain
- 4.3. PESTEL analysis
- 4.4. Market Entropy
- 4.5. Patent/Trademark Analysis
- 5. Global GaN Power Semiconductor Devices Analysis, Insights and Forecast, 2020-2032
- 5.1. Market Analysis, Insights and Forecast - by Application
- 5.1.1. Communication
- 5.1.2. Automotive
- 5.1.3. Consumer Electronics
- 5.1.4. Defence/Aerospace
- 5.1.5. Healthcare
- 5.1.6. Industry,Power and Solar & Wind
- 5.2. Market Analysis, Insights and Forecast - by Types
- 5.2.1. 2 Inch
- 5.2.2. 4 Inch
- 5.2.3. 6 Inch
- 5.2.4. 8 Inch
- 5.2.5. 12 Inch
- 5.3. Market Analysis, Insights and Forecast - by Region
- 5.3.1. North America
- 5.3.2. South America
- 5.3.3. Europe
- 5.3.4. Middle East & Africa
- 5.3.5. Asia Pacific
- 5.1. Market Analysis, Insights and Forecast - by Application
- 6. North America GaN Power Semiconductor Devices Analysis, Insights and Forecast, 2020-2032
- 6.1. Market Analysis, Insights and Forecast - by Application
- 6.1.1. Communication
- 6.1.2. Automotive
- 6.1.3. Consumer Electronics
- 6.1.4. Defence/Aerospace
- 6.1.5. Healthcare
- 6.1.6. Industry,Power and Solar & Wind
- 6.2. Market Analysis, Insights and Forecast - by Types
- 6.2.1. 2 Inch
- 6.2.2. 4 Inch
- 6.2.3. 6 Inch
- 6.2.4. 8 Inch
- 6.2.5. 12 Inch
- 6.1. Market Analysis, Insights and Forecast - by Application
- 7. South America GaN Power Semiconductor Devices Analysis, Insights and Forecast, 2020-2032
- 7.1. Market Analysis, Insights and Forecast - by Application
- 7.1.1. Communication
- 7.1.2. Automotive
- 7.1.3. Consumer Electronics
- 7.1.4. Defence/Aerospace
- 7.1.5. Healthcare
- 7.1.6. Industry,Power and Solar & Wind
- 7.2. Market Analysis, Insights and Forecast - by Types
- 7.2.1. 2 Inch
- 7.2.2. 4 Inch
- 7.2.3. 6 Inch
- 7.2.4. 8 Inch
- 7.2.5. 12 Inch
- 7.1. Market Analysis, Insights and Forecast - by Application
- 8. Europe GaN Power Semiconductor Devices Analysis, Insights and Forecast, 2020-2032
- 8.1. Market Analysis, Insights and Forecast - by Application
- 8.1.1. Communication
- 8.1.2. Automotive
- 8.1.3. Consumer Electronics
- 8.1.4. Defence/Aerospace
- 8.1.5. Healthcare
- 8.1.6. Industry,Power and Solar & Wind
- 8.2. Market Analysis, Insights and Forecast - by Types
- 8.2.1. 2 Inch
- 8.2.2. 4 Inch
- 8.2.3. 6 Inch
- 8.2.4. 8 Inch
- 8.2.5. 12 Inch
- 8.1. Market Analysis, Insights and Forecast - by Application
- 9. Middle East & Africa GaN Power Semiconductor Devices Analysis, Insights and Forecast, 2020-2032
- 9.1. Market Analysis, Insights and Forecast - by Application
- 9.1.1. Communication
- 9.1.2. Automotive
- 9.1.3. Consumer Electronics
- 9.1.4. Defence/Aerospace
- 9.1.5. Healthcare
- 9.1.6. Industry,Power and Solar & Wind
- 9.2. Market Analysis, Insights and Forecast - by Types
- 9.2.1. 2 Inch
- 9.2.2. 4 Inch
- 9.2.3. 6 Inch
- 9.2.4. 8 Inch
- 9.2.5. 12 Inch
- 9.1. Market Analysis, Insights and Forecast - by Application
- 10. Asia Pacific GaN Power Semiconductor Devices Analysis, Insights and Forecast, 2020-2032
- 10.1. Market Analysis, Insights and Forecast - by Application
- 10.1.1. Communication
- 10.1.2. Automotive
- 10.1.3. Consumer Electronics
- 10.1.4. Defence/Aerospace
- 10.1.5. Healthcare
- 10.1.6. Industry,Power and Solar & Wind
- 10.2. Market Analysis, Insights and Forecast - by Types
- 10.2.1. 2 Inch
- 10.2.2. 4 Inch
- 10.2.3. 6 Inch
- 10.2.4. 8 Inch
- 10.2.5. 12 Inch
- 10.1. Market Analysis, Insights and Forecast - by Application
- 11. Competitive Analysis
- 11.1. Global Market Share Analysis 2025
- 11.2. Company Profiles
- 11.2.1 ALPHA & OMEGA Semiconductor
- 11.2.1.1. Overview
- 11.2.1.2. Products
- 11.2.1.3. SWOT Analysis
- 11.2.1.4. Recent Developments
- 11.2.1.5. Financials (Based on Availability)
- 11.2.2 Avogy
- 11.2.2.1. Overview
- 11.2.2.2. Products
- 11.2.2.3. SWOT Analysis
- 11.2.2.4. Recent Developments
- 11.2.2.5. Financials (Based on Availability)
- 11.2.3 Broadcom Limited
- 11.2.3.1. Overview
- 11.2.3.2. Products
- 11.2.3.3. SWOT Analysis
- 11.2.3.4. Recent Developments
- 11.2.3.5. Financials (Based on Availability)
- 11.2.4 Cambridge Electronics
- 11.2.4.1. Overview
- 11.2.4.2. Products
- 11.2.4.3. SWOT Analysis
- 11.2.4.4. Recent Developments
- 11.2.4.5. Financials (Based on Availability)
- 11.2.5 Cree
- 11.2.5.1. Overview
- 11.2.5.2. Products
- 11.2.5.3. SWOT Analysis
- 11.2.5.4. Recent Developments
- 11.2.5.5. Financials (Based on Availability)
- 11.2.6 Efficient Power Conversion (EPC)
- 11.2.6.1. Overview
- 11.2.6.2. Products
- 11.2.6.3. SWOT Analysis
- 11.2.6.4. Recent Developments
- 11.2.6.5. Financials (Based on Availability)
- 11.2.7 EXAGAN
- 11.2.7.1. Overview
- 11.2.7.2. Products
- 11.2.7.3. SWOT Analysis
- 11.2.7.4. Recent Developments
- 11.2.7.5. Financials (Based on Availability)
- 11.2.8 GaN Systems
- 11.2.8.1. Overview
- 11.2.8.2. Products
- 11.2.8.3. SWOT Analysis
- 11.2.8.4. Recent Developments
- 11.2.8.5. Financials (Based on Availability)
- 11.2.9 IEPC
- 11.2.9.1. Overview
- 11.2.9.2. Products
- 11.2.9.3. SWOT Analysis
- 11.2.9.4. Recent Developments
- 11.2.9.5. Financials (Based on Availability)
- 11.2.10 Infineon
- 11.2.10.1. Overview
- 11.2.10.2. Products
- 11.2.10.3. SWOT Analysis
- 11.2.10.4. Recent Developments
- 11.2.10.5. Financials (Based on Availability)
- 11.2.11 NXP
- 11.2.11.1. Overview
- 11.2.11.2. Products
- 11.2.11.3. SWOT Analysis
- 11.2.11.4. Recent Developments
- 11.2.11.5. Financials (Based on Availability)
- 11.2.12 Panasonic
- 11.2.12.1. Overview
- 11.2.12.2. Products
- 11.2.12.3. SWOT Analysis
- 11.2.12.4. Recent Developments
- 11.2.12.5. Financials (Based on Availability)
- 11.2.13 POWDEC
- 11.2.13.1. Overview
- 11.2.13.2. Products
- 11.2.13.3. SWOT Analysis
- 11.2.13.4. Recent Developments
- 11.2.13.5. Financials (Based on Availability)
- 11.2.14 Transphorm
- 11.2.14.1. Overview
- 11.2.14.2. Products
- 11.2.14.3. SWOT Analysis
- 11.2.14.4. Recent Developments
- 11.2.14.5. Financials (Based on Availability)
- 11.2.15 VisIC
- 11.2.15.1. Overview
- 11.2.15.2. Products
- 11.2.15.3. SWOT Analysis
- 11.2.15.4. Recent Developments
- 11.2.15.5. Financials (Based on Availability)
- 11.2.1 ALPHA & OMEGA Semiconductor
List of Figures
- Figure 1: Global GaN Power Semiconductor Devices Revenue Breakdown (million, %) by Region 2025 & 2033
- Figure 2: North America GaN Power Semiconductor Devices Revenue (million), by Application 2025 & 2033
- Figure 3: North America GaN Power Semiconductor Devices Revenue Share (%), by Application 2025 & 2033
- Figure 4: North America GaN Power Semiconductor Devices Revenue (million), by Types 2025 & 2033
- Figure 5: North America GaN Power Semiconductor Devices Revenue Share (%), by Types 2025 & 2033
- Figure 6: North America GaN Power Semiconductor Devices Revenue (million), by Country 2025 & 2033
- Figure 7: North America GaN Power Semiconductor Devices Revenue Share (%), by Country 2025 & 2033
- Figure 8: South America GaN Power Semiconductor Devices Revenue (million), by Application 2025 & 2033
- Figure 9: South America GaN Power Semiconductor Devices Revenue Share (%), by Application 2025 & 2033
- Figure 10: South America GaN Power Semiconductor Devices Revenue (million), by Types 2025 & 2033
- Figure 11: South America GaN Power Semiconductor Devices Revenue Share (%), by Types 2025 & 2033
- Figure 12: South America GaN Power Semiconductor Devices Revenue (million), by Country 2025 & 2033
- Figure 13: South America GaN Power Semiconductor Devices Revenue Share (%), by Country 2025 & 2033
- Figure 14: Europe GaN Power Semiconductor Devices Revenue (million), by Application 2025 & 2033
- Figure 15: Europe GaN Power Semiconductor Devices Revenue Share (%), by Application 2025 & 2033
- Figure 16: Europe GaN Power Semiconductor Devices Revenue (million), by Types 2025 & 2033
- Figure 17: Europe GaN Power Semiconductor Devices Revenue Share (%), by Types 2025 & 2033
- Figure 18: Europe GaN Power Semiconductor Devices Revenue (million), by Country 2025 & 2033
- Figure 19: Europe GaN Power Semiconductor Devices Revenue Share (%), by Country 2025 & 2033
- Figure 20: Middle East & Africa GaN Power Semiconductor Devices Revenue (million), by Application 2025 & 2033
- Figure 21: Middle East & Africa GaN Power Semiconductor Devices Revenue Share (%), by Application 2025 & 2033
- Figure 22: Middle East & Africa GaN Power Semiconductor Devices Revenue (million), by Types 2025 & 2033
- Figure 23: Middle East & Africa GaN Power Semiconductor Devices Revenue Share (%), by Types 2025 & 2033
- Figure 24: Middle East & Africa GaN Power Semiconductor Devices Revenue (million), by Country 2025 & 2033
- Figure 25: Middle East & Africa GaN Power Semiconductor Devices Revenue Share (%), by Country 2025 & 2033
- Figure 26: Asia Pacific GaN Power Semiconductor Devices Revenue (million), by Application 2025 & 2033
- Figure 27: Asia Pacific GaN Power Semiconductor Devices Revenue Share (%), by Application 2025 & 2033
- Figure 28: Asia Pacific GaN Power Semiconductor Devices Revenue (million), by Types 2025 & 2033
- Figure 29: Asia Pacific GaN Power Semiconductor Devices Revenue Share (%), by Types 2025 & 2033
- Figure 30: Asia Pacific GaN Power Semiconductor Devices Revenue (million), by Country 2025 & 2033
- Figure 31: Asia Pacific GaN Power Semiconductor Devices Revenue Share (%), by Country 2025 & 2033
List of Tables
- Table 1: Global GaN Power Semiconductor Devices Revenue million Forecast, by Application 2020 & 2033
- Table 2: Global GaN Power Semiconductor Devices Revenue million Forecast, by Types 2020 & 2033
- Table 3: Global GaN Power Semiconductor Devices Revenue million Forecast, by Region 2020 & 2033
- Table 4: Global GaN Power Semiconductor Devices Revenue million Forecast, by Application 2020 & 2033
- Table 5: Global GaN Power Semiconductor Devices Revenue million Forecast, by Types 2020 & 2033
- Table 6: Global GaN Power Semiconductor Devices Revenue million Forecast, by Country 2020 & 2033
- Table 7: United States GaN Power Semiconductor Devices Revenue (million) Forecast, by Application 2020 & 2033
- Table 8: Canada GaN Power Semiconductor Devices Revenue (million) Forecast, by Application 2020 & 2033
- Table 9: Mexico GaN Power Semiconductor Devices Revenue (million) Forecast, by Application 2020 & 2033
- Table 10: Global GaN Power Semiconductor Devices Revenue million Forecast, by Application 2020 & 2033
- Table 11: Global GaN Power Semiconductor Devices Revenue million Forecast, by Types 2020 & 2033
- Table 12: Global GaN Power Semiconductor Devices Revenue million Forecast, by Country 2020 & 2033
- Table 13: Brazil GaN Power Semiconductor Devices Revenue (million) Forecast, by Application 2020 & 2033
- Table 14: Argentina GaN Power Semiconductor Devices Revenue (million) Forecast, by Application 2020 & 2033
- Table 15: Rest of South America GaN Power Semiconductor Devices Revenue (million) Forecast, by Application 2020 & 2033
- Table 16: Global GaN Power Semiconductor Devices Revenue million Forecast, by Application 2020 & 2033
- Table 17: Global GaN Power Semiconductor Devices Revenue million Forecast, by Types 2020 & 2033
- Table 18: Global GaN Power Semiconductor Devices Revenue million Forecast, by Country 2020 & 2033
- Table 19: United Kingdom GaN Power Semiconductor Devices Revenue (million) Forecast, by Application 2020 & 2033
- Table 20: Germany GaN Power Semiconductor Devices Revenue (million) Forecast, by Application 2020 & 2033
- Table 21: France GaN Power Semiconductor Devices Revenue (million) Forecast, by Application 2020 & 2033
- Table 22: Italy GaN Power Semiconductor Devices Revenue (million) Forecast, by Application 2020 & 2033
- Table 23: Spain GaN Power Semiconductor Devices Revenue (million) Forecast, by Application 2020 & 2033
- Table 24: Russia GaN Power Semiconductor Devices Revenue (million) Forecast, by Application 2020 & 2033
- Table 25: Benelux GaN Power Semiconductor Devices Revenue (million) Forecast, by Application 2020 & 2033
- Table 26: Nordics GaN Power Semiconductor Devices Revenue (million) Forecast, by Application 2020 & 2033
- Table 27: Rest of Europe GaN Power Semiconductor Devices Revenue (million) Forecast, by Application 2020 & 2033
- Table 28: Global GaN Power Semiconductor Devices Revenue million Forecast, by Application 2020 & 2033
- Table 29: Global GaN Power Semiconductor Devices Revenue million Forecast, by Types 2020 & 2033
- Table 30: Global GaN Power Semiconductor Devices Revenue million Forecast, by Country 2020 & 2033
- Table 31: Turkey GaN Power Semiconductor Devices Revenue (million) Forecast, by Application 2020 & 2033
- Table 32: Israel GaN Power Semiconductor Devices Revenue (million) Forecast, by Application 2020 & 2033
- Table 33: GCC GaN Power Semiconductor Devices Revenue (million) Forecast, by Application 2020 & 2033
- Table 34: North Africa GaN Power Semiconductor Devices Revenue (million) Forecast, by Application 2020 & 2033
- Table 35: South Africa GaN Power Semiconductor Devices Revenue (million) Forecast, by Application 2020 & 2033
- Table 36: Rest of Middle East & Africa GaN Power Semiconductor Devices Revenue (million) Forecast, by Application 2020 & 2033
- Table 37: Global GaN Power Semiconductor Devices Revenue million Forecast, by Application 2020 & 2033
- Table 38: Global GaN Power Semiconductor Devices Revenue million Forecast, by Types 2020 & 2033
- Table 39: Global GaN Power Semiconductor Devices Revenue million Forecast, by Country 2020 & 2033
- Table 40: China GaN Power Semiconductor Devices Revenue (million) Forecast, by Application 2020 & 2033
- Table 41: India GaN Power Semiconductor Devices Revenue (million) Forecast, by Application 2020 & 2033
- Table 42: Japan GaN Power Semiconductor Devices Revenue (million) Forecast, by Application 2020 & 2033
- Table 43: South Korea GaN Power Semiconductor Devices Revenue (million) Forecast, by Application 2020 & 2033
- Table 44: ASEAN GaN Power Semiconductor Devices Revenue (million) Forecast, by Application 2020 & 2033
- Table 45: Oceania GaN Power Semiconductor Devices Revenue (million) Forecast, by Application 2020 & 2033
- Table 46: Rest of Asia Pacific GaN Power Semiconductor Devices Revenue (million) Forecast, by Application 2020 & 2033
Frequently Asked Questions
1. What is the projected Compound Annual Growth Rate (CAGR) of the GaN Power Semiconductor Devices?
The projected CAGR is approximately 35.9%.
2. Which companies are prominent players in the GaN Power Semiconductor Devices?
Key companies in the market include ALPHA & OMEGA Semiconductor, Avogy, Broadcom Limited, Cambridge Electronics, Cree, Efficient Power Conversion (EPC), EXAGAN, GaN Systems, IEPC, Infineon, NXP, Panasonic, POWDEC, Transphorm, VisIC.
3. What are the main segments of the GaN Power Semiconductor Devices?
The market segments include Application, Types.
4. Can you provide details about the market size?
The market size is estimated to be USD 635.1 million as of 2022.
5. What are some drivers contributing to market growth?
N/A
6. What are the notable trends driving market growth?
N/A
7. Are there any restraints impacting market growth?
N/A
8. Can you provide examples of recent developments in the market?
N/A
9. What pricing options are available for accessing the report?
Pricing options include single-user, multi-user, and enterprise licenses priced at USD 4900.00, USD 7350.00, and USD 9800.00 respectively.
10. Is the market size provided in terms of value or volume?
The market size is provided in terms of value, measured in million.
11. Are there any specific market keywords associated with the report?
Yes, the market keyword associated with the report is "GaN Power Semiconductor Devices," which aids in identifying and referencing the specific market segment covered.
12. How do I determine which pricing option suits my needs best?
The pricing options vary based on user requirements and access needs. Individual users may opt for single-user licenses, while businesses requiring broader access may choose multi-user or enterprise licenses for cost-effective access to the report.
13. Are there any additional resources or data provided in the GaN Power Semiconductor Devices report?
While the report offers comprehensive insights, it's advisable to review the specific contents or supplementary materials provided to ascertain if additional resources or data are available.
14. How can I stay updated on further developments or reports in the GaN Power Semiconductor Devices?
To stay informed about further developments, trends, and reports in the GaN Power Semiconductor Devices, consider subscribing to industry newsletters, following relevant companies and organizations, or regularly checking reputable industry news sources and publications.
Methodology
Step 1 - Identification of Relevant Samples Size from Population Database


Step 2 - Approaches for Defining Global Market Size (Value, Volume* & Price*)

Note*: In applicable scenarios
Step 3 - Data Sources
Primary Research
- Web Analytics
- Survey Reports
- Research Institute
- Latest Research Reports
- Opinion Leaders
Secondary Research
- Annual Reports
- White Paper
- Latest Press Release
- Industry Association
- Paid Database
- Investor Presentations

Step 4 - Data Triangulation
Involves using different sources of information in order to increase the validity of a study
These sources are likely to be stakeholders in a program - participants, other researchers, program staff, other community members, and so on.
Then we put all data in single framework & apply various statistical tools to find out the dynamic on the market.
During the analysis stage, feedback from the stakeholder groups would be compared to determine areas of agreement as well as areas of divergence