

Key Insights
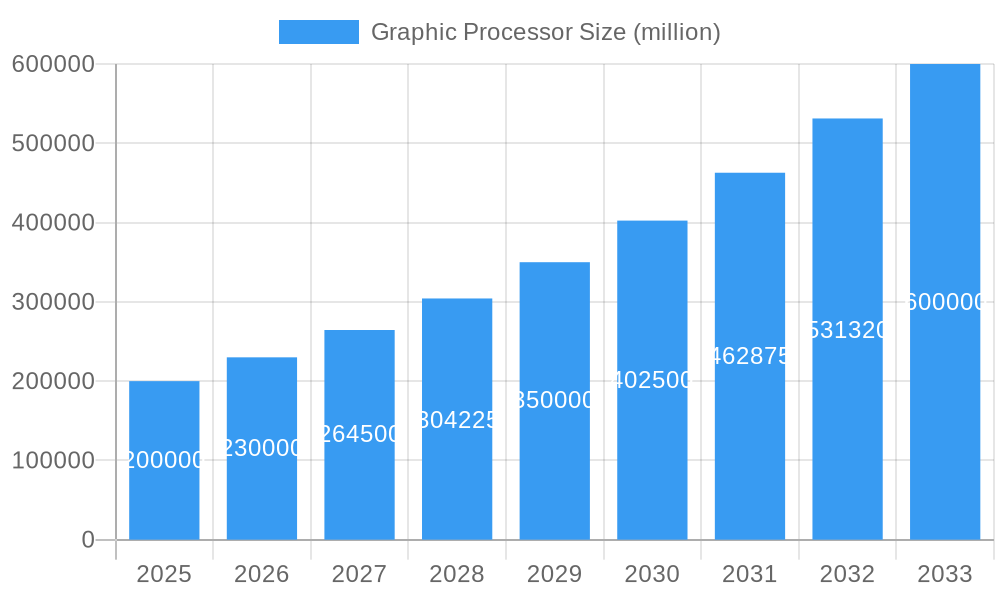
The global graphic processor (GPU) market is experiencing robust growth, driven by the increasing demand for high-performance computing across diverse sectors. The market, estimated at $200 billion in 2025, is projected to maintain a healthy Compound Annual Growth Rate (CAGR) of 15% from 2025 to 2033, reaching approximately $600 billion by 2033. This growth is fueled primarily by the burgeoning gaming industry, the rapid expansion of artificial intelligence (AI) and machine learning (ML) applications, the proliferation of high-resolution displays and virtual reality (VR)/augmented reality (AR) technologies, and the growing adoption of cloud computing services. Key players like Nvidia, AMD, and Intel are intensely competing to dominate market share, constantly innovating with advanced architectures and enhanced processing capabilities to meet these escalating demands.
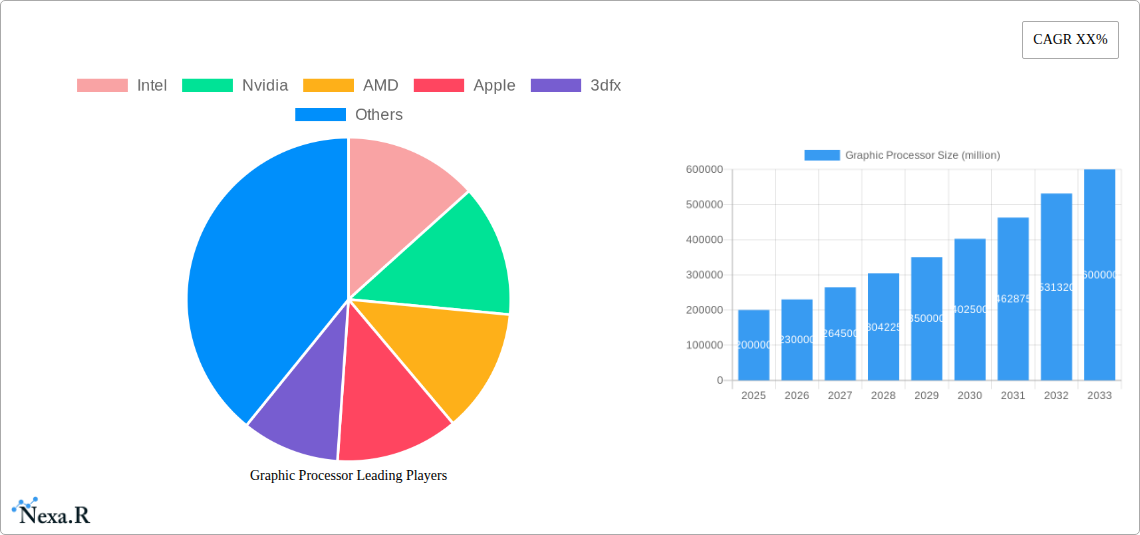
Graphic Processor Market Size (In Billion)
However, the market also faces certain challenges. The high cost of advanced GPUs can limit accessibility for some consumers and businesses, particularly in developing economies. Furthermore, the market is susceptible to fluctuations in the global semiconductor supply chain, which can impact production and pricing. Nevertheless, ongoing advancements in GPU technology, along with the continued growth in data-intensive applications, are expected to overcome these constraints, leading to sustained market expansion in the long term. Segmentation within the market reveals strong growth across various applications, including gaming, professional workstations, data centers, and mobile devices. The competitive landscape, featuring established players alongside emerging contenders, ensures continuous innovation and drives the overall market dynamism.
Graphic Processor Company Market Share
Graphic Processor Market Report: 2019-2033
This comprehensive report provides an in-depth analysis of the Graphic Processor market, encompassing historical data (2019-2024), the base year (2025), and a forecast period extending to 2033. It examines market dynamics, growth trends, regional dominance, product landscapes, challenges, opportunities, and key players across various segments, including the parent market of semiconductors and the child market of gaming and professional graphics. The report leverages extensive data analysis to deliver actionable insights for industry professionals, investors, and strategic decision-makers. The market is valued in million units.
Graphic Processor Market Dynamics & Structure
The graphic processor market, a crucial component of the semiconductor industry, is characterized by intense competition and rapid technological advancements. Market concentration is high, with key players like Nvidia, AMD, and Intel holding significant market shares. However, the emergence of specialized processors for AI and machine learning is fostering diversification. Regulatory frameworks, particularly concerning antitrust and export controls, significantly influence market dynamics. Furthermore, the market experiences continuous innovation, with new architectures and features constantly emerging. The rise of integrated graphics within CPUs presents a competitive challenge, while the demand for high-performance computing (HPC) fuels growth in the high-end segment.
- Market Concentration: Nvidia holds an estimated xx% market share in 2025, followed by AMD (xx%) and Intel (xx%). The remaining market share is distributed among other players.
- M&A Activity: The historical period (2019-2024) saw xx major M&A deals, primarily focused on consolidating smaller players and acquiring specialized technologies.
- Innovation Drivers: Increased demand for higher resolutions, realistic graphics in gaming and virtual reality (VR), and advancements in artificial intelligence (AI) are driving innovation.
- Competitive Substitutes: Integrated graphics processors and software-based rendering solutions pose competitive challenges.
- End-User Demographics: The primary end-users include gamers, professionals (designers, engineers), and data centers.
- Regulatory Frameworks: Government regulations on export controls and antitrust issues impact market activities.
Graphic Processor Growth Trends & Insights
The global graphic processor market experienced significant growth during the historical period (2019-2024), driven by increased demand from gaming, data centers, and emerging applications like AI and machine learning. The market size expanded from xx million units in 2019 to xx million units in 2024, exhibiting a Compound Annual Growth Rate (CAGR) of xx%. This growth is expected to continue, albeit at a moderated pace, during the forecast period (2025-2033), reaching an estimated xx million units by 2033. The adoption rate of high-end graphic processors in data centers is driving premium segment growth, while the increasing popularity of mobile gaming is fueling demand for mobile GPUs. Technological disruptions, such as the advent of ray tracing and advancements in AI-accelerated computing, continue to shape market trends. Consumer behavior shifts towards immersive gaming experiences and higher graphical fidelity are also significantly impacting market dynamics. Market penetration in emerging economies is also a key growth driver. The increasing use of GPUs in AI and machine learning applications is another significant factor contributing to market expansion, with a projected CAGR of xx% during the forecast period.
Dominant Regions, Countries, or Segments in Graphic Processor
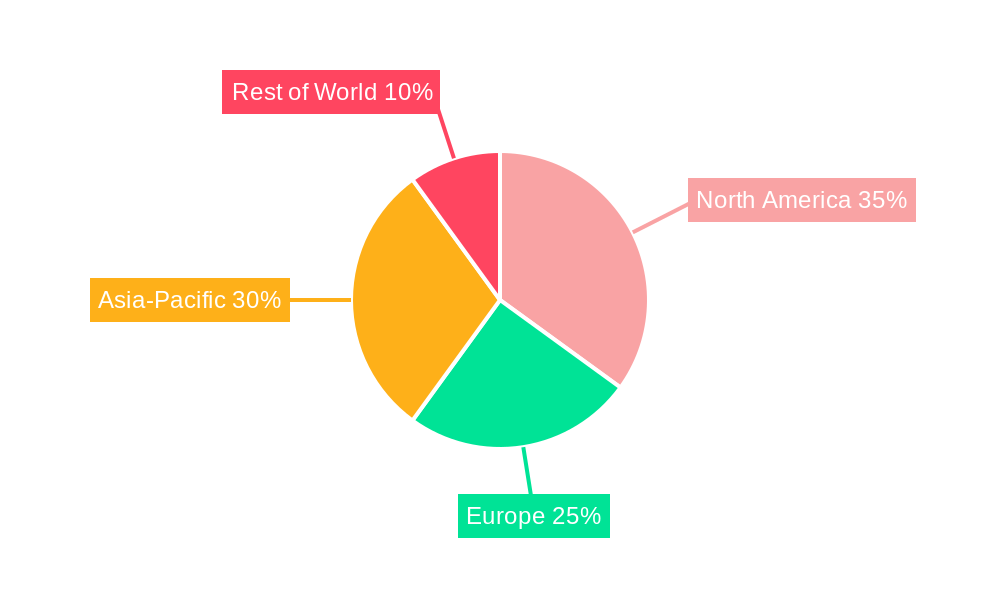
North America currently dominates the graphic processor market, followed by Asia-Pacific. The strong presence of major players, significant investments in technology development, and high consumer spending contribute to North America's leading position. However, the Asia-Pacific region is experiencing rapid growth, driven by increasing smartphone penetration, expanding gaming communities, and government initiatives promoting technological advancements. The high-performance computing (HPC) segment, within the overall graphic processor market, demonstrates the highest growth potential, fueled by the increasing demand for faster computation in AI, data analytics, and scientific research.
- North America: High consumer spending, presence of key players, and strong investments in R&D.
- Asia-Pacific: Rapid growth driven by increasing smartphone penetration, expanding gaming communities, and government initiatives.
- Europe: Steady growth, driven by the increasing adoption of high-performance computing in various industries.
- HPC Segment: Highest growth potential due to increasing demand for faster computation in AI, data analytics, and scientific research.
Graphic Processor Product Landscape
The graphic processor market offers a diverse range of products, catering to different needs and price points. Innovations focus on enhancing processing power, energy efficiency, and feature sets. Key advancements include ray tracing, which delivers realistic lighting and shadows, and AI-accelerated processing, which improves performance in AI and machine learning applications. Unique selling propositions include high frame rates, advanced rendering techniques, and superior power management. Performance metrics such as FLOPS (floating-point operations per second) and memory bandwidth are key indicators of product capabilities.
Key Drivers, Barriers & Challenges in Graphic Processor
Key Drivers: The primary drivers of market growth include the increasing demand for high-resolution gaming, the proliferation of virtual and augmented reality applications, the rapid growth of data centers requiring powerful GPUs, and the surging need for artificial intelligence and machine learning capabilities.
Challenges & Restraints: Supply chain disruptions, particularly in semiconductor manufacturing, pose significant challenges. Furthermore, escalating raw material costs and intense competition, along with regulatory hurdles and intellectual property issues, can hinder market expansion.
Emerging Opportunities in Graphic Processor
Emerging opportunities exist in untapped markets, such as developing economies with rising internet penetration and gaming adoption. Innovative applications, such as automotive graphics, medical imaging, and edge AI processing, present substantial growth potential. The evolving consumer preference for seamless integration across devices and platforms fuels the need for adaptable and versatile graphic solutions.
Growth Accelerators in the Graphic Processor Industry
Long-term growth will be propelled by technological advancements in areas such as advanced memory technologies (HBM), more efficient architectures, and improved power management. Strategic partnerships and collaborations between chip manufacturers and software developers will further accelerate market expansion. Market expansion into new applications and geographic regions will also play a vital role in driving growth.
Notable Milestones in Graphic Processor Sector
- 2020: AMD releases the Radeon RX 6000 series.
- 2021: Nvidia launches the GeForce RTX 30 series.
- 2022: Intel unveils the Arc Alchemist graphics cards.
- 2023: Significant advancements in ray tracing technology across multiple vendors. (Specific dates to be added based on actual releases).
In-Depth Graphic Processor Market Outlook
The graphic processor market is poised for sustained growth over the forecast period. Continuous technological innovation, expanding applications in diverse sectors, and increasing demand from emerging economies will fuel this growth. Strategic collaborations and investments in R&D will further enhance the market's potential. Companies with advanced technology and strong market positions are expected to capture significant market share. Focus on specialized markets and expansion in new applications like automotive will drive growth.
Graphic Processor Segmentation
-
1. Application
- 1.1. GPU Cluster
- 1.2. Mathematica
- 1.3. Molecular Modeling
- 1.4. Deeplearning
-
2. Types
- 2.1. Dedicated Graphics Card
- 2.2. Integrated Graphics Processors
Graphic Processor Segmentation By Geography
-
1. North America
- 1.1. United States
- 1.2. Canada
- 1.3. Mexico
-
2. South America
- 2.1. Brazil
- 2.2. Argentina
- 2.3. Rest of South America
-
3. Europe
- 3.1. United Kingdom
- 3.2. Germany
- 3.3. France
- 3.4. Italy
- 3.5. Spain
- 3.6. Russia
- 3.7. Benelux
- 3.8. Nordics
- 3.9. Rest of Europe
-
4. Middle East & Africa
- 4.1. Turkey
- 4.2. Israel
- 4.3. GCC
- 4.4. North Africa
- 4.5. South Africa
- 4.6. Rest of Middle East & Africa
-
5. Asia Pacific
- 5.1. China
- 5.2. India
- 5.3. Japan
- 5.4. South Korea
- 5.5. ASEAN
- 5.6. Oceania
- 5.7. Rest of Asia Pacific
Graphic Processor Regional Market Share
Geographic Coverage of Graphic Processor
Graphic Processor REPORT HIGHLIGHTS
| Aspects | Details |
|---|---|
| Study Period | 2020-2034 |
| Base Year | 2025 |
| Estimated Year | 2026 |
| Forecast Period | 2026-2034 |
| Historical Period | 2020-2025 |
| Growth Rate | CAGR of 13.89% from 2020-2034 |
| Segmentation |
|
Table of Contents
- 1. Introduction
- 1.1. Research Scope
- 1.2. Market Segmentation
- 1.3. Research Methodology
- 1.4. Definitions and Assumptions
- 2. Executive Summary
- 2.1. Introduction
- 3. Market Dynamics
- 3.1. Introduction
- 3.2. Market Drivers
- 3.3. Market Restrains
- 3.4. Market Trends
- 4. Market Factor Analysis
- 4.1. Porters Five Forces
- 4.2. Supply/Value Chain
- 4.3. PESTEL analysis
- 4.4. Market Entropy
- 4.5. Patent/Trademark Analysis
- 5. Global Graphic Processor Analysis, Insights and Forecast, 2020-2032
- 5.1. Market Analysis, Insights and Forecast - by Application
- 5.1.1. GPU Cluster
- 5.1.2. Mathematica
- 5.1.3. Molecular Modeling
- 5.1.4. Deeplearning
- 5.2. Market Analysis, Insights and Forecast - by Types
- 5.2.1. Dedicated Graphics Card
- 5.2.2. Integrated Graphics Processors
- 5.3. Market Analysis, Insights and Forecast - by Region
- 5.3.1. North America
- 5.3.2. South America
- 5.3.3. Europe
- 5.3.4. Middle East & Africa
- 5.3.5. Asia Pacific
- 5.1. Market Analysis, Insights and Forecast - by Application
- 6. North America Graphic Processor Analysis, Insights and Forecast, 2020-2032
- 6.1. Market Analysis, Insights and Forecast - by Application
- 6.1.1. GPU Cluster
- 6.1.2. Mathematica
- 6.1.3. Molecular Modeling
- 6.1.4. Deeplearning
- 6.2. Market Analysis, Insights and Forecast - by Types
- 6.2.1. Dedicated Graphics Card
- 6.2.2. Integrated Graphics Processors
- 6.1. Market Analysis, Insights and Forecast - by Application
- 7. South America Graphic Processor Analysis, Insights and Forecast, 2020-2032
- 7.1. Market Analysis, Insights and Forecast - by Application
- 7.1.1. GPU Cluster
- 7.1.2. Mathematica
- 7.1.3. Molecular Modeling
- 7.1.4. Deeplearning
- 7.2. Market Analysis, Insights and Forecast - by Types
- 7.2.1. Dedicated Graphics Card
- 7.2.2. Integrated Graphics Processors
- 7.1. Market Analysis, Insights and Forecast - by Application
- 8. Europe Graphic Processor Analysis, Insights and Forecast, 2020-2032
- 8.1. Market Analysis, Insights and Forecast - by Application
- 8.1.1. GPU Cluster
- 8.1.2. Mathematica
- 8.1.3. Molecular Modeling
- 8.1.4. Deeplearning
- 8.2. Market Analysis, Insights and Forecast - by Types
- 8.2.1. Dedicated Graphics Card
- 8.2.2. Integrated Graphics Processors
- 8.1. Market Analysis, Insights and Forecast - by Application
- 9. Middle East & Africa Graphic Processor Analysis, Insights and Forecast, 2020-2032
- 9.1. Market Analysis, Insights and Forecast - by Application
- 9.1.1. GPU Cluster
- 9.1.2. Mathematica
- 9.1.3. Molecular Modeling
- 9.1.4. Deeplearning
- 9.2. Market Analysis, Insights and Forecast - by Types
- 9.2.1. Dedicated Graphics Card
- 9.2.2. Integrated Graphics Processors
- 9.1. Market Analysis, Insights and Forecast - by Application
- 10. Asia Pacific Graphic Processor Analysis, Insights and Forecast, 2020-2032
- 10.1. Market Analysis, Insights and Forecast - by Application
- 10.1.1. GPU Cluster
- 10.1.2. Mathematica
- 10.1.3. Molecular Modeling
- 10.1.4. Deeplearning
- 10.2. Market Analysis, Insights and Forecast - by Types
- 10.2.1. Dedicated Graphics Card
- 10.2.2. Integrated Graphics Processors
- 10.1. Market Analysis, Insights and Forecast - by Application
- 11. Competitive Analysis
- 11.1. Global Market Share Analysis 2025
- 11.2. Company Profiles
- 11.2.1 Intel
- 11.2.1.1. Overview
- 11.2.1.2. Products
- 11.2.1.3. SWOT Analysis
- 11.2.1.4. Recent Developments
- 11.2.1.5. Financials (Based on Availability)
- 11.2.2 Nvidia
- 11.2.2.1. Overview
- 11.2.2.2. Products
- 11.2.2.3. SWOT Analysis
- 11.2.2.4. Recent Developments
- 11.2.2.5. Financials (Based on Availability)
- 11.2.3 AMD
- 11.2.3.1. Overview
- 11.2.3.2. Products
- 11.2.3.3. SWOT Analysis
- 11.2.3.4. Recent Developments
- 11.2.3.5. Financials (Based on Availability)
- 11.2.4 Apple
- 11.2.4.1. Overview
- 11.2.4.2. Products
- 11.2.4.3. SWOT Analysis
- 11.2.4.4. Recent Developments
- 11.2.4.5. Financials (Based on Availability)
- 11.2.5 3dfx
- 11.2.5.1. Overview
- 11.2.5.2. Products
- 11.2.5.3. SWOT Analysis
- 11.2.5.4. Recent Developments
- 11.2.5.5. Financials (Based on Availability)
- 11.2.6 Matrox
- 11.2.6.1. Overview
- 11.2.6.2. Products
- 11.2.6.3. SWOT Analysis
- 11.2.6.4. Recent Developments
- 11.2.6.5. Financials (Based on Availability)
- 11.2.7 SiS
- 11.2.7.1. Overview
- 11.2.7.2. Products
- 11.2.7.3. SWOT Analysis
- 11.2.7.4. Recent Developments
- 11.2.7.5. Financials (Based on Availability)
- 11.2.8 VIA
- 11.2.8.1. Overview
- 11.2.8.2. Products
- 11.2.8.3. SWOT Analysis
- 11.2.8.4. Recent Developments
- 11.2.8.5. Financials (Based on Availability)
- 11.2.9 Broadcom
- 11.2.9.1. Overview
- 11.2.9.2. Products
- 11.2.9.3. SWOT Analysis
- 11.2.9.4. Recent Developments
- 11.2.9.5. Financials (Based on Availability)
- 11.2.10 Marvel
- 11.2.10.1. Overview
- 11.2.10.2. Products
- 11.2.10.3. SWOT Analysis
- 11.2.10.4. Recent Developments
- 11.2.10.5. Financials (Based on Availability)
- 11.2.1 Intel
List of Figures
- Figure 1: Global Graphic Processor Revenue Breakdown (undefined, %) by Region 2025 & 2033
- Figure 2: Global Graphic Processor Volume Breakdown (K, %) by Region 2025 & 2033
- Figure 3: North America Graphic Processor Revenue (undefined), by Application 2025 & 2033
- Figure 4: North America Graphic Processor Volume (K), by Application 2025 & 2033
- Figure 5: North America Graphic Processor Revenue Share (%), by Application 2025 & 2033
- Figure 6: North America Graphic Processor Volume Share (%), by Application 2025 & 2033
- Figure 7: North America Graphic Processor Revenue (undefined), by Types 2025 & 2033
- Figure 8: North America Graphic Processor Volume (K), by Types 2025 & 2033
- Figure 9: North America Graphic Processor Revenue Share (%), by Types 2025 & 2033
- Figure 10: North America Graphic Processor Volume Share (%), by Types 2025 & 2033
- Figure 11: North America Graphic Processor Revenue (undefined), by Country 2025 & 2033
- Figure 12: North America Graphic Processor Volume (K), by Country 2025 & 2033
- Figure 13: North America Graphic Processor Revenue Share (%), by Country 2025 & 2033
- Figure 14: North America Graphic Processor Volume Share (%), by Country 2025 & 2033
- Figure 15: South America Graphic Processor Revenue (undefined), by Application 2025 & 2033
- Figure 16: South America Graphic Processor Volume (K), by Application 2025 & 2033
- Figure 17: South America Graphic Processor Revenue Share (%), by Application 2025 & 2033
- Figure 18: South America Graphic Processor Volume Share (%), by Application 2025 & 2033
- Figure 19: South America Graphic Processor Revenue (undefined), by Types 2025 & 2033
- Figure 20: South America Graphic Processor Volume (K), by Types 2025 & 2033
- Figure 21: South America Graphic Processor Revenue Share (%), by Types 2025 & 2033
- Figure 22: South America Graphic Processor Volume Share (%), by Types 2025 & 2033
- Figure 23: South America Graphic Processor Revenue (undefined), by Country 2025 & 2033
- Figure 24: South America Graphic Processor Volume (K), by Country 2025 & 2033
- Figure 25: South America Graphic Processor Revenue Share (%), by Country 2025 & 2033
- Figure 26: South America Graphic Processor Volume Share (%), by Country 2025 & 2033
- Figure 27: Europe Graphic Processor Revenue (undefined), by Application 2025 & 2033
- Figure 28: Europe Graphic Processor Volume (K), by Application 2025 & 2033
- Figure 29: Europe Graphic Processor Revenue Share (%), by Application 2025 & 2033
- Figure 30: Europe Graphic Processor Volume Share (%), by Application 2025 & 2033
- Figure 31: Europe Graphic Processor Revenue (undefined), by Types 2025 & 2033
- Figure 32: Europe Graphic Processor Volume (K), by Types 2025 & 2033
- Figure 33: Europe Graphic Processor Revenue Share (%), by Types 2025 & 2033
- Figure 34: Europe Graphic Processor Volume Share (%), by Types 2025 & 2033
- Figure 35: Europe Graphic Processor Revenue (undefined), by Country 2025 & 2033
- Figure 36: Europe Graphic Processor Volume (K), by Country 2025 & 2033
- Figure 37: Europe Graphic Processor Revenue Share (%), by Country 2025 & 2033
- Figure 38: Europe Graphic Processor Volume Share (%), by Country 2025 & 2033
- Figure 39: Middle East & Africa Graphic Processor Revenue (undefined), by Application 2025 & 2033
- Figure 40: Middle East & Africa Graphic Processor Volume (K), by Application 2025 & 2033
- Figure 41: Middle East & Africa Graphic Processor Revenue Share (%), by Application 2025 & 2033
- Figure 42: Middle East & Africa Graphic Processor Volume Share (%), by Application 2025 & 2033
- Figure 43: Middle East & Africa Graphic Processor Revenue (undefined), by Types 2025 & 2033
- Figure 44: Middle East & Africa Graphic Processor Volume (K), by Types 2025 & 2033
- Figure 45: Middle East & Africa Graphic Processor Revenue Share (%), by Types 2025 & 2033
- Figure 46: Middle East & Africa Graphic Processor Volume Share (%), by Types 2025 & 2033
- Figure 47: Middle East & Africa Graphic Processor Revenue (undefined), by Country 2025 & 2033
- Figure 48: Middle East & Africa Graphic Processor Volume (K), by Country 2025 & 2033
- Figure 49: Middle East & Africa Graphic Processor Revenue Share (%), by Country 2025 & 2033
- Figure 50: Middle East & Africa Graphic Processor Volume Share (%), by Country 2025 & 2033
- Figure 51: Asia Pacific Graphic Processor Revenue (undefined), by Application 2025 & 2033
- Figure 52: Asia Pacific Graphic Processor Volume (K), by Application 2025 & 2033
- Figure 53: Asia Pacific Graphic Processor Revenue Share (%), by Application 2025 & 2033
- Figure 54: Asia Pacific Graphic Processor Volume Share (%), by Application 2025 & 2033
- Figure 55: Asia Pacific Graphic Processor Revenue (undefined), by Types 2025 & 2033
- Figure 56: Asia Pacific Graphic Processor Volume (K), by Types 2025 & 2033
- Figure 57: Asia Pacific Graphic Processor Revenue Share (%), by Types 2025 & 2033
- Figure 58: Asia Pacific Graphic Processor Volume Share (%), by Types 2025 & 2033
- Figure 59: Asia Pacific Graphic Processor Revenue (undefined), by Country 2025 & 2033
- Figure 60: Asia Pacific Graphic Processor Volume (K), by Country 2025 & 2033
- Figure 61: Asia Pacific Graphic Processor Revenue Share (%), by Country 2025 & 2033
- Figure 62: Asia Pacific Graphic Processor Volume Share (%), by Country 2025 & 2033
List of Tables
- Table 1: Global Graphic Processor Revenue undefined Forecast, by Application 2020 & 2033
- Table 2: Global Graphic Processor Volume K Forecast, by Application 2020 & 2033
- Table 3: Global Graphic Processor Revenue undefined Forecast, by Types 2020 & 2033
- Table 4: Global Graphic Processor Volume K Forecast, by Types 2020 & 2033
- Table 5: Global Graphic Processor Revenue undefined Forecast, by Region 2020 & 2033
- Table 6: Global Graphic Processor Volume K Forecast, by Region 2020 & 2033
- Table 7: Global Graphic Processor Revenue undefined Forecast, by Application 2020 & 2033
- Table 8: Global Graphic Processor Volume K Forecast, by Application 2020 & 2033
- Table 9: Global Graphic Processor Revenue undefined Forecast, by Types 2020 & 2033
- Table 10: Global Graphic Processor Volume K Forecast, by Types 2020 & 2033
- Table 11: Global Graphic Processor Revenue undefined Forecast, by Country 2020 & 2033
- Table 12: Global Graphic Processor Volume K Forecast, by Country 2020 & 2033
- Table 13: United States Graphic Processor Revenue (undefined) Forecast, by Application 2020 & 2033
- Table 14: United States Graphic Processor Volume (K) Forecast, by Application 2020 & 2033
- Table 15: Canada Graphic Processor Revenue (undefined) Forecast, by Application 2020 & 2033
- Table 16: Canada Graphic Processor Volume (K) Forecast, by Application 2020 & 2033
- Table 17: Mexico Graphic Processor Revenue (undefined) Forecast, by Application 2020 & 2033
- Table 18: Mexico Graphic Processor Volume (K) Forecast, by Application 2020 & 2033
- Table 19: Global Graphic Processor Revenue undefined Forecast, by Application 2020 & 2033
- Table 20: Global Graphic Processor Volume K Forecast, by Application 2020 & 2033
- Table 21: Global Graphic Processor Revenue undefined Forecast, by Types 2020 & 2033
- Table 22: Global Graphic Processor Volume K Forecast, by Types 2020 & 2033
- Table 23: Global Graphic Processor Revenue undefined Forecast, by Country 2020 & 2033
- Table 24: Global Graphic Processor Volume K Forecast, by Country 2020 & 2033
- Table 25: Brazil Graphic Processor Revenue (undefined) Forecast, by Application 2020 & 2033
- Table 26: Brazil Graphic Processor Volume (K) Forecast, by Application 2020 & 2033
- Table 27: Argentina Graphic Processor Revenue (undefined) Forecast, by Application 2020 & 2033
- Table 28: Argentina Graphic Processor Volume (K) Forecast, by Application 2020 & 2033
- Table 29: Rest of South America Graphic Processor Revenue (undefined) Forecast, by Application 2020 & 2033
- Table 30: Rest of South America Graphic Processor Volume (K) Forecast, by Application 2020 & 2033
- Table 31: Global Graphic Processor Revenue undefined Forecast, by Application 2020 & 2033
- Table 32: Global Graphic Processor Volume K Forecast, by Application 2020 & 2033
- Table 33: Global Graphic Processor Revenue undefined Forecast, by Types 2020 & 2033
- Table 34: Global Graphic Processor Volume K Forecast, by Types 2020 & 2033
- Table 35: Global Graphic Processor Revenue undefined Forecast, by Country 2020 & 2033
- Table 36: Global Graphic Processor Volume K Forecast, by Country 2020 & 2033
- Table 37: United Kingdom Graphic Processor Revenue (undefined) Forecast, by Application 2020 & 2033
- Table 38: United Kingdom Graphic Processor Volume (K) Forecast, by Application 2020 & 2033
- Table 39: Germany Graphic Processor Revenue (undefined) Forecast, by Application 2020 & 2033
- Table 40: Germany Graphic Processor Volume (K) Forecast, by Application 2020 & 2033
- Table 41: France Graphic Processor Revenue (undefined) Forecast, by Application 2020 & 2033
- Table 42: France Graphic Processor Volume (K) Forecast, by Application 2020 & 2033
- Table 43: Italy Graphic Processor Revenue (undefined) Forecast, by Application 2020 & 2033
- Table 44: Italy Graphic Processor Volume (K) Forecast, by Application 2020 & 2033
- Table 45: Spain Graphic Processor Revenue (undefined) Forecast, by Application 2020 & 2033
- Table 46: Spain Graphic Processor Volume (K) Forecast, by Application 2020 & 2033
- Table 47: Russia Graphic Processor Revenue (undefined) Forecast, by Application 2020 & 2033
- Table 48: Russia Graphic Processor Volume (K) Forecast, by Application 2020 & 2033
- Table 49: Benelux Graphic Processor Revenue (undefined) Forecast, by Application 2020 & 2033
- Table 50: Benelux Graphic Processor Volume (K) Forecast, by Application 2020 & 2033
- Table 51: Nordics Graphic Processor Revenue (undefined) Forecast, by Application 2020 & 2033
- Table 52: Nordics Graphic Processor Volume (K) Forecast, by Application 2020 & 2033
- Table 53: Rest of Europe Graphic Processor Revenue (undefined) Forecast, by Application 2020 & 2033
- Table 54: Rest of Europe Graphic Processor Volume (K) Forecast, by Application 2020 & 2033
- Table 55: Global Graphic Processor Revenue undefined Forecast, by Application 2020 & 2033
- Table 56: Global Graphic Processor Volume K Forecast, by Application 2020 & 2033
- Table 57: Global Graphic Processor Revenue undefined Forecast, by Types 2020 & 2033
- Table 58: Global Graphic Processor Volume K Forecast, by Types 2020 & 2033
- Table 59: Global Graphic Processor Revenue undefined Forecast, by Country 2020 & 2033
- Table 60: Global Graphic Processor Volume K Forecast, by Country 2020 & 2033
- Table 61: Turkey Graphic Processor Revenue (undefined) Forecast, by Application 2020 & 2033
- Table 62: Turkey Graphic Processor Volume (K) Forecast, by Application 2020 & 2033
- Table 63: Israel Graphic Processor Revenue (undefined) Forecast, by Application 2020 & 2033
- Table 64: Israel Graphic Processor Volume (K) Forecast, by Application 2020 & 2033
- Table 65: GCC Graphic Processor Revenue (undefined) Forecast, by Application 2020 & 2033
- Table 66: GCC Graphic Processor Volume (K) Forecast, by Application 2020 & 2033
- Table 67: North Africa Graphic Processor Revenue (undefined) Forecast, by Application 2020 & 2033
- Table 68: North Africa Graphic Processor Volume (K) Forecast, by Application 2020 & 2033
- Table 69: South Africa Graphic Processor Revenue (undefined) Forecast, by Application 2020 & 2033
- Table 70: South Africa Graphic Processor Volume (K) Forecast, by Application 2020 & 2033
- Table 71: Rest of Middle East & Africa Graphic Processor Revenue (undefined) Forecast, by Application 2020 & 2033
- Table 72: Rest of Middle East & Africa Graphic Processor Volume (K) Forecast, by Application 2020 & 2033
- Table 73: Global Graphic Processor Revenue undefined Forecast, by Application 2020 & 2033
- Table 74: Global Graphic Processor Volume K Forecast, by Application 2020 & 2033
- Table 75: Global Graphic Processor Revenue undefined Forecast, by Types 2020 & 2033
- Table 76: Global Graphic Processor Volume K Forecast, by Types 2020 & 2033
- Table 77: Global Graphic Processor Revenue undefined Forecast, by Country 2020 & 2033
- Table 78: Global Graphic Processor Volume K Forecast, by Country 2020 & 2033
- Table 79: China Graphic Processor Revenue (undefined) Forecast, by Application 2020 & 2033
- Table 80: China Graphic Processor Volume (K) Forecast, by Application 2020 & 2033
- Table 81: India Graphic Processor Revenue (undefined) Forecast, by Application 2020 & 2033
- Table 82: India Graphic Processor Volume (K) Forecast, by Application 2020 & 2033
- Table 83: Japan Graphic Processor Revenue (undefined) Forecast, by Application 2020 & 2033
- Table 84: Japan Graphic Processor Volume (K) Forecast, by Application 2020 & 2033
- Table 85: South Korea Graphic Processor Revenue (undefined) Forecast, by Application 2020 & 2033
- Table 86: South Korea Graphic Processor Volume (K) Forecast, by Application 2020 & 2033
- Table 87: ASEAN Graphic Processor Revenue (undefined) Forecast, by Application 2020 & 2033
- Table 88: ASEAN Graphic Processor Volume (K) Forecast, by Application 2020 & 2033
- Table 89: Oceania Graphic Processor Revenue (undefined) Forecast, by Application 2020 & 2033
- Table 90: Oceania Graphic Processor Volume (K) Forecast, by Application 2020 & 2033
- Table 91: Rest of Asia Pacific Graphic Processor Revenue (undefined) Forecast, by Application 2020 & 2033
- Table 92: Rest of Asia Pacific Graphic Processor Volume (K) Forecast, by Application 2020 & 2033
Frequently Asked Questions
1. What is the projected Compound Annual Growth Rate (CAGR) of the Graphic Processor?
The projected CAGR is approximately 13.89%.
2. Which companies are prominent players in the Graphic Processor?
Key companies in the market include Intel, Nvidia, AMD, Apple, 3dfx, Matrox, SiS, VIA, Broadcom, Marvel.
3. What are the main segments of the Graphic Processor?
The market segments include Application, Types.
4. Can you provide details about the market size?
The market size is estimated to be USD XXX N/A as of 2022.
5. What are some drivers contributing to market growth?
N/A
6. What are the notable trends driving market growth?
N/A
7. Are there any restraints impacting market growth?
N/A
8. Can you provide examples of recent developments in the market?
N/A
9. What pricing options are available for accessing the report?
Pricing options include single-user, multi-user, and enterprise licenses priced at USD 3350.00, USD 5025.00, and USD 6700.00 respectively.
10. Is the market size provided in terms of value or volume?
The market size is provided in terms of value, measured in N/A and volume, measured in K.
11. Are there any specific market keywords associated with the report?
Yes, the market keyword associated with the report is "Graphic Processor," which aids in identifying and referencing the specific market segment covered.
12. How do I determine which pricing option suits my needs best?
The pricing options vary based on user requirements and access needs. Individual users may opt for single-user licenses, while businesses requiring broader access may choose multi-user or enterprise licenses for cost-effective access to the report.
13. Are there any additional resources or data provided in the Graphic Processor report?
While the report offers comprehensive insights, it's advisable to review the specific contents or supplementary materials provided to ascertain if additional resources or data are available.
14. How can I stay updated on further developments or reports in the Graphic Processor?
To stay informed about further developments, trends, and reports in the Graphic Processor, consider subscribing to industry newsletters, following relevant companies and organizations, or regularly checking reputable industry news sources and publications.
Methodology
Step 1 - Identification of Relevant Samples Size from Population Database


Step 2 - Approaches for Defining Global Market Size (Value, Volume* & Price*)

Note*: In applicable scenarios
Step 3 - Data Sources
Primary Research
- Web Analytics
- Survey Reports
- Research Institute
- Latest Research Reports
- Opinion Leaders
Secondary Research
- Annual Reports
- White Paper
- Latest Press Release
- Industry Association
- Paid Database
- Investor Presentations

Step 4 - Data Triangulation
Involves using different sources of information in order to increase the validity of a study
These sources are likely to be stakeholders in a program - participants, other researchers, program staff, other community members, and so on.
Then we put all data in single framework & apply various statistical tools to find out the dynamic on the market.
During the analysis stage, feedback from the stakeholder groups would be compared to determine areas of agreement as well as areas of divergence