

Key Insights
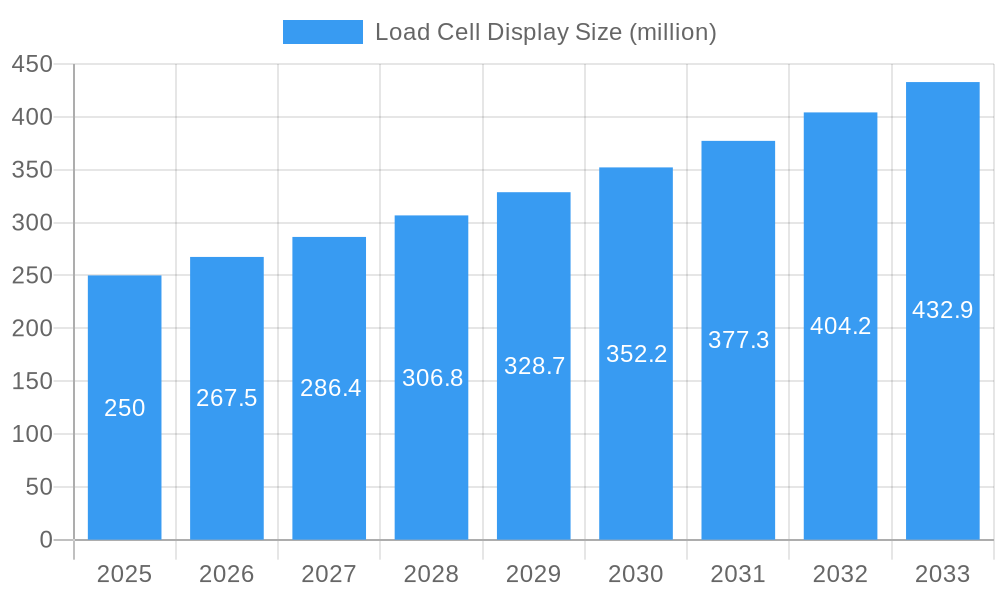
The global load cell display market is experiencing robust growth, driven by increasing automation across various industries and the rising demand for precise weight measurement in manufacturing, logistics, and healthcare. The market's expansion is fueled by technological advancements leading to more compact, accurate, and cost-effective load cell display systems. Factors such as improved connectivity options (e.g., wireless capabilities for remote monitoring) and enhanced user interfaces are also contributing to market growth. We estimate the market size in 2025 to be approximately $250 million, with a Compound Annual Growth Rate (CAGR) of 7% projected for the period 2025-2033. This growth is expected to be driven by increasing adoption in emerging economies and the development of sophisticated applications in process industries, such as food and beverage and pharmaceuticals, where precise weight control is critical for quality assurance and regulatory compliance.
Load Cell Display Market Size (In Million)
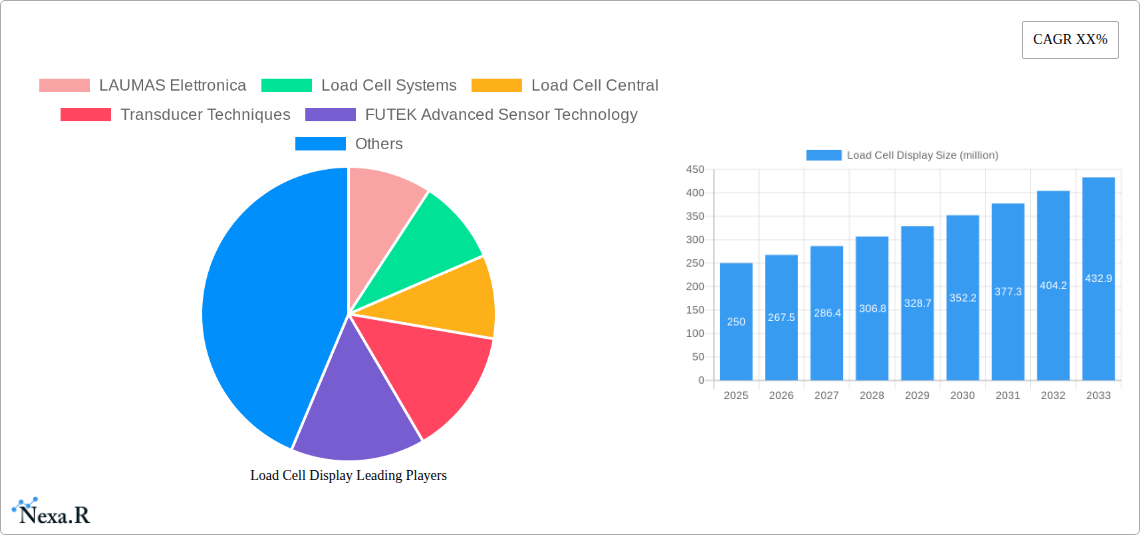
However, the market faces certain restraints. The high initial investment associated with implementing advanced load cell display systems can be a barrier for smaller businesses. Furthermore, the need for regular calibration and maintenance can contribute to operational costs. Competitive pressures from manufacturers offering lower-priced alternatives also pose a challenge. Despite these factors, the long-term outlook remains positive, fueled by the increasing need for precise measurement and automation across diverse applications. Segmentation analysis suggests the industrial sector currently holds the largest market share, followed by the healthcare and logistics sectors. Key players such as LAUMAS Elettronica, Load Cell Systems, and FUTEK are strategically investing in research and development to enhance their product portfolios and expand their market reach.
Load Cell Display Company Market Share
Load Cell Display Market Report: 2019-2033
This comprehensive report provides an in-depth analysis of the global Load Cell Display market, encompassing market dynamics, growth trends, regional segmentation, product landscape, key players, and future outlook. The study period covers 2019-2033, with a base year of 2025 and a forecast period of 2025-2033. This report is crucial for industry professionals, investors, and strategists seeking to understand and capitalize on the opportunities within this dynamic market. The global load cell display market size is estimated to be xx million units in 2025.
Load Cell Display Market Dynamics & Structure
The load cell display market is characterized by a moderately concentrated landscape, with key players like LAUMAS Elettronica, Load Cell Systems, and FUTEK Advanced Sensor Technology holding significant market share (estimated at xx% combined in 2025). Technological innovation, driven by advancements in digital signal processing and wireless communication, is a primary growth driver. Stringent regulatory frameworks concerning safety and accuracy also shape market dynamics. The market faces competition from alternative measurement technologies but enjoys strong demand due to its accuracy and ease of use across various applications.
- Market Concentration: Moderately concentrated, with top 5 players holding xx% market share in 2025.
- Technological Innovation: Advancements in digital signal processing, wireless connectivity, and miniaturization are key drivers.
- Regulatory Frameworks: Compliance with safety and accuracy standards influences product development and adoption.
- Competitive Substitutes: Alternative measurement technologies pose a moderate threat.
- End-User Demographics: Diverse, spanning various industries including manufacturing, logistics, and healthcare.
- M&A Trends: A moderate number of mergers and acquisitions (xx deals estimated between 2019-2024) indicate consolidation within the market.
Load Cell Display Growth Trends & Insights
The global load cell display market exhibited robust growth during the historical period (2019-2024), registering a CAGR of xx%. This growth is attributed to increasing automation across various industries, rising demand for precision measurement, and the adoption of advanced technologies. The market is projected to maintain a healthy growth trajectory during the forecast period (2025-2033), with an estimated CAGR of xx%, driven by factors such as expanding industrial automation and increasing investment in infrastructure projects globally. Market penetration is expected to reach xx% by 2033. Technological disruptions, such as the integration of IoT capabilities into load cell displays, are further fueling growth. Shifts in consumer behavior towards data-driven decision-making are also bolstering market demand.
Dominant Regions, Countries, or Segments in Load Cell Display
North America currently holds the leading position in the load cell display market, driven by robust industrial activity, technological advancements, and strong regulatory support. However, Asia-Pacific is projected to witness the fastest growth rate during the forecast period, fueled by rapid industrialization, rising infrastructure spending, and expanding manufacturing sectors in countries like China and India.
- North America: Strong industrial base, high technological adoption, and favorable regulatory environment.
- Europe: Stable growth, driven by industrial automation and stringent quality standards.
- Asia-Pacific: Highest growth potential, fueled by rapid industrialization and infrastructure development.
Load Cell Display Product Landscape
The load cell display market offers a range of products, from basic analog displays to sophisticated digital displays with advanced features like data logging, remote monitoring, and connectivity options. Innovations focus on improved accuracy, enhanced durability, and user-friendly interfaces. Unique selling propositions include wireless connectivity, customizable displays, and integration with industrial automation systems. Technological advancements center around miniaturization, increased processing power, and improved communication protocols.
Key Drivers, Barriers & Challenges in Load Cell Display
Key Drivers: Increasing automation in various industries, stringent quality control requirements, demand for precise measurement in diverse applications, and technological advancements driving accuracy and usability.
Key Challenges: Supply chain disruptions due to global events can impact production and pricing (estimated xx% impact on production in 2022). Regulatory compliance requirements across different regions create complexity and cost. Intense competition from established and emerging players necessitates continuous innovation and product differentiation.
Emerging Opportunities in Load Cell Display
The integration of load cell displays with IoT platforms presents significant growth opportunities, enabling remote monitoring, predictive maintenance, and data-driven optimization. Expansion into untapped markets, such as renewable energy and smart agriculture, holds immense potential. Growing demand for customized and specialized load cell displays for niche applications creates further opportunities.
Growth Accelerators in the Load Cell Display Industry
Technological breakthroughs, particularly in sensor technology and wireless communication, are driving market growth. Strategic partnerships between load cell manufacturers and automation solution providers are expanding market reach. Expansion into new applications and geographical regions is further accelerating market growth.
Key Players Shaping the Load Cell Display Market
- LAUMAS Elettronica
- Load Cell Systems
- Load Cell Central
- Transducer Techniques
- FUTEK Advanced Sensor Technology, Inc
- Loadstar Sensors
- ADI Artech Transducers Pvt
- Tractel
- Forsentek Co., Limited
- Tacuna Systems
- Changsha SUPMETER Technological Co
- Applied Measurements
Notable Milestones in Load Cell Display Sector
- 2020: Launch of a new wireless load cell display with enhanced accuracy by FUTEK.
- 2022: Acquisition of a smaller load cell manufacturer by LAUMAS Elettronica, expanding its market reach.
- 2023: Introduction of a new generation of digital load cell displays with improved data logging capabilities by Load Cell Systems.
In-Depth Load Cell Display Market Outlook
The load cell display market is poised for continued growth, driven by sustained demand from key industries and technological advancements. Opportunities lie in developing innovative products that cater to evolving market needs, expanding into emerging markets, and forging strategic partnerships to broaden market penetration. The focus on data-driven decision-making and Industry 4.0 initiatives will further fuel market expansion in the coming years.
Load Cell Display Segmentation
-
1. Application
- 1.1. Industrial
- 1.2. Laboratory
- 1.3. Other
-
2. Types
- 2.1. Portable
- 2.2. Panel Mount
- 2.3. Other
Load Cell Display Segmentation By Geography
-
1. North America
- 1.1. United States
- 1.2. Canada
- 1.3. Mexico
-
2. South America
- 2.1. Brazil
- 2.2. Argentina
- 2.3. Rest of South America
-
3. Europe
- 3.1. United Kingdom
- 3.2. Germany
- 3.3. France
- 3.4. Italy
- 3.5. Spain
- 3.6. Russia
- 3.7. Benelux
- 3.8. Nordics
- 3.9. Rest of Europe
-
4. Middle East & Africa
- 4.1. Turkey
- 4.2. Israel
- 4.3. GCC
- 4.4. North Africa
- 4.5. South Africa
- 4.6. Rest of Middle East & Africa
-
5. Asia Pacific
- 5.1. China
- 5.2. India
- 5.3. Japan
- 5.4. South Korea
- 5.5. ASEAN
- 5.6. Oceania
- 5.7. Rest of Asia Pacific

Load Cell Display Regional Market Share
Geographic Coverage of Load Cell Display
Load Cell Display REPORT HIGHLIGHTS
| Aspects | Details |
|---|---|
| Study Period | 2020-2034 |
| Base Year | 2025 |
| Estimated Year | 2026 |
| Forecast Period | 2026-2034 |
| Historical Period | 2020-2025 |
| Growth Rate | CAGR of 7% from 2020-2034 |
| Segmentation |
|
Table of Contents
- 1. Introduction
- 1.1. Research Scope
- 1.2. Market Segmentation
- 1.3. Research Methodology
- 1.4. Definitions and Assumptions
- 2. Executive Summary
- 2.1. Introduction
- 3. Market Dynamics
- 3.1. Introduction
- 3.2. Market Drivers
- 3.3. Market Restrains
- 3.4. Market Trends
- 4. Market Factor Analysis
- 4.1. Porters Five Forces
- 4.2. Supply/Value Chain
- 4.3. PESTEL analysis
- 4.4. Market Entropy
- 4.5. Patent/Trademark Analysis
- 5. Global Load Cell Display Analysis, Insights and Forecast, 2020-2032
- 5.1. Market Analysis, Insights and Forecast - by Application
- 5.1.1. Industrial
- 5.1.2. Laboratory
- 5.1.3. Other
- 5.2. Market Analysis, Insights and Forecast - by Types
- 5.2.1. Portable
- 5.2.2. Panel Mount
- 5.2.3. Other
- 5.3. Market Analysis, Insights and Forecast - by Region
- 5.3.1. North America
- 5.3.2. South America
- 5.3.3. Europe
- 5.3.4. Middle East & Africa
- 5.3.5. Asia Pacific
- 5.1. Market Analysis, Insights and Forecast - by Application
- 6. North America Load Cell Display Analysis, Insights and Forecast, 2020-2032
- 6.1. Market Analysis, Insights and Forecast - by Application
- 6.1.1. Industrial
- 6.1.2. Laboratory
- 6.1.3. Other
- 6.2. Market Analysis, Insights and Forecast - by Types
- 6.2.1. Portable
- 6.2.2. Panel Mount
- 6.2.3. Other
- 6.1. Market Analysis, Insights and Forecast - by Application
- 7. South America Load Cell Display Analysis, Insights and Forecast, 2020-2032
- 7.1. Market Analysis, Insights and Forecast - by Application
- 7.1.1. Industrial
- 7.1.2. Laboratory
- 7.1.3. Other
- 7.2. Market Analysis, Insights and Forecast - by Types
- 7.2.1. Portable
- 7.2.2. Panel Mount
- 7.2.3. Other
- 7.1. Market Analysis, Insights and Forecast - by Application
- 8. Europe Load Cell Display Analysis, Insights and Forecast, 2020-2032
- 8.1. Market Analysis, Insights and Forecast - by Application
- 8.1.1. Industrial
- 8.1.2. Laboratory
- 8.1.3. Other
- 8.2. Market Analysis, Insights and Forecast - by Types
- 8.2.1. Portable
- 8.2.2. Panel Mount
- 8.2.3. Other
- 8.1. Market Analysis, Insights and Forecast - by Application
- 9. Middle East & Africa Load Cell Display Analysis, Insights and Forecast, 2020-2032
- 9.1. Market Analysis, Insights and Forecast - by Application
- 9.1.1. Industrial
- 9.1.2. Laboratory
- 9.1.3. Other
- 9.2. Market Analysis, Insights and Forecast - by Types
- 9.2.1. Portable
- 9.2.2. Panel Mount
- 9.2.3. Other
- 9.1. Market Analysis, Insights and Forecast - by Application
- 10. Asia Pacific Load Cell Display Analysis, Insights and Forecast, 2020-2032
- 10.1. Market Analysis, Insights and Forecast - by Application
- 10.1.1. Industrial
- 10.1.2. Laboratory
- 10.1.3. Other
- 10.2. Market Analysis, Insights and Forecast - by Types
- 10.2.1. Portable
- 10.2.2. Panel Mount
- 10.2.3. Other
- 10.1. Market Analysis, Insights and Forecast - by Application
- 11. Competitive Analysis
- 11.1. Global Market Share Analysis 2025
- 11.2. Company Profiles
- 11.2.1 LAUMAS Elettronica
- 11.2.1.1. Overview
- 11.2.1.2. Products
- 11.2.1.3. SWOT Analysis
- 11.2.1.4. Recent Developments
- 11.2.1.5. Financials (Based on Availability)
- 11.2.2 Load Cell Systems
- 11.2.2.1. Overview
- 11.2.2.2. Products
- 11.2.2.3. SWOT Analysis
- 11.2.2.4. Recent Developments
- 11.2.2.5. Financials (Based on Availability)
- 11.2.3 Load Cell Central
- 11.2.3.1. Overview
- 11.2.3.2. Products
- 11.2.3.3. SWOT Analysis
- 11.2.3.4. Recent Developments
- 11.2.3.5. Financials (Based on Availability)
- 11.2.4 Transducer Techniques
- 11.2.4.1. Overview
- 11.2.4.2. Products
- 11.2.4.3. SWOT Analysis
- 11.2.4.4. Recent Developments
- 11.2.4.5. Financials (Based on Availability)
- 11.2.5 FUTEK Advanced Sensor Technology
- 11.2.5.1. Overview
- 11.2.5.2. Products
- 11.2.5.3. SWOT Analysis
- 11.2.5.4. Recent Developments
- 11.2.5.5. Financials (Based on Availability)
- 11.2.6 Inc
- 11.2.6.1. Overview
- 11.2.6.2. Products
- 11.2.6.3. SWOT Analysis
- 11.2.6.4. Recent Developments
- 11.2.6.5. Financials (Based on Availability)
- 11.2.7 Loadstar Sensors
- 11.2.7.1. Overview
- 11.2.7.2. Products
- 11.2.7.3. SWOT Analysis
- 11.2.7.4. Recent Developments
- 11.2.7.5. Financials (Based on Availability)
- 11.2.8 ADI Artech Transducers Pvt
- 11.2.8.1. Overview
- 11.2.8.2. Products
- 11.2.8.3. SWOT Analysis
- 11.2.8.4. Recent Developments
- 11.2.8.5. Financials (Based on Availability)
- 11.2.9 Tractel
- 11.2.9.1. Overview
- 11.2.9.2. Products
- 11.2.9.3. SWOT Analysis
- 11.2.9.4. Recent Developments
- 11.2.9.5. Financials (Based on Availability)
- 11.2.10 Forsentek Co.
- 11.2.10.1. Overview
- 11.2.10.2. Products
- 11.2.10.3. SWOT Analysis
- 11.2.10.4. Recent Developments
- 11.2.10.5. Financials (Based on Availability)
- 11.2.11 Limited
- 11.2.11.1. Overview
- 11.2.11.2. Products
- 11.2.11.3. SWOT Analysis
- 11.2.11.4. Recent Developments
- 11.2.11.5. Financials (Based on Availability)
- 11.2.12 Tacuna Systems
- 11.2.12.1. Overview
- 11.2.12.2. Products
- 11.2.12.3. SWOT Analysis
- 11.2.12.4. Recent Developments
- 11.2.12.5. Financials (Based on Availability)
- 11.2.13 Changsha SUPMETER Technological Co
- 11.2.13.1. Overview
- 11.2.13.2. Products
- 11.2.13.3. SWOT Analysis
- 11.2.13.4. Recent Developments
- 11.2.13.5. Financials (Based on Availability)
- 11.2.14 Applied Measurements
- 11.2.14.1. Overview
- 11.2.14.2. Products
- 11.2.14.3. SWOT Analysis
- 11.2.14.4. Recent Developments
- 11.2.14.5. Financials (Based on Availability)
- 11.2.1 LAUMAS Elettronica
List of Figures
- Figure 1: Global Load Cell Display Revenue Breakdown (undefined, %) by Region 2025 & 2033
- Figure 2: Global Load Cell Display Volume Breakdown (K, %) by Region 2025 & 2033
- Figure 3: North America Load Cell Display Revenue (undefined), by Application 2025 & 2033
- Figure 4: North America Load Cell Display Volume (K), by Application 2025 & 2033
- Figure 5: North America Load Cell Display Revenue Share (%), by Application 2025 & 2033
- Figure 6: North America Load Cell Display Volume Share (%), by Application 2025 & 2033
- Figure 7: North America Load Cell Display Revenue (undefined), by Types 2025 & 2033
- Figure 8: North America Load Cell Display Volume (K), by Types 2025 & 2033
- Figure 9: North America Load Cell Display Revenue Share (%), by Types 2025 & 2033
- Figure 10: North America Load Cell Display Volume Share (%), by Types 2025 & 2033
- Figure 11: North America Load Cell Display Revenue (undefined), by Country 2025 & 2033
- Figure 12: North America Load Cell Display Volume (K), by Country 2025 & 2033
- Figure 13: North America Load Cell Display Revenue Share (%), by Country 2025 & 2033
- Figure 14: North America Load Cell Display Volume Share (%), by Country 2025 & 2033
- Figure 15: South America Load Cell Display Revenue (undefined), by Application 2025 & 2033
- Figure 16: South America Load Cell Display Volume (K), by Application 2025 & 2033
- Figure 17: South America Load Cell Display Revenue Share (%), by Application 2025 & 2033
- Figure 18: South America Load Cell Display Volume Share (%), by Application 2025 & 2033
- Figure 19: South America Load Cell Display Revenue (undefined), by Types 2025 & 2033
- Figure 20: South America Load Cell Display Volume (K), by Types 2025 & 2033
- Figure 21: South America Load Cell Display Revenue Share (%), by Types 2025 & 2033
- Figure 22: South America Load Cell Display Volume Share (%), by Types 2025 & 2033
- Figure 23: South America Load Cell Display Revenue (undefined), by Country 2025 & 2033
- Figure 24: South America Load Cell Display Volume (K), by Country 2025 & 2033
- Figure 25: South America Load Cell Display Revenue Share (%), by Country 2025 & 2033
- Figure 26: South America Load Cell Display Volume Share (%), by Country 2025 & 2033
- Figure 27: Europe Load Cell Display Revenue (undefined), by Application 2025 & 2033
- Figure 28: Europe Load Cell Display Volume (K), by Application 2025 & 2033
- Figure 29: Europe Load Cell Display Revenue Share (%), by Application 2025 & 2033
- Figure 30: Europe Load Cell Display Volume Share (%), by Application 2025 & 2033
- Figure 31: Europe Load Cell Display Revenue (undefined), by Types 2025 & 2033
- Figure 32: Europe Load Cell Display Volume (K), by Types 2025 & 2033
- Figure 33: Europe Load Cell Display Revenue Share (%), by Types 2025 & 2033
- Figure 34: Europe Load Cell Display Volume Share (%), by Types 2025 & 2033
- Figure 35: Europe Load Cell Display Revenue (undefined), by Country 2025 & 2033
- Figure 36: Europe Load Cell Display Volume (K), by Country 2025 & 2033
- Figure 37: Europe Load Cell Display Revenue Share (%), by Country 2025 & 2033
- Figure 38: Europe Load Cell Display Volume Share (%), by Country 2025 & 2033
- Figure 39: Middle East & Africa Load Cell Display Revenue (undefined), by Application 2025 & 2033
- Figure 40: Middle East & Africa Load Cell Display Volume (K), by Application 2025 & 2033
- Figure 41: Middle East & Africa Load Cell Display Revenue Share (%), by Application 2025 & 2033
- Figure 42: Middle East & Africa Load Cell Display Volume Share (%), by Application 2025 & 2033
- Figure 43: Middle East & Africa Load Cell Display Revenue (undefined), by Types 2025 & 2033
- Figure 44: Middle East & Africa Load Cell Display Volume (K), by Types 2025 & 2033
- Figure 45: Middle East & Africa Load Cell Display Revenue Share (%), by Types 2025 & 2033
- Figure 46: Middle East & Africa Load Cell Display Volume Share (%), by Types 2025 & 2033
- Figure 47: Middle East & Africa Load Cell Display Revenue (undefined), by Country 2025 & 2033
- Figure 48: Middle East & Africa Load Cell Display Volume (K), by Country 2025 & 2033
- Figure 49: Middle East & Africa Load Cell Display Revenue Share (%), by Country 2025 & 2033
- Figure 50: Middle East & Africa Load Cell Display Volume Share (%), by Country 2025 & 2033
- Figure 51: Asia Pacific Load Cell Display Revenue (undefined), by Application 2025 & 2033
- Figure 52: Asia Pacific Load Cell Display Volume (K), by Application 2025 & 2033
- Figure 53: Asia Pacific Load Cell Display Revenue Share (%), by Application 2025 & 2033
- Figure 54: Asia Pacific Load Cell Display Volume Share (%), by Application 2025 & 2033
- Figure 55: Asia Pacific Load Cell Display Revenue (undefined), by Types 2025 & 2033
- Figure 56: Asia Pacific Load Cell Display Volume (K), by Types 2025 & 2033
- Figure 57: Asia Pacific Load Cell Display Revenue Share (%), by Types 2025 & 2033
- Figure 58: Asia Pacific Load Cell Display Volume Share (%), by Types 2025 & 2033
- Figure 59: Asia Pacific Load Cell Display Revenue (undefined), by Country 2025 & 2033
- Figure 60: Asia Pacific Load Cell Display Volume (K), by Country 2025 & 2033
- Figure 61: Asia Pacific Load Cell Display Revenue Share (%), by Country 2025 & 2033
- Figure 62: Asia Pacific Load Cell Display Volume Share (%), by Country 2025 & 2033
List of Tables
- Table 1: Global Load Cell Display Revenue undefined Forecast, by Application 2020 & 2033
- Table 2: Global Load Cell Display Volume K Forecast, by Application 2020 & 2033
- Table 3: Global Load Cell Display Revenue undefined Forecast, by Types 2020 & 2033
- Table 4: Global Load Cell Display Volume K Forecast, by Types 2020 & 2033
- Table 5: Global Load Cell Display Revenue undefined Forecast, by Region 2020 & 2033
- Table 6: Global Load Cell Display Volume K Forecast, by Region 2020 & 2033
- Table 7: Global Load Cell Display Revenue undefined Forecast, by Application 2020 & 2033
- Table 8: Global Load Cell Display Volume K Forecast, by Application 2020 & 2033
- Table 9: Global Load Cell Display Revenue undefined Forecast, by Types 2020 & 2033
- Table 10: Global Load Cell Display Volume K Forecast, by Types 2020 & 2033
- Table 11: Global Load Cell Display Revenue undefined Forecast, by Country 2020 & 2033
- Table 12: Global Load Cell Display Volume K Forecast, by Country 2020 & 2033
- Table 13: United States Load Cell Display Revenue (undefined) Forecast, by Application 2020 & 2033
- Table 14: United States Load Cell Display Volume (K) Forecast, by Application 2020 & 2033
- Table 15: Canada Load Cell Display Revenue (undefined) Forecast, by Application 2020 & 2033
- Table 16: Canada Load Cell Display Volume (K) Forecast, by Application 2020 & 2033
- Table 17: Mexico Load Cell Display Revenue (undefined) Forecast, by Application 2020 & 2033
- Table 18: Mexico Load Cell Display Volume (K) Forecast, by Application 2020 & 2033
- Table 19: Global Load Cell Display Revenue undefined Forecast, by Application 2020 & 2033
- Table 20: Global Load Cell Display Volume K Forecast, by Application 2020 & 2033
- Table 21: Global Load Cell Display Revenue undefined Forecast, by Types 2020 & 2033
- Table 22: Global Load Cell Display Volume K Forecast, by Types 2020 & 2033
- Table 23: Global Load Cell Display Revenue undefined Forecast, by Country 2020 & 2033
- Table 24: Global Load Cell Display Volume K Forecast, by Country 2020 & 2033
- Table 25: Brazil Load Cell Display Revenue (undefined) Forecast, by Application 2020 & 2033
- Table 26: Brazil Load Cell Display Volume (K) Forecast, by Application 2020 & 2033
- Table 27: Argentina Load Cell Display Revenue (undefined) Forecast, by Application 2020 & 2033
- Table 28: Argentina Load Cell Display Volume (K) Forecast, by Application 2020 & 2033
- Table 29: Rest of South America Load Cell Display Revenue (undefined) Forecast, by Application 2020 & 2033
- Table 30: Rest of South America Load Cell Display Volume (K) Forecast, by Application 2020 & 2033
- Table 31: Global Load Cell Display Revenue undefined Forecast, by Application 2020 & 2033
- Table 32: Global Load Cell Display Volume K Forecast, by Application 2020 & 2033
- Table 33: Global Load Cell Display Revenue undefined Forecast, by Types 2020 & 2033
- Table 34: Global Load Cell Display Volume K Forecast, by Types 2020 & 2033
- Table 35: Global Load Cell Display Revenue undefined Forecast, by Country 2020 & 2033
- Table 36: Global Load Cell Display Volume K Forecast, by Country 2020 & 2033
- Table 37: United Kingdom Load Cell Display Revenue (undefined) Forecast, by Application 2020 & 2033
- Table 38: United Kingdom Load Cell Display Volume (K) Forecast, by Application 2020 & 2033
- Table 39: Germany Load Cell Display Revenue (undefined) Forecast, by Application 2020 & 2033
- Table 40: Germany Load Cell Display Volume (K) Forecast, by Application 2020 & 2033
- Table 41: France Load Cell Display Revenue (undefined) Forecast, by Application 2020 & 2033
- Table 42: France Load Cell Display Volume (K) Forecast, by Application 2020 & 2033
- Table 43: Italy Load Cell Display Revenue (undefined) Forecast, by Application 2020 & 2033
- Table 44: Italy Load Cell Display Volume (K) Forecast, by Application 2020 & 2033
- Table 45: Spain Load Cell Display Revenue (undefined) Forecast, by Application 2020 & 2033
- Table 46: Spain Load Cell Display Volume (K) Forecast, by Application 2020 & 2033
- Table 47: Russia Load Cell Display Revenue (undefined) Forecast, by Application 2020 & 2033
- Table 48: Russia Load Cell Display Volume (K) Forecast, by Application 2020 & 2033
- Table 49: Benelux Load Cell Display Revenue (undefined) Forecast, by Application 2020 & 2033
- Table 50: Benelux Load Cell Display Volume (K) Forecast, by Application 2020 & 2033
- Table 51: Nordics Load Cell Display Revenue (undefined) Forecast, by Application 2020 & 2033
- Table 52: Nordics Load Cell Display Volume (K) Forecast, by Application 2020 & 2033
- Table 53: Rest of Europe Load Cell Display Revenue (undefined) Forecast, by Application 2020 & 2033
- Table 54: Rest of Europe Load Cell Display Volume (K) Forecast, by Application 2020 & 2033
- Table 55: Global Load Cell Display Revenue undefined Forecast, by Application 2020 & 2033
- Table 56: Global Load Cell Display Volume K Forecast, by Application 2020 & 2033
- Table 57: Global Load Cell Display Revenue undefined Forecast, by Types 2020 & 2033
- Table 58: Global Load Cell Display Volume K Forecast, by Types 2020 & 2033
- Table 59: Global Load Cell Display Revenue undefined Forecast, by Country 2020 & 2033
- Table 60: Global Load Cell Display Volume K Forecast, by Country 2020 & 2033
- Table 61: Turkey Load Cell Display Revenue (undefined) Forecast, by Application 2020 & 2033
- Table 62: Turkey Load Cell Display Volume (K) Forecast, by Application 2020 & 2033
- Table 63: Israel Load Cell Display Revenue (undefined) Forecast, by Application 2020 & 2033
- Table 64: Israel Load Cell Display Volume (K) Forecast, by Application 2020 & 2033
- Table 65: GCC Load Cell Display Revenue (undefined) Forecast, by Application 2020 & 2033
- Table 66: GCC Load Cell Display Volume (K) Forecast, by Application 2020 & 2033
- Table 67: North Africa Load Cell Display Revenue (undefined) Forecast, by Application 2020 & 2033
- Table 68: North Africa Load Cell Display Volume (K) Forecast, by Application 2020 & 2033
- Table 69: South Africa Load Cell Display Revenue (undefined) Forecast, by Application 2020 & 2033
- Table 70: South Africa Load Cell Display Volume (K) Forecast, by Application 2020 & 2033
- Table 71: Rest of Middle East & Africa Load Cell Display Revenue (undefined) Forecast, by Application 2020 & 2033
- Table 72: Rest of Middle East & Africa Load Cell Display Volume (K) Forecast, by Application 2020 & 2033
- Table 73: Global Load Cell Display Revenue undefined Forecast, by Application 2020 & 2033
- Table 74: Global Load Cell Display Volume K Forecast, by Application 2020 & 2033
- Table 75: Global Load Cell Display Revenue undefined Forecast, by Types 2020 & 2033
- Table 76: Global Load Cell Display Volume K Forecast, by Types 2020 & 2033
- Table 77: Global Load Cell Display Revenue undefined Forecast, by Country 2020 & 2033
- Table 78: Global Load Cell Display Volume K Forecast, by Country 2020 & 2033
- Table 79: China Load Cell Display Revenue (undefined) Forecast, by Application 2020 & 2033
- Table 80: China Load Cell Display Volume (K) Forecast, by Application 2020 & 2033
- Table 81: India Load Cell Display Revenue (undefined) Forecast, by Application 2020 & 2033
- Table 82: India Load Cell Display Volume (K) Forecast, by Application 2020 & 2033
- Table 83: Japan Load Cell Display Revenue (undefined) Forecast, by Application 2020 & 2033
- Table 84: Japan Load Cell Display Volume (K) Forecast, by Application 2020 & 2033
- Table 85: South Korea Load Cell Display Revenue (undefined) Forecast, by Application 2020 & 2033
- Table 86: South Korea Load Cell Display Volume (K) Forecast, by Application 2020 & 2033
- Table 87: ASEAN Load Cell Display Revenue (undefined) Forecast, by Application 2020 & 2033
- Table 88: ASEAN Load Cell Display Volume (K) Forecast, by Application 2020 & 2033
- Table 89: Oceania Load Cell Display Revenue (undefined) Forecast, by Application 2020 & 2033
- Table 90: Oceania Load Cell Display Volume (K) Forecast, by Application 2020 & 2033
- Table 91: Rest of Asia Pacific Load Cell Display Revenue (undefined) Forecast, by Application 2020 & 2033
- Table 92: Rest of Asia Pacific Load Cell Display Volume (K) Forecast, by Application 2020 & 2033
Frequently Asked Questions
1. What is the projected Compound Annual Growth Rate (CAGR) of the Load Cell Display?
The projected CAGR is approximately 7%.
2. Which companies are prominent players in the Load Cell Display?
Key companies in the market include LAUMAS Elettronica, Load Cell Systems, Load Cell Central, Transducer Techniques, FUTEK Advanced Sensor Technology, Inc, Loadstar Sensors, ADI Artech Transducers Pvt, Tractel, Forsentek Co., Limited, Tacuna Systems, Changsha SUPMETER Technological Co, Applied Measurements.
3. What are the main segments of the Load Cell Display?
The market segments include Application, Types.
4. Can you provide details about the market size?
The market size is estimated to be USD XXX N/A as of 2022.
5. What are some drivers contributing to market growth?
N/A
6. What are the notable trends driving market growth?
N/A
7. Are there any restraints impacting market growth?
N/A
8. Can you provide examples of recent developments in the market?
N/A
9. What pricing options are available for accessing the report?
Pricing options include single-user, multi-user, and enterprise licenses priced at USD 3950.00, USD 5925.00, and USD 7900.00 respectively.
10. Is the market size provided in terms of value or volume?
The market size is provided in terms of value, measured in N/A and volume, measured in K.
11. Are there any specific market keywords associated with the report?
Yes, the market keyword associated with the report is "Load Cell Display," which aids in identifying and referencing the specific market segment covered.
12. How do I determine which pricing option suits my needs best?
The pricing options vary based on user requirements and access needs. Individual users may opt for single-user licenses, while businesses requiring broader access may choose multi-user or enterprise licenses for cost-effective access to the report.
13. Are there any additional resources or data provided in the Load Cell Display report?
While the report offers comprehensive insights, it's advisable to review the specific contents or supplementary materials provided to ascertain if additional resources or data are available.
14. How can I stay updated on further developments or reports in the Load Cell Display?
To stay informed about further developments, trends, and reports in the Load Cell Display, consider subscribing to industry newsletters, following relevant companies and organizations, or regularly checking reputable industry news sources and publications.
Methodology
Step 1 - Identification of Relevant Samples Size from Population Database


Step 2 - Approaches for Defining Global Market Size (Value, Volume* & Price*)

Note*: In applicable scenarios
Step 3 - Data Sources
Primary Research
- Web Analytics
- Survey Reports
- Research Institute
- Latest Research Reports
- Opinion Leaders
Secondary Research
- Annual Reports
- White Paper
- Latest Press Release
- Industry Association
- Paid Database
- Investor Presentations

Step 4 - Data Triangulation
Involves using different sources of information in order to increase the validity of a study
These sources are likely to be stakeholders in a program - participants, other researchers, program staff, other community members, and so on.
Then we put all data in single framework & apply various statistical tools to find out the dynamic on the market.
During the analysis stage, feedback from the stakeholder groups would be compared to determine areas of agreement as well as areas of divergence