

Key Insights
The Middle East & Africa (MEA) gluten-free food market is projected for significant expansion, expected to reach $8.5 billion by 2025, with a robust CAGR of 10.2% through 2033. This growth is driven by rising health consciousness, increased prevalence of celiac disease and gluten sensitivities, and a growing demand for healthier food alternatives across the region. Consumers are increasingly choosing gluten-free options for medical necessity and as a lifestyle choice for enhanced well-being. This dietary shift fuels innovation and product accessibility, making gluten-free options more appealing to a wider audience. Additionally, rising disposable incomes in key MEA economies enable greater consumer spending on specialized dietary foods, further supporting market growth.
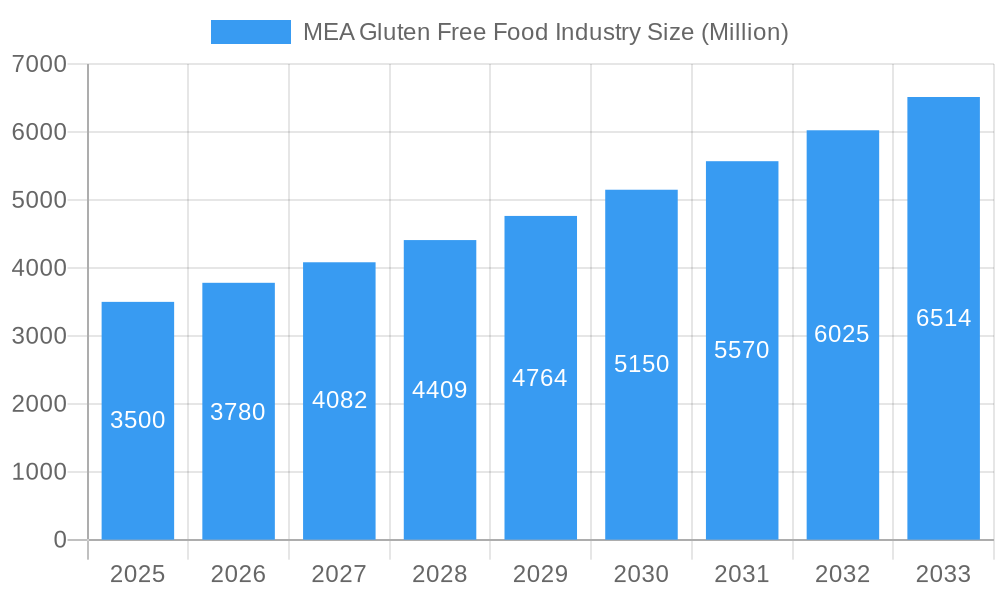
MEA Gluten Free Food Industry Market Size (In Billion)
The MEA gluten-free food market is defined by dynamic trends and evolving consumer behavior. Key growth factors include increased awareness and diagnosis of gluten-related disorders, alongside proactive adoption of healthier lifestyles. The expanding bakery, confectionery, and snack segments, along with growing demand for dairy-free alternatives, significantly contribute to market expansion. Distribution channels are diversifying, with a notable shift towards online retail for enhanced consumer convenience and product access. While the market shows strong growth potential, challenges such as higher product pricing and limited awareness in some developing MEA regions require attention. Nevertheless, the region's diverse consumer base and expanding food industry infrastructure offer substantial opportunities for market players to capitalize on this burgeoning demand.
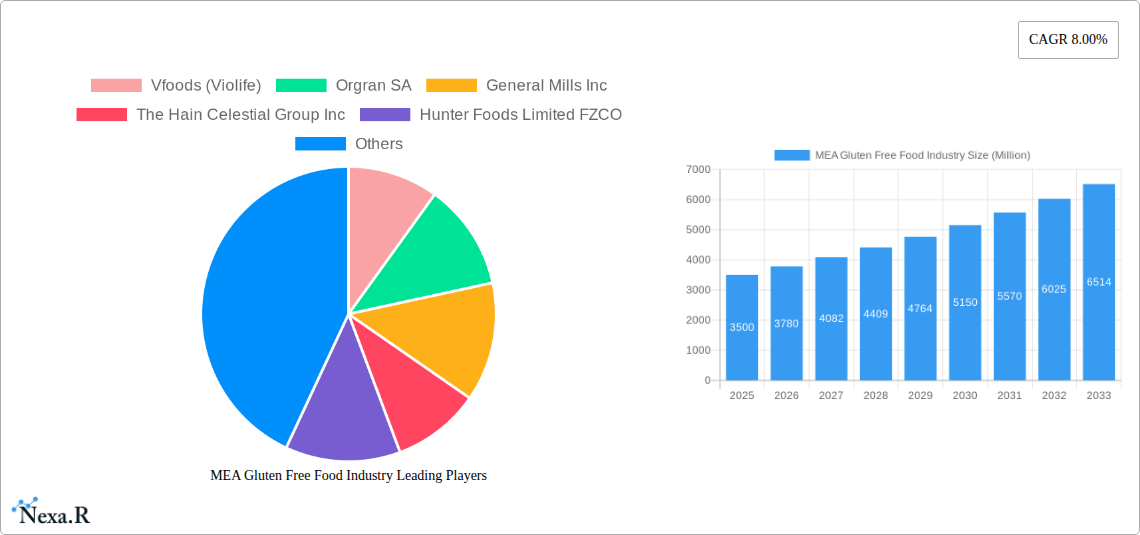
MEA Gluten Free Food Industry Company Market Share
MEA Gluten Free Food Industry Market Dynamics & Structure
The MEA Gluten Free Food Industry is experiencing dynamic shifts driven by increasing health consciousness and the growing prevalence of celiac disease and gluten sensitivities across the region. Market concentration is moderately fragmented, with established global players coexisting alongside regional manufacturers. Technological innovation is primarily focused on enhancing taste, texture, and shelf-life of gluten-free alternatives to mimic conventional products. Regulatory frameworks are evolving to accommodate specialized dietary needs, although consistency across the vast MEA region remains a challenge. Competitive product substitutes, including naturally gluten-free staples like rice and corn, pose a continuous threat. End-user demographics are shifting towards a younger, more informed consumer base actively seeking healthier food options. Mergers and acquisitions (M&A) activity, while not yet at peak levels, is anticipated to increase as larger corporations seek to expand their footprint in this burgeoning market.
- Market Concentration: Moderately fragmented, with significant presence of both global and local players.
- Technological Innovation: Focus on improving palatability, texture, and extending shelf life of gluten-free products.
- Regulatory Frameworks: Evolving to support specialized dietary needs, with ongoing efforts for standardization.
- Competitive Substitutes: Naturally gluten-free grains (rice, corn) and other dietary approaches.
- End-User Demographics: Growing segment of health-conscious millennials and Gen Z, and individuals with diagnosed gluten-related disorders.
- M&A Trends: Expected to rise as companies seek market expansion and portfolio diversification.
MEA Gluten Free Food Industry Growth Trends & Insights
The MEA Gluten Free Food Industry is on an upward trajectory, driven by a confluence of factors including rising disposable incomes, increased awareness of health and wellness, and a growing diagnosis rate of celiac disease and gluten intolerance. This burgeoning market is projected to witness a Compound Annual Growth Rate (CAGR) of approximately XX% during the forecast period of 2025–2033. The adoption rate of gluten-free products, initially concentrated among those with medical needs, is now expanding to the wider health-conscious consumer base seeking perceived wellness benefits. Technological disruptions are playing a pivotal role, with advancements in ingredient processing and formulation leading to more palatable and diverse gluten-free options that rival traditional counterparts. Consumer behavior shifts are evident, with a greater emphasis on ingredient transparency, clean labels, and the demand for products that cater to multiple dietary restrictions simultaneously, such as gluten-free and dairy-free. The market penetration of gluten-free products, currently at an estimated XX% in the base year of 2025, is anticipated to surge as accessibility and variety improve. The historical period from 2019–2024 laid the groundwork for this expansion, characterized by initial market development and increasing consumer interest. The estimated market size for 2025 stands at $XXX Million units, with projections indicating substantial growth throughout the forecast period. This growth is further fueled by the increasing availability of gluten-free options in mainstream retail channels and a greater understanding of the benefits of a gluten-free diet, even for those without a diagnosed condition. The industry is moving beyond niche offerings to become a significant segment within the broader food market, reflecting a sustained evolution in consumer preferences and dietary trends across the Middle East and Africa.
Dominant Regions, Countries, or Segments in MEA Gluten Free Food Industry
The Bakery and Confectionery segment emerges as the dominant force within the MEA Gluten Free Food Industry, driven by an inherent consumer preference for these staple food categories. This segment is projected to capture a significant market share, estimated at XX% in 2025, with robust growth anticipated throughout the forecast period. The widespread appeal of bread, cakes, cookies, and pastries, even in their gluten-free iterations, makes them a cornerstone of the market. Key drivers for this segment's dominance include the ability of manufacturers to closely replicate the taste and texture of traditional baked goods through innovative flour blends and binding agents. Furthermore, the convenience of ready-to-eat gluten-free bakery items makes them highly attractive to busy consumers.
- Dominant Segment (End Product): Bakery and Confectionery
- Market Share (2025): Approximately XX%
- Growth Potential: High, driven by consumer demand for familiar treats in gluten-free formats.
- Key Drivers:
- Ingredient Innovation: Development of superior gluten-free flour blends and emulsifiers.
- Taste & Texture Replication: Advancements in food technology to mimic traditional products.
- Convenience: Availability of ready-to-eat and easy-to-prepare gluten-free bakery items.
- Cultural Relevance: Integration of gluten-free options into traditional celebratory foods.
In terms of Type, Gluten Free naturally remains the primary driver, accounting for XX% of the market in 2025. However, the burgeoning demand for Dairy Free and Allergen Free options, often overlapping with gluten-free needs, signifies a significant growth opportunity, contributing XX% and XX% respectively in the same year.
Dominant Segment (Type): Gluten Free
- Market Share (2025): Approximately XX%
- Growth Drivers: Core segment catering to celiac disease and gluten sensitivity.
High Growth Segments (Type): Dairy Free & Allergen Free
- Market Share (2025): XX% (Dairy Free), XX% (Allergen Free)
- Growth Drivers: Increasing awareness of multiple dietary restrictions and the desire for holistic wellness.
The Supermarkets/Hypermarkets distribution channel continues to lead, holding an estimated XX% market share in 2025. This dominance is attributed to their wide reach, product variety, and the increasing presence of dedicated gluten-free sections. However, Online Retail Stores are rapidly gaining traction, projected to grow at a CAGR of XX%, driven by convenience and the accessibility of specialized products.
Dominant Distribution Channel: Supermarkets/Hypermarkets
- Market Share (2025): Approximately XX%
- Growth Drivers: Wide reach, product assortment, and dedicated shelf space.
High Growth Distribution Channel: Online Retail Stores
- CAGR (2025–2033): Approximately XX%
- Growth Drivers: Convenience, accessibility to niche products, and competitive pricing.
The United Arab Emirates (UAE) stands out as a dominant country within the MEA region due to its robust economy, progressive healthcare policies, and a population with high disposable incomes and a growing interest in health-conscious lifestyles. The country's advanced retail infrastructure and a significant expatriate population also contribute to the demand for diverse and specialized food products.
- Dominant Country: United Arab Emirates (UAE)
- Market Share (2025): Estimated XX% of the MEA market.
- Dominance Factors: High disposable income, health-conscious population, advanced retail infrastructure, significant expatriate community.
MEA Gluten Free Food Industry Product Landscape
The MEA Gluten Free Food Industry is witnessing a surge in product innovation, with manufacturers focusing on developing a wider array of gluten-free alternatives that match the taste, texture, and nutritional profile of their conventional counterparts. Innovations in ingredient sourcing and processing, such as the use of pseudocereals like quinoa and amaranth, alongside specialized starch blends, are enhancing the appeal of gluten-free bakery items, pasta, and snacks. Applications are diversifying beyond basic staples to include convenience meals, plant-based dairy alternatives, and even premium confectionery, catering to evolving consumer preferences. Performance metrics are being redefined by improved palatability and a reduction in the perceived graininess often associated with early gluten-free products. Unique selling propositions now emphasize clean labels, allergen-free formulations beyond gluten, and functional health benefits, making gluten-free products more attractive to a broader consumer base. Technological advancements are also focusing on extending shelf life naturally and improving the nutritional content through fortification.
Key Drivers, Barriers & Challenges in MEA Gluten Free Food Industry
Key Drivers:
The MEA Gluten Free Food Industry is propelled by a confluence of significant drivers. Rising disposable incomes across key markets enable consumers to invest in premium health-focused food options. The increasing diagnosis rate of celiac disease and gluten intolerance is a primary catalyst, creating a sustained demand for specialized products. Growing health consciousness and the perception of gluten-free as a healthier lifestyle choice, even for individuals without medical conditions, further fuel market expansion. Furthermore, government initiatives promoting healthier food consumption and the expansion of retail infrastructure, particularly supermarkets and online platforms, are enhancing accessibility and driving adoption. Technological advancements in ingredient formulation are also crucial, enabling the creation of gluten-free products that closely mimic conventional tastes and textures.
Barriers & Challenges:
Despite the promising outlook, the MEA Gluten Free Food Industry faces several barriers and challenges. The higher cost of production for gluten-free ingredients and specialized manufacturing processes often translates to premium pricing, which can limit affordability for a significant portion of the population. Limited awareness and understanding of gluten-related disorders and the benefits of a gluten-free diet in certain segments of the population can hinder market penetration. Supply chain complexities across the vast and diverse MEA region can lead to inconsistent availability and higher logistics costs. Regulatory inconsistencies in food labeling and standards across different countries can create hurdles for manufacturers. Finally, competition from naturally gluten-free staples like rice and corn, along with established traditional food options, continues to exert pressure on market share.
Emerging Opportunities in MEA Gluten Free Food Industry
Emerging opportunities in the MEA Gluten Free Food Industry are manifold, stemming from evolving consumer demands and market gaps. There is a significant untapped market for specialized gluten-free products catering to specific dietary needs, such as vegan, keto, and low-FODMAP gluten-free options, reflecting the trend towards personalized nutrition. The growing popularity of health and wellness tourism in the region presents an opportunity to target expatriates and tourists seeking familiar dietary options. Innovative applications in convenience foods, ready-to-eat meals, and frozen gluten-free products are poised for growth as consumers prioritize time-saving solutions. Furthermore, the expansion of e-commerce platforms specifically for health foods and the potential for strategic partnerships with local food influencers and nutritionists can significantly boost consumer engagement and product adoption.
Growth Accelerators in the MEA Gluten Free Food Industry Industry
Several factors are acting as growth accelerators for the MEA Gluten Free Food Industry. Technological breakthroughs in food science, particularly in developing gluten-free flour blends that replicate the sensory properties of wheat flour, are paramount. These advancements make a wider range of products more appealing to mainstream consumers. Strategic partnerships between international gluten-free brands and local distributors or manufacturers are crucial for expanding market reach and navigating regional complexities. Furthermore, market expansion strategies focusing on underserved segments and emerging economies within the MEA region will unlock new growth avenues. Increased investment in consumer education campaigns and product sampling initiatives will also play a vital role in driving adoption and building brand loyalty. The rising trend of label transparency and clean-label products is another significant accelerator, as it resonates with health-conscious consumers seeking trustworthy food options.
Key Players Shaping the MEA Gluten Free Food Industry Market
- Vfoods (Violife)
- Orgran SA
- General Mills Inc
- The Hain Celestial Group Inc
- Hunter Foods Limited FZCO
- Dr Schar AG / SPA
- Danone S A
- Probios S p Aa
Notable Milestones in MEA Gluten Free Food Industry Sector
- 2019: Increased global awareness campaign on celiac disease and gluten sensitivity, leading to initial growth in demand.
- 2020: Expansion of online grocery platforms across MEA, enhancing accessibility of specialized gluten-free products.
- 2021: Introduction of fortified gluten-free bakery items with improved nutritional profiles.
- 2022: Significant investment in R&D by major food manufacturers to develop better-tasting gluten-free alternatives.
- 2023: Growing trend of "free-from" labels, with gluten-free often appearing alongside dairy-free and allergen-free claims.
- 2024: Increased focus on sustainable sourcing and production of gluten-free ingredients.
- 2025 (Estimated): Launch of several new gluten-free product lines targeting children and convenience-seeking adults.
- 2026 (Projected): Potential for strategic acquisitions by larger food conglomerates to expand their gluten-free portfolios in the MEA region.
In-Depth MEA Gluten Free Food Industry Market Outlook
The MEA Gluten Free Food Industry is poised for sustained and robust growth, driven by a dynamic interplay of rising health consciousness, increasing dietary disorder diagnoses, and a continuous stream of product innovations. Growth accelerators such as advancements in food technology leading to superior product taste and texture, coupled with strategic market expansion initiatives, will solidify the industry's trajectory. The increasing adoption of clean-labeling practices and the demand for products catering to multiple dietary restrictions will further propel market penetration. The future outlook emphasizes greater accessibility through expanding retail channels, including e-commerce, and a focus on product diversification to meet the evolving preferences of a broad consumer base. Strategic partnerships and investments in consumer education will be pivotal in realizing the full market potential and cementing the gluten-free category as a mainstream segment within the MEA food landscape.
MEA Gluten Free Food Industry Segmentation
-
1. Type
- 1.1. Gluten Free
- 1.2. Dairy Free
- 1.3. Allergen Free
- 1.4. Other Types
-
2. End Product
- 2.1. Bakery and Confectionery
- 2.2. Dairy Free Foods
- 2.3. Snacks
- 2.4. Beverages
- 2.5. Other End Products
-
3. Distribution Channel
- 3.1. Supermarkets/Hypermarkets
- 3.2. Online Retail Stores
- 3.3. Convenience Stores
- 3.4. Other Distribution Channels
MEA Gluten Free Food Industry Segmentation By Geography
-
1. North America
- 1.1. United States
- 1.2. Canada
- 1.3. Mexico
-
2. South America
- 2.1. Brazil
- 2.2. Argentina
- 2.3. Rest of South America
-
3. Europe
- 3.1. United Kingdom
- 3.2. Germany
- 3.3. France
- 3.4. Italy
- 3.5. Spain
- 3.6. Russia
- 3.7. Benelux
- 3.8. Nordics
- 3.9. Rest of Europe
-
4. Middle East & Africa
- 4.1. Turkey
- 4.2. Israel
- 4.3. GCC
- 4.4. North Africa
- 4.5. South Africa
- 4.6. Rest of Middle East & Africa
-
5. Asia Pacific
- 5.1. China
- 5.2. India
- 5.3. Japan
- 5.4. South Korea
- 5.5. ASEAN
- 5.6. Oceania
- 5.7. Rest of Asia Pacific
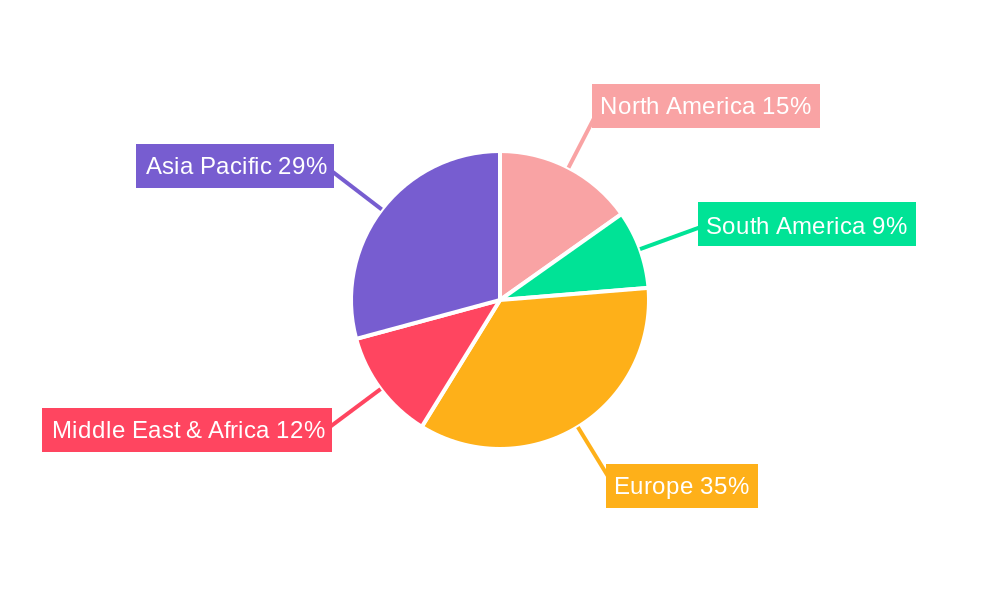
MEA Gluten Free Food Industry Regional Market Share
Geographic Coverage of MEA Gluten Free Food Industry
MEA Gluten Free Food Industry REPORT HIGHLIGHTS
| Aspects | Details |
|---|---|
| Study Period | 2020-2034 |
| Base Year | 2025 |
| Estimated Year | 2026 |
| Forecast Period | 2026-2034 |
| Historical Period | 2020-2025 |
| Growth Rate | CAGR of 10.2% from 2020-2034 |
| Segmentation |
|
Table of Contents
- 1. Introduction
- 1.1. Research Scope
- 1.2. Market Segmentation
- 1.3. Research Objective
- 1.4. Definitions and Assumptions
- 2. Executive Summary
- 2.1. Market Snapshot
- 3. Market Dynamics
- 3.1. Market Drivers
- 3.2. Market Restrains
- 3.3. Market Trends
- 3.4. Market Opportunities
- 4. Market Factor Analysis
- 4.1. Porters Five Forces
- 4.1.1. Bargaining Power of Suppliers
- 4.1.2. Bargaining Power of Buyers
- 4.1.3. Threat of New Entrants
- 4.1.4. Threat of Substitutes
- 4.1.5. Competitive Rivalry
- 4.2. PESTEL analysis
- 4.3. BCG Analysis
- 4.3.1. Stars (High Growth, High Market Share)
- 4.3.2. Cash Cows (Low Growth, High Market Share)
- 4.3.3. Question Mark (High Growth, Low Market Share)
- 4.3.4. Dogs (Low Growth, Low Market Share)
- 4.4. Ansoff Matrix Analysis
- 4.5. Supply Chain Analysis
- 4.6. Regulatory Landscape
- 4.7. Current Market Potential and Opportunity Assessment (TAM–SAM–SOM Framework)
- 4.8. NRP Analyst Note
- 4.1. Porters Five Forces
- 5. Market Analysis, Insights and Forecast 2021-2033
- 5.1. Market Analysis, Insights and Forecast - by Type
- 5.1.1. Gluten Free
- 5.1.2. Dairy Free
- 5.1.3. Allergen Free
- 5.1.4. Other Types
- 5.2. Market Analysis, Insights and Forecast - by End Product
- 5.2.1. Bakery and Confectionery
- 5.2.2. Dairy Free Foods
- 5.2.3. Snacks
- 5.2.4. Beverages
- 5.2.5. Other End Products
- 5.3. Market Analysis, Insights and Forecast - by Distribution Channel
- 5.3.1. Supermarkets/Hypermarkets
- 5.3.2. Online Retail Stores
- 5.3.3. Convenience Stores
- 5.3.4. Other Distribution Channels
- 5.4. Market Analysis, Insights and Forecast - by Region
- 5.4.1. North America
- 5.4.2. South America
- 5.4.3. Europe
- 5.4.4. Middle East & Africa
- 5.4.5. Asia Pacific
- 5.1. Market Analysis, Insights and Forecast - by Type
- 6. Global MEA Gluten Free Food Industry Analysis, Insights and Forecast, 2021-2033
- 6.1. Market Analysis, Insights and Forecast - by Type
- 6.1.1. Gluten Free
- 6.1.2. Dairy Free
- 6.1.3. Allergen Free
- 6.1.4. Other Types
- 6.2. Market Analysis, Insights and Forecast - by End Product
- 6.2.1. Bakery and Confectionery
- 6.2.2. Dairy Free Foods
- 6.2.3. Snacks
- 6.2.4. Beverages
- 6.2.5. Other End Products
- 6.3. Market Analysis, Insights and Forecast - by Distribution Channel
- 6.3.1. Supermarkets/Hypermarkets
- 6.3.2. Online Retail Stores
- 6.3.3. Convenience Stores
- 6.3.4. Other Distribution Channels
- 6.1. Market Analysis, Insights and Forecast - by Type
- 7. North America MEA Gluten Free Food Industry Analysis, Insights and Forecast, 2020-2032
- 7.1. Market Analysis, Insights and Forecast - by Type
- 7.1.1. Gluten Free
- 7.1.2. Dairy Free
- 7.1.3. Allergen Free
- 7.1.4. Other Types
- 7.2. Market Analysis, Insights and Forecast - by End Product
- 7.2.1. Bakery and Confectionery
- 7.2.2. Dairy Free Foods
- 7.2.3. Snacks
- 7.2.4. Beverages
- 7.2.5. Other End Products
- 7.3. Market Analysis, Insights and Forecast - by Distribution Channel
- 7.3.1. Supermarkets/Hypermarkets
- 7.3.2. Online Retail Stores
- 7.3.3. Convenience Stores
- 7.3.4. Other Distribution Channels
- 7.1. Market Analysis, Insights and Forecast - by Type
- 8. South America MEA Gluten Free Food Industry Analysis, Insights and Forecast, 2020-2032
- 8.1. Market Analysis, Insights and Forecast - by Type
- 8.1.1. Gluten Free
- 8.1.2. Dairy Free
- 8.1.3. Allergen Free
- 8.1.4. Other Types
- 8.2. Market Analysis, Insights and Forecast - by End Product
- 8.2.1. Bakery and Confectionery
- 8.2.2. Dairy Free Foods
- 8.2.3. Snacks
- 8.2.4. Beverages
- 8.2.5. Other End Products
- 8.3. Market Analysis, Insights and Forecast - by Distribution Channel
- 8.3.1. Supermarkets/Hypermarkets
- 8.3.2. Online Retail Stores
- 8.3.3. Convenience Stores
- 8.3.4. Other Distribution Channels
- 8.1. Market Analysis, Insights and Forecast - by Type
- 9. Europe MEA Gluten Free Food Industry Analysis, Insights and Forecast, 2020-2032
- 9.1. Market Analysis, Insights and Forecast - by Type
- 9.1.1. Gluten Free
- 9.1.2. Dairy Free
- 9.1.3. Allergen Free
- 9.1.4. Other Types
- 9.2. Market Analysis, Insights and Forecast - by End Product
- 9.2.1. Bakery and Confectionery
- 9.2.2. Dairy Free Foods
- 9.2.3. Snacks
- 9.2.4. Beverages
- 9.2.5. Other End Products
- 9.3. Market Analysis, Insights and Forecast - by Distribution Channel
- 9.3.1. Supermarkets/Hypermarkets
- 9.3.2. Online Retail Stores
- 9.3.3. Convenience Stores
- 9.3.4. Other Distribution Channels
- 9.1. Market Analysis, Insights and Forecast - by Type
- 10. Middle East & Africa MEA Gluten Free Food Industry Analysis, Insights and Forecast, 2020-2032
- 10.1. Market Analysis, Insights and Forecast - by Type
- 10.1.1. Gluten Free
- 10.1.2. Dairy Free
- 10.1.3. Allergen Free
- 10.1.4. Other Types
- 10.2. Market Analysis, Insights and Forecast - by End Product
- 10.2.1. Bakery and Confectionery
- 10.2.2. Dairy Free Foods
- 10.2.3. Snacks
- 10.2.4. Beverages
- 10.2.5. Other End Products
- 10.3. Market Analysis, Insights and Forecast - by Distribution Channel
- 10.3.1. Supermarkets/Hypermarkets
- 10.3.2. Online Retail Stores
- 10.3.3. Convenience Stores
- 10.3.4. Other Distribution Channels
- 10.1. Market Analysis, Insights and Forecast - by Type
- 11. Asia Pacific MEA Gluten Free Food Industry Analysis, Insights and Forecast, 2020-2032
- 11.1. Market Analysis, Insights and Forecast - by Type
- 11.1.1. Gluten Free
- 11.1.2. Dairy Free
- 11.1.3. Allergen Free
- 11.1.4. Other Types
- 11.2. Market Analysis, Insights and Forecast - by End Product
- 11.2.1. Bakery and Confectionery
- 11.2.2. Dairy Free Foods
- 11.2.3. Snacks
- 11.2.4. Beverages
- 11.2.5. Other End Products
- 11.3. Market Analysis, Insights and Forecast - by Distribution Channel
- 11.3.1. Supermarkets/Hypermarkets
- 11.3.2. Online Retail Stores
- 11.3.3. Convenience Stores
- 11.3.4. Other Distribution Channels
- 11.1. Market Analysis, Insights and Forecast - by Type
- 12. Competitive Analysis
- 12.1. Company Profiles
- 12.1.1 Vfoods (Violife)
- 12.1.1.1. Company Overview
- 12.1.1.2. Products
- 12.1.1.3. Company Financials
- 12.1.1.4. SWOT Analysis
- 12.1.2 Orgran SA
- 12.1.2.1. Company Overview
- 12.1.2.2. Products
- 12.1.2.3. Company Financials
- 12.1.2.4. SWOT Analysis
- 12.1.3 General Mills Inc
- 12.1.3.1. Company Overview
- 12.1.3.2. Products
- 12.1.3.3. Company Financials
- 12.1.3.4. SWOT Analysis
- 12.1.4 The Hain Celestial Group Inc
- 12.1.4.1. Company Overview
- 12.1.4.2. Products
- 12.1.4.3. Company Financials
- 12.1.4.4. SWOT Analysis
- 12.1.5 Hunter Foods Limited FZCO
- 12.1.5.1. Company Overview
- 12.1.5.2. Products
- 12.1.5.3. Company Financials
- 12.1.5.4. SWOT Analysis
- 12.1.6 Dr Schar AG / SPA
- 12.1.6.1. Company Overview
- 12.1.6.2. Products
- 12.1.6.3. Company Financials
- 12.1.6.4. SWOT Analysis
- 12.1.7 Danone S A
- 12.1.7.1. Company Overview
- 12.1.7.2. Products
- 12.1.7.3. Company Financials
- 12.1.7.4. SWOT Analysis
- 12.1.8 Probios S p Aa*List Not Exhaustive
- 12.1.8.1. Company Overview
- 12.1.8.2. Products
- 12.1.8.3. Company Financials
- 12.1.8.4. SWOT Analysis
- 12.1.1 Vfoods (Violife)
- 12.2. Market Entropy
- 12.2.1 Company's Key Areas Served
- 12.2.2 Recent Developments
- 12.3. Company Market Share Analysis 2025
- 12.3.1 Top 5 Companies Market Share Analysis
- 12.3.2 Top 3 Companies Market Share Analysis
- 12.4. List of Potential Customers
- 13. Research Methodology
List of Figures
- Figure 1: Global MEA Gluten Free Food Industry Revenue Breakdown (billion, %) by Region 2025 & 2033
- Figure 2: North America MEA Gluten Free Food Industry Revenue (billion), by Type 2025 & 2033
- Figure 3: North America MEA Gluten Free Food Industry Revenue Share (%), by Type 2025 & 2033
- Figure 4: North America MEA Gluten Free Food Industry Revenue (billion), by End Product 2025 & 2033
- Figure 5: North America MEA Gluten Free Food Industry Revenue Share (%), by End Product 2025 & 2033
- Figure 6: North America MEA Gluten Free Food Industry Revenue (billion), by Distribution Channel 2025 & 2033
- Figure 7: North America MEA Gluten Free Food Industry Revenue Share (%), by Distribution Channel 2025 & 2033
- Figure 8: North America MEA Gluten Free Food Industry Revenue (billion), by Country 2025 & 2033
- Figure 9: North America MEA Gluten Free Food Industry Revenue Share (%), by Country 2025 & 2033
- Figure 10: South America MEA Gluten Free Food Industry Revenue (billion), by Type 2025 & 2033
- Figure 11: South America MEA Gluten Free Food Industry Revenue Share (%), by Type 2025 & 2033
- Figure 12: South America MEA Gluten Free Food Industry Revenue (billion), by End Product 2025 & 2033
- Figure 13: South America MEA Gluten Free Food Industry Revenue Share (%), by End Product 2025 & 2033
- Figure 14: South America MEA Gluten Free Food Industry Revenue (billion), by Distribution Channel 2025 & 2033
- Figure 15: South America MEA Gluten Free Food Industry Revenue Share (%), by Distribution Channel 2025 & 2033
- Figure 16: South America MEA Gluten Free Food Industry Revenue (billion), by Country 2025 & 2033
- Figure 17: South America MEA Gluten Free Food Industry Revenue Share (%), by Country 2025 & 2033
- Figure 18: Europe MEA Gluten Free Food Industry Revenue (billion), by Type 2025 & 2033
- Figure 19: Europe MEA Gluten Free Food Industry Revenue Share (%), by Type 2025 & 2033
- Figure 20: Europe MEA Gluten Free Food Industry Revenue (billion), by End Product 2025 & 2033
- Figure 21: Europe MEA Gluten Free Food Industry Revenue Share (%), by End Product 2025 & 2033
- Figure 22: Europe MEA Gluten Free Food Industry Revenue (billion), by Distribution Channel 2025 & 2033
- Figure 23: Europe MEA Gluten Free Food Industry Revenue Share (%), by Distribution Channel 2025 & 2033
- Figure 24: Europe MEA Gluten Free Food Industry Revenue (billion), by Country 2025 & 2033
- Figure 25: Europe MEA Gluten Free Food Industry Revenue Share (%), by Country 2025 & 2033
- Figure 26: Middle East & Africa MEA Gluten Free Food Industry Revenue (billion), by Type 2025 & 2033
- Figure 27: Middle East & Africa MEA Gluten Free Food Industry Revenue Share (%), by Type 2025 & 2033
- Figure 28: Middle East & Africa MEA Gluten Free Food Industry Revenue (billion), by End Product 2025 & 2033
- Figure 29: Middle East & Africa MEA Gluten Free Food Industry Revenue Share (%), by End Product 2025 & 2033
- Figure 30: Middle East & Africa MEA Gluten Free Food Industry Revenue (billion), by Distribution Channel 2025 & 2033
- Figure 31: Middle East & Africa MEA Gluten Free Food Industry Revenue Share (%), by Distribution Channel 2025 & 2033
- Figure 32: Middle East & Africa MEA Gluten Free Food Industry Revenue (billion), by Country 2025 & 2033
- Figure 33: Middle East & Africa MEA Gluten Free Food Industry Revenue Share (%), by Country 2025 & 2033
- Figure 34: Asia Pacific MEA Gluten Free Food Industry Revenue (billion), by Type 2025 & 2033
- Figure 35: Asia Pacific MEA Gluten Free Food Industry Revenue Share (%), by Type 2025 & 2033
- Figure 36: Asia Pacific MEA Gluten Free Food Industry Revenue (billion), by End Product 2025 & 2033
- Figure 37: Asia Pacific MEA Gluten Free Food Industry Revenue Share (%), by End Product 2025 & 2033
- Figure 38: Asia Pacific MEA Gluten Free Food Industry Revenue (billion), by Distribution Channel 2025 & 2033
- Figure 39: Asia Pacific MEA Gluten Free Food Industry Revenue Share (%), by Distribution Channel 2025 & 2033
- Figure 40: Asia Pacific MEA Gluten Free Food Industry Revenue (billion), by Country 2025 & 2033
- Figure 41: Asia Pacific MEA Gluten Free Food Industry Revenue Share (%), by Country 2025 & 2033
List of Tables
- Table 1: Global MEA Gluten Free Food Industry Revenue billion Forecast, by Type 2020 & 2033
- Table 2: Global MEA Gluten Free Food Industry Revenue billion Forecast, by End Product 2020 & 2033
- Table 3: Global MEA Gluten Free Food Industry Revenue billion Forecast, by Distribution Channel 2020 & 2033
- Table 4: Global MEA Gluten Free Food Industry Revenue billion Forecast, by Region 2020 & 2033
- Table 5: Global MEA Gluten Free Food Industry Revenue billion Forecast, by Type 2020 & 2033
- Table 6: Global MEA Gluten Free Food Industry Revenue billion Forecast, by End Product 2020 & 2033
- Table 7: Global MEA Gluten Free Food Industry Revenue billion Forecast, by Distribution Channel 2020 & 2033
- Table 8: Global MEA Gluten Free Food Industry Revenue billion Forecast, by Country 2020 & 2033
- Table 9: United States MEA Gluten Free Food Industry Revenue (billion) Forecast, by Application 2020 & 2033
- Table 10: Canada MEA Gluten Free Food Industry Revenue (billion) Forecast, by Application 2020 & 2033
- Table 11: Mexico MEA Gluten Free Food Industry Revenue (billion) Forecast, by Application 2020 & 2033
- Table 12: Global MEA Gluten Free Food Industry Revenue billion Forecast, by Type 2020 & 2033
- Table 13: Global MEA Gluten Free Food Industry Revenue billion Forecast, by End Product 2020 & 2033
- Table 14: Global MEA Gluten Free Food Industry Revenue billion Forecast, by Distribution Channel 2020 & 2033
- Table 15: Global MEA Gluten Free Food Industry Revenue billion Forecast, by Country 2020 & 2033
- Table 16: Brazil MEA Gluten Free Food Industry Revenue (billion) Forecast, by Application 2020 & 2033
- Table 17: Argentina MEA Gluten Free Food Industry Revenue (billion) Forecast, by Application 2020 & 2033
- Table 18: Rest of South America MEA Gluten Free Food Industry Revenue (billion) Forecast, by Application 2020 & 2033
- Table 19: Global MEA Gluten Free Food Industry Revenue billion Forecast, by Type 2020 & 2033
- Table 20: Global MEA Gluten Free Food Industry Revenue billion Forecast, by End Product 2020 & 2033
- Table 21: Global MEA Gluten Free Food Industry Revenue billion Forecast, by Distribution Channel 2020 & 2033
- Table 22: Global MEA Gluten Free Food Industry Revenue billion Forecast, by Country 2020 & 2033
- Table 23: United Kingdom MEA Gluten Free Food Industry Revenue (billion) Forecast, by Application 2020 & 2033
- Table 24: Germany MEA Gluten Free Food Industry Revenue (billion) Forecast, by Application 2020 & 2033
- Table 25: France MEA Gluten Free Food Industry Revenue (billion) Forecast, by Application 2020 & 2033
- Table 26: Italy MEA Gluten Free Food Industry Revenue (billion) Forecast, by Application 2020 & 2033
- Table 27: Spain MEA Gluten Free Food Industry Revenue (billion) Forecast, by Application 2020 & 2033
- Table 28: Russia MEA Gluten Free Food Industry Revenue (billion) Forecast, by Application 2020 & 2033
- Table 29: Benelux MEA Gluten Free Food Industry Revenue (billion) Forecast, by Application 2020 & 2033
- Table 30: Nordics MEA Gluten Free Food Industry Revenue (billion) Forecast, by Application 2020 & 2033
- Table 31: Rest of Europe MEA Gluten Free Food Industry Revenue (billion) Forecast, by Application 2020 & 2033
- Table 32: Global MEA Gluten Free Food Industry Revenue billion Forecast, by Type 2020 & 2033
- Table 33: Global MEA Gluten Free Food Industry Revenue billion Forecast, by End Product 2020 & 2033
- Table 34: Global MEA Gluten Free Food Industry Revenue billion Forecast, by Distribution Channel 2020 & 2033
- Table 35: Global MEA Gluten Free Food Industry Revenue billion Forecast, by Country 2020 & 2033
- Table 36: Turkey MEA Gluten Free Food Industry Revenue (billion) Forecast, by Application 2020 & 2033
- Table 37: Israel MEA Gluten Free Food Industry Revenue (billion) Forecast, by Application 2020 & 2033
- Table 38: GCC MEA Gluten Free Food Industry Revenue (billion) Forecast, by Application 2020 & 2033
- Table 39: North Africa MEA Gluten Free Food Industry Revenue (billion) Forecast, by Application 2020 & 2033
- Table 40: South Africa MEA Gluten Free Food Industry Revenue (billion) Forecast, by Application 2020 & 2033
- Table 41: Rest of Middle East & Africa MEA Gluten Free Food Industry Revenue (billion) Forecast, by Application 2020 & 2033
- Table 42: Global MEA Gluten Free Food Industry Revenue billion Forecast, by Type 2020 & 2033
- Table 43: Global MEA Gluten Free Food Industry Revenue billion Forecast, by End Product 2020 & 2033
- Table 44: Global MEA Gluten Free Food Industry Revenue billion Forecast, by Distribution Channel 2020 & 2033
- Table 45: Global MEA Gluten Free Food Industry Revenue billion Forecast, by Country 2020 & 2033
- Table 46: China MEA Gluten Free Food Industry Revenue (billion) Forecast, by Application 2020 & 2033
- Table 47: India MEA Gluten Free Food Industry Revenue (billion) Forecast, by Application 2020 & 2033
- Table 48: Japan MEA Gluten Free Food Industry Revenue (billion) Forecast, by Application 2020 & 2033
- Table 49: South Korea MEA Gluten Free Food Industry Revenue (billion) Forecast, by Application 2020 & 2033
- Table 50: ASEAN MEA Gluten Free Food Industry Revenue (billion) Forecast, by Application 2020 & 2033
- Table 51: Oceania MEA Gluten Free Food Industry Revenue (billion) Forecast, by Application 2020 & 2033
- Table 52: Rest of Asia Pacific MEA Gluten Free Food Industry Revenue (billion) Forecast, by Application 2020 & 2033
Frequently Asked Questions
1. What is the projected Compound Annual Growth Rate (CAGR) of the MEA Gluten Free Food Industry?
The projected CAGR is approximately 10.2%.
2. Which companies are prominent players in the MEA Gluten Free Food Industry?
Key companies in the market include Vfoods (Violife), Orgran SA, General Mills Inc, The Hain Celestial Group Inc, Hunter Foods Limited FZCO, Dr Schar AG / SPA, Danone S A, Probios S p Aa*List Not Exhaustive.
3. What are the main segments of the MEA Gluten Free Food Industry?
The market segments include Type, End Product, Distribution Channel.
4. Can you provide details about the market size?
The market size is estimated to be USD 8.5 billion as of 2022.
5. What are some drivers contributing to market growth?
Increasing Health Concerns are Supporting the Market's Growth; Growing Consumer Preference for Convenience Seafood.
6. What are the notable trends driving market growth?
Rising Awareness on Clean Labeling in Africa.
7. Are there any restraints impacting market growth?
Rising Concern About Quality and Safety Standards of Canned Tuna.
8. Can you provide examples of recent developments in the market?
N/A
9. What pricing options are available for accessing the report?
Pricing options include single-user, multi-user, and enterprise licenses priced at USD 4750, USD 5250, and USD 8750 respectively.
10. Is the market size provided in terms of value or volume?
The market size is provided in terms of value, measured in billion.
11. Are there any specific market keywords associated with the report?
Yes, the market keyword associated with the report is "MEA Gluten Free Food Industry," which aids in identifying and referencing the specific market segment covered.
12. How do I determine which pricing option suits my needs best?
The pricing options vary based on user requirements and access needs. Individual users may opt for single-user licenses, while businesses requiring broader access may choose multi-user or enterprise licenses for cost-effective access to the report.
13. Are there any additional resources or data provided in the MEA Gluten Free Food Industry report?
While the report offers comprehensive insights, it's advisable to review the specific contents or supplementary materials provided to ascertain if additional resources or data are available.
14. How can I stay updated on further developments or reports in the MEA Gluten Free Food Industry?
To stay informed about further developments, trends, and reports in the MEA Gluten Free Food Industry, consider subscribing to industry newsletters, following relevant companies and organizations, or regularly checking reputable industry news sources and publications.
Methodology
Step 1 - Identification of Relevant Samples Size from Population Database


Step 2 - Approaches for Defining Global Market Size (Value, Volume* & Price*)

Note*: In applicable scenarios
Step 3 - Data Sources
Primary Research
- Web Analytics
- Survey Reports
- Research Institute
- Latest Research Reports
- Opinion Leaders
Secondary Research
- Annual Reports
- White Paper
- Latest Press Release
- Industry Association
- Paid Database
- Investor Presentations

Step 4 - Data Triangulation
Involves using different sources of information in order to increase the validity of a study
These sources are likely to be stakeholders in a program - participants, other researchers, program staff, other community members, and so on.
Then we put all data in single framework & apply various statistical tools to find out the dynamic on the market.
During the analysis stage, feedback from the stakeholder groups would be compared to determine areas of agreement as well as areas of divergence