

Key Insights
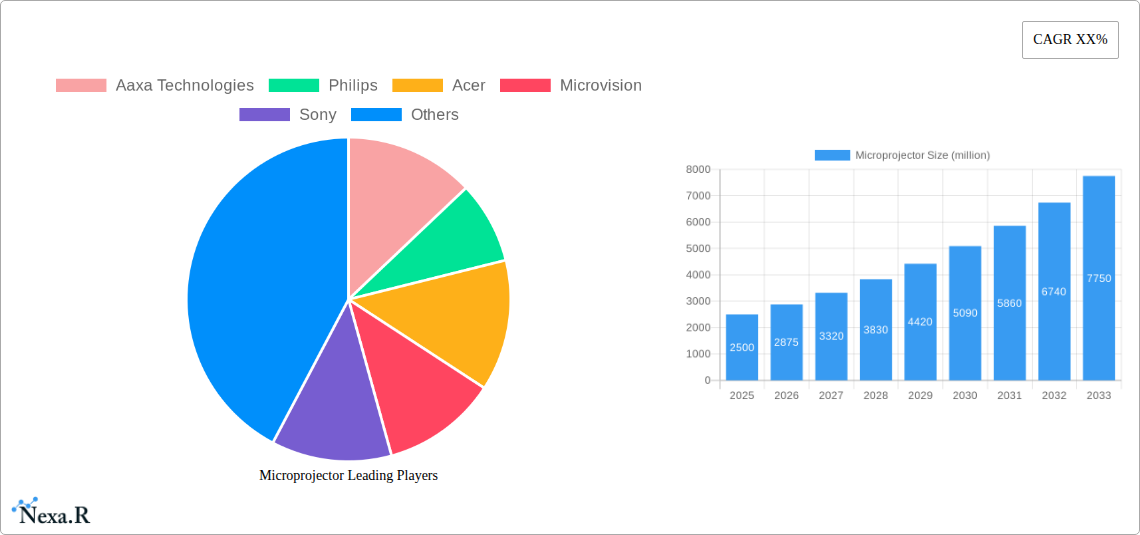
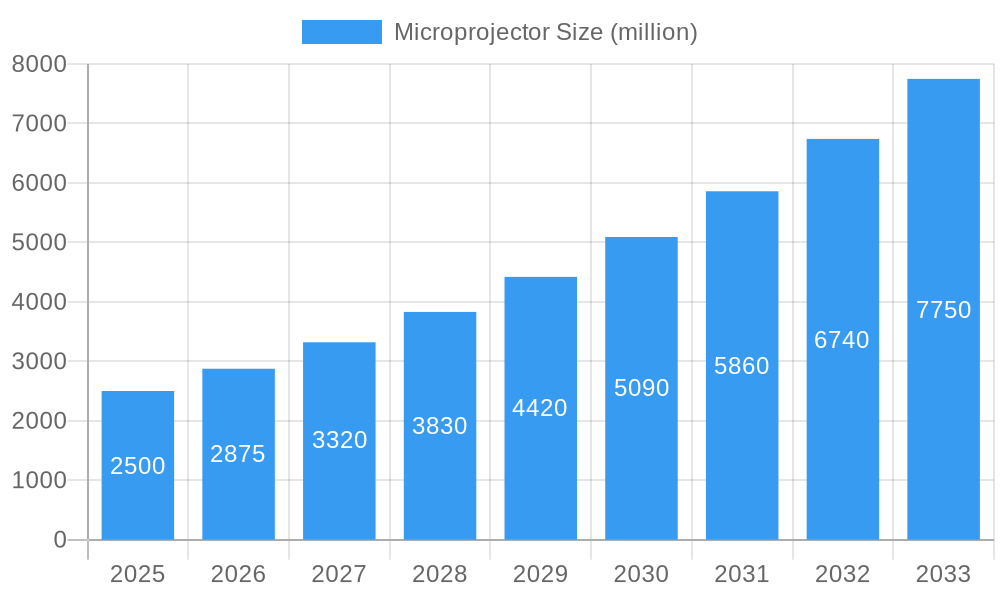
The global microprojector market is experiencing robust growth, driven by increasing demand for portable and compact display solutions across diverse applications. The market, estimated at $2.5 billion in 2025, is projected to exhibit a Compound Annual Growth Rate (CAGR) of 15% from 2025 to 2033, reaching approximately $7.8 billion by 2033. This expansion is fueled by several key factors, including the rising adoption of smartphones with integrated projectors, the growing popularity of portable home theaters, and the increasing use of microprojectors in education and business presentations. Technological advancements, such as improved brightness, resolution, and battery life, are further enhancing market appeal. The segment encompassing portable and handheld microprojectors is expected to dominate the market due to their convenience and versatility. Key players like Aaxa Technologies, Philips, and others are driving innovation through the development of advanced features like wireless connectivity, shorter throw distances, and improved image quality.
Microprojector Market Size (In Billion)
Despite the positive growth outlook, the market faces certain challenges. High manufacturing costs and the relatively high price point of advanced microprojectors may limit market penetration in price-sensitive segments. Competition from other display technologies, such as larger smartphones screens and tablets, also presents a restraint. However, ongoing technological advancements and strategic partnerships among manufacturers and technology providers are likely to mitigate these challenges. The continued miniaturization of components and the development of more energy-efficient designs will be instrumental in driving down costs and expanding market accessibility. Furthermore, the integration of augmented reality (AR) and virtual reality (VR) functionalities is expected to unlock new avenues for growth and broaden the range of microprojector applications.
Microprojector Company Market Share
Microprojector Market Report: 2019-2033
This comprehensive report provides an in-depth analysis of the microprojector market, encompassing historical data (2019-2024), current estimates (2025), and future forecasts (2025-2033). The study covers key market segments, prominent players (including Aaxa Technologies, Philips, Acer, Microvision, Sony, Canon, Syndiant, Toshiba, 3M, Texas Instruments, Samsung, Optoma Technology, LG, BenQ, OPUS Microsystems, Aiptek International, ASK Proxima, Maradin, Luminus Devices, WowWee Group, and Xiaomi), and emerging trends shaping this dynamic industry. The report aims to equip industry professionals, investors, and market strategists with actionable insights to navigate the competitive landscape and capitalize on future growth opportunities. The global microprojector market is projected to reach xx million units by 2033. Parent market analysis includes portable projectors, while child markets encompass pico projectors and smart projectors.
Microprojector Market Dynamics & Structure
The microprojector market exhibits a moderately fragmented structure, with several key players competing fiercely for market share. Technological innovation, particularly in areas like laser technology, improved image quality, and miniaturization, are driving market expansion. Regulatory frameworks related to energy efficiency and safety standards also impact product design and market accessibility. Competitive substitutes, such as smartphones with built-in projection capabilities, pose a challenge to traditional microprojector manufacturers. End-user demographics are expanding beyond the professional segment, with increased demand from consumers seeking portable entertainment solutions. The historical period (2019-2024) witnessed a moderate number of M&A activities, with an estimated xx deals, mainly focused on enhancing technology and distribution channels.
- Market Concentration: Moderately Fragmented (HHI xx)
- Technological Innovation: Laser technology, improved image quality, miniaturization.
- Regulatory Framework: Energy efficiency standards, safety regulations.
- Competitive Substitutes: Smartphones with built-in projection.
- End-User Demographics: Expanding to consumer segment.
- M&A Trends: xx deals (2019-2024), focused on technology and distribution.
- Innovation Barriers: High R&D costs, miniaturization challenges.
Microprojector Growth Trends & Insights
The global microprojector market experienced steady growth during the historical period (2019-2024), driven by increasing demand for portable entertainment and business presentation solutions. The market size in 2024 reached xx million units. Technological advancements, such as the adoption of LED and laser light sources, have improved brightness and image quality, thus boosting market adoption. The consumer segment exhibited significant growth due to increasing smartphone penetration and the growing demand for portable home entertainment. We project a CAGR of xx% during the forecast period (2025-2033), with the market reaching xx million units by 2033. Market penetration is expected to increase significantly, especially in emerging economies. Disruptive technologies like holographic projection are anticipated to influence market trends in the long term. Consumer behavior is shifting towards more compact, feature-rich, and cost-effective devices.
Dominant Regions, Countries, or Segments in Microprojector
North America currently dominates the microprojector market, accounting for approximately xx% of the total market share in 2025. This dominance is primarily attributed to robust technological innovation, high consumer spending, and the strong presence of major microprojector manufacturers. Asia-Pacific is projected to exhibit the highest growth rate during the forecast period, driven by rising disposable incomes, increasing smartphone penetration, and a growing demand for portable entertainment options. The portable projector segment holds the largest market share, followed by the pico projector segment.
- North America: High consumer spending, strong manufacturing presence.
- Asia-Pacific: High growth potential, rising disposable incomes.
- Europe: Stable growth, driven by business applications.
- Portable Projectors: Largest segment by market share.
- Pico Projectors: Significant growth potential in portable applications.
Microprojector Product Landscape
Microprojector product innovations focus on enhancing image quality, increasing brightness, reducing size and weight, and improving battery life. Applications span from business presentations and education to home entertainment and gaming. Key performance metrics include resolution, brightness (measured in lumens), contrast ratio, throw ratio, and battery life. Unique selling propositions include features such as wireless connectivity, auto-focus, and integrated speakers. Recent advancements include the use of laser light sources for improved brightness and color accuracy.
Key Drivers, Barriers & Challenges in Microprojector
Key Drivers:
- Increasing demand for portable entertainment.
- Advancements in display technology (LED, laser).
- Growing adoption in business and education sectors.
- Miniaturization and cost reduction.
Key Barriers & Challenges:
- Competition from smartphones with integrated projection capabilities.
- High manufacturing costs, impacting affordability.
- Supply chain disruptions affecting component availability.
- Regulatory hurdles related to energy efficiency and safety.
Emerging Opportunities in Microprojector
- Expansion into untapped markets in emerging economies.
- Development of innovative applications in augmented reality (AR) and virtual reality (VR).
- Integration with smart home ecosystems and IoT devices.
- Growth of the portable projector segment for consumers and businesses.
Growth Accelerators in the Microprojector Industry
Technological breakthroughs in miniaturization, laser display technology, and improved battery life are crucial growth drivers. Strategic partnerships between microprojector manufacturers and content providers, as well as market expansion into emerging markets, will further accelerate market growth. Increased investment in R&D, targeted marketing campaigns, and a focus on customer experience are also critical factors for long-term success.
Key Players Shaping the Microprojector Market
- Aaxa Technologies
- Philips
- Acer
- Microvision
- Sony
- Canon
- Syndiant
- Toshiba
- 3M
- Texas Instruments
- Samsung
- Optoma Technology
- LG
- BenQ
- OPUS Microsystems
- Aiptek International
- ASK Proxima
- Maradin
- Luminus Devices
- WowWee Group
- Xiaomi
Notable Milestones in Microprojector Sector
- 2020-Q3: Aaxa Technologies launched a new line of ultra-short-throw microprojectors.
- 2021-Q1: Philips introduced a microprojector with enhanced HDR capabilities.
- 2022-Q4: A significant merger between two key microprojector component suppliers. (Specific details unavailable, xx)
- 2023-Q2: Several new pico projector models were launched, featuring improved battery life. (Specific details unavailable, xx)
In-Depth Microprojector Market Outlook
The microprojector market is poised for robust growth over the next decade, driven by continuous technological advancements and expanding applications. Strategic partnerships, focus on innovative product designs, and expansion into emerging markets will be crucial for companies to capitalize on this significant market potential. The increasing integration of microprojectors with smart home devices and other IoT solutions represents a major long-term growth opportunity. The focus on high-resolution, high-brightness, and compact designs will shape the competitive landscape in the years to come.
Microprojector Segmentation
-
1. Application
- 1.1. Household
- 1.2. Commercial
-
2. Types
- 2.1. 2K
- 2.2. 4K
- 2.3. Others
Microprojector Segmentation By Geography
-
1. North America
- 1.1. United States
- 1.2. Canada
- 1.3. Mexico
-
2. South America
- 2.1. Brazil
- 2.2. Argentina
- 2.3. Rest of South America
-
3. Europe
- 3.1. United Kingdom
- 3.2. Germany
- 3.3. France
- 3.4. Italy
- 3.5. Spain
- 3.6. Russia
- 3.7. Benelux
- 3.8. Nordics
- 3.9. Rest of Europe
-
4. Middle East & Africa
- 4.1. Turkey
- 4.2. Israel
- 4.3. GCC
- 4.4. North Africa
- 4.5. South Africa
- 4.6. Rest of Middle East & Africa
-
5. Asia Pacific
- 5.1. China
- 5.2. India
- 5.3. Japan
- 5.4. South Korea
- 5.5. ASEAN
- 5.6. Oceania
- 5.7. Rest of Asia Pacific
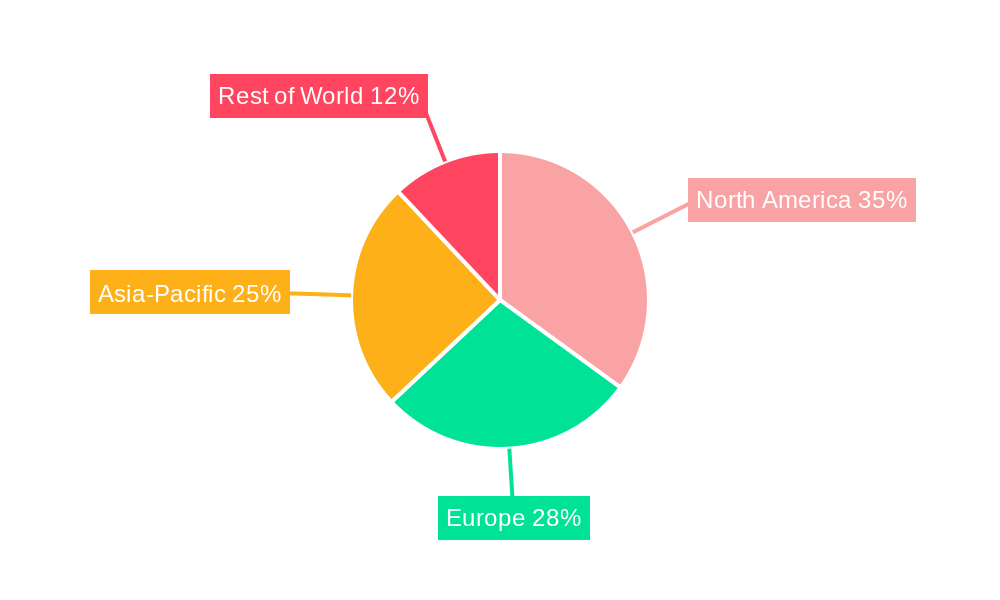
Microprojector Regional Market Share
Geographic Coverage of Microprojector
Microprojector REPORT HIGHLIGHTS
| Aspects | Details |
|---|---|
| Study Period | 2020-2034 |
| Base Year | 2025 |
| Estimated Year | 2026 |
| Forecast Period | 2026-2034 |
| Historical Period | 2020-2025 |
| Growth Rate | CAGR of 9.8% from 2020-2034 |
| Segmentation |
|
Table of Contents
- 1. Introduction
- 1.1. Research Scope
- 1.2. Market Segmentation
- 1.3. Research Methodology
- 1.4. Definitions and Assumptions
- 2. Executive Summary
- 2.1. Introduction
- 3. Market Dynamics
- 3.1. Introduction
- 3.2. Market Drivers
- 3.3. Market Restrains
- 3.4. Market Trends
- 4. Market Factor Analysis
- 4.1. Porters Five Forces
- 4.2. Supply/Value Chain
- 4.3. PESTEL analysis
- 4.4. Market Entropy
- 4.5. Patent/Trademark Analysis
- 5. Global Microprojector Analysis, Insights and Forecast, 2020-2032
- 5.1. Market Analysis, Insights and Forecast - by Application
- 5.1.1. Household
- 5.1.2. Commercial
- 5.2. Market Analysis, Insights and Forecast - by Types
- 5.2.1. 2K
- 5.2.2. 4K
- 5.2.3. Others
- 5.3. Market Analysis, Insights and Forecast - by Region
- 5.3.1. North America
- 5.3.2. South America
- 5.3.3. Europe
- 5.3.4. Middle East & Africa
- 5.3.5. Asia Pacific
- 5.1. Market Analysis, Insights and Forecast - by Application
- 6. North America Microprojector Analysis, Insights and Forecast, 2020-2032
- 6.1. Market Analysis, Insights and Forecast - by Application
- 6.1.1. Household
- 6.1.2. Commercial
- 6.2. Market Analysis, Insights and Forecast - by Types
- 6.2.1. 2K
- 6.2.2. 4K
- 6.2.3. Others
- 6.1. Market Analysis, Insights and Forecast - by Application
- 7. South America Microprojector Analysis, Insights and Forecast, 2020-2032
- 7.1. Market Analysis, Insights and Forecast - by Application
- 7.1.1. Household
- 7.1.2. Commercial
- 7.2. Market Analysis, Insights and Forecast - by Types
- 7.2.1. 2K
- 7.2.2. 4K
- 7.2.3. Others
- 7.1. Market Analysis, Insights and Forecast - by Application
- 8. Europe Microprojector Analysis, Insights and Forecast, 2020-2032
- 8.1. Market Analysis, Insights and Forecast - by Application
- 8.1.1. Household
- 8.1.2. Commercial
- 8.2. Market Analysis, Insights and Forecast - by Types
- 8.2.1. 2K
- 8.2.2. 4K
- 8.2.3. Others
- 8.1. Market Analysis, Insights and Forecast - by Application
- 9. Middle East & Africa Microprojector Analysis, Insights and Forecast, 2020-2032
- 9.1. Market Analysis, Insights and Forecast - by Application
- 9.1.1. Household
- 9.1.2. Commercial
- 9.2. Market Analysis, Insights and Forecast - by Types
- 9.2.1. 2K
- 9.2.2. 4K
- 9.2.3. Others
- 9.1. Market Analysis, Insights and Forecast - by Application
- 10. Asia Pacific Microprojector Analysis, Insights and Forecast, 2020-2032
- 10.1. Market Analysis, Insights and Forecast - by Application
- 10.1.1. Household
- 10.1.2. Commercial
- 10.2. Market Analysis, Insights and Forecast - by Types
- 10.2.1. 2K
- 10.2.2. 4K
- 10.2.3. Others
- 10.1. Market Analysis, Insights and Forecast - by Application
- 11. Competitive Analysis
- 11.1. Global Market Share Analysis 2025
- 11.2. Company Profiles
- 11.2.1 Aaxa Technologies
- 11.2.1.1. Overview
- 11.2.1.2. Products
- 11.2.1.3. SWOT Analysis
- 11.2.1.4. Recent Developments
- 11.2.1.5. Financials (Based on Availability)
- 11.2.2 Philips
- 11.2.2.1. Overview
- 11.2.2.2. Products
- 11.2.2.3. SWOT Analysis
- 11.2.2.4. Recent Developments
- 11.2.2.5. Financials (Based on Availability)
- 11.2.3 Acer
- 11.2.3.1. Overview
- 11.2.3.2. Products
- 11.2.3.3. SWOT Analysis
- 11.2.3.4. Recent Developments
- 11.2.3.5. Financials (Based on Availability)
- 11.2.4 Microvision
- 11.2.4.1. Overview
- 11.2.4.2. Products
- 11.2.4.3. SWOT Analysis
- 11.2.4.4. Recent Developments
- 11.2.4.5. Financials (Based on Availability)
- 11.2.5 Sony
- 11.2.5.1. Overview
- 11.2.5.2. Products
- 11.2.5.3. SWOT Analysis
- 11.2.5.4. Recent Developments
- 11.2.5.5. Financials (Based on Availability)
- 11.2.6 Canon
- 11.2.6.1. Overview
- 11.2.6.2. Products
- 11.2.6.3. SWOT Analysis
- 11.2.6.4. Recent Developments
- 11.2.6.5. Financials (Based on Availability)
- 11.2.7 Syndiant
- 11.2.7.1. Overview
- 11.2.7.2. Products
- 11.2.7.3. SWOT Analysis
- 11.2.7.4. Recent Developments
- 11.2.7.5. Financials (Based on Availability)
- 11.2.8 Toshiba
- 11.2.8.1. Overview
- 11.2.8.2. Products
- 11.2.8.3. SWOT Analysis
- 11.2.8.4. Recent Developments
- 11.2.8.5. Financials (Based on Availability)
- 11.2.9 3M
- 11.2.9.1. Overview
- 11.2.9.2. Products
- 11.2.9.3. SWOT Analysis
- 11.2.9.4. Recent Developments
- 11.2.9.5. Financials (Based on Availability)
- 11.2.10 Texas Instruments
- 11.2.10.1. Overview
- 11.2.10.2. Products
- 11.2.10.3. SWOT Analysis
- 11.2.10.4. Recent Developments
- 11.2.10.5. Financials (Based on Availability)
- 11.2.11 Samsung
- 11.2.11.1. Overview
- 11.2.11.2. Products
- 11.2.11.3. SWOT Analysis
- 11.2.11.4. Recent Developments
- 11.2.11.5. Financials (Based on Availability)
- 11.2.12 Optoma Technology
- 11.2.12.1. Overview
- 11.2.12.2. Products
- 11.2.12.3. SWOT Analysis
- 11.2.12.4. Recent Developments
- 11.2.12.5. Financials (Based on Availability)
- 11.2.13 LG
- 11.2.13.1. Overview
- 11.2.13.2. Products
- 11.2.13.3. SWOT Analysis
- 11.2.13.4. Recent Developments
- 11.2.13.5. Financials (Based on Availability)
- 11.2.14 BenQ
- 11.2.14.1. Overview
- 11.2.14.2. Products
- 11.2.14.3. SWOT Analysis
- 11.2.14.4. Recent Developments
- 11.2.14.5. Financials (Based on Availability)
- 11.2.15 OPUS Microsystems
- 11.2.15.1. Overview
- 11.2.15.2. Products
- 11.2.15.3. SWOT Analysis
- 11.2.15.4. Recent Developments
- 11.2.15.5. Financials (Based on Availability)
- 11.2.16 Aiptek International
- 11.2.16.1. Overview
- 11.2.16.2. Products
- 11.2.16.3. SWOT Analysis
- 11.2.16.4. Recent Developments
- 11.2.16.5. Financials (Based on Availability)
- 11.2.17 ASK Proxima
- 11.2.17.1. Overview
- 11.2.17.2. Products
- 11.2.17.3. SWOT Analysis
- 11.2.17.4. Recent Developments
- 11.2.17.5. Financials (Based on Availability)
- 11.2.18 Maradin
- 11.2.18.1. Overview
- 11.2.18.2. Products
- 11.2.18.3. SWOT Analysis
- 11.2.18.4. Recent Developments
- 11.2.18.5. Financials (Based on Availability)
- 11.2.19 Luminus Device
- 11.2.19.1. Overview
- 11.2.19.2. Products
- 11.2.19.3. SWOT Analysis
- 11.2.19.4. Recent Developments
- 11.2.19.5. Financials (Based on Availability)
- 11.2.20 WowWee Group
- 11.2.20.1. Overview
- 11.2.20.2. Products
- 11.2.20.3. SWOT Analysis
- 11.2.20.4. Recent Developments
- 11.2.20.5. Financials (Based on Availability)
- 11.2.21 Xiaomi
- 11.2.21.1. Overview
- 11.2.21.2. Products
- 11.2.21.3. SWOT Analysis
- 11.2.21.4. Recent Developments
- 11.2.21.5. Financials (Based on Availability)
- 11.2.1 Aaxa Technologies
List of Figures
- Figure 1: Global Microprojector Revenue Breakdown (undefined, %) by Region 2025 & 2033
- Figure 2: North America Microprojector Revenue (undefined), by Application 2025 & 2033
- Figure 3: North America Microprojector Revenue Share (%), by Application 2025 & 2033
- Figure 4: North America Microprojector Revenue (undefined), by Types 2025 & 2033
- Figure 5: North America Microprojector Revenue Share (%), by Types 2025 & 2033
- Figure 6: North America Microprojector Revenue (undefined), by Country 2025 & 2033
- Figure 7: North America Microprojector Revenue Share (%), by Country 2025 & 2033
- Figure 8: South America Microprojector Revenue (undefined), by Application 2025 & 2033
- Figure 9: South America Microprojector Revenue Share (%), by Application 2025 & 2033
- Figure 10: South America Microprojector Revenue (undefined), by Types 2025 & 2033
- Figure 11: South America Microprojector Revenue Share (%), by Types 2025 & 2033
- Figure 12: South America Microprojector Revenue (undefined), by Country 2025 & 2033
- Figure 13: South America Microprojector Revenue Share (%), by Country 2025 & 2033
- Figure 14: Europe Microprojector Revenue (undefined), by Application 2025 & 2033
- Figure 15: Europe Microprojector Revenue Share (%), by Application 2025 & 2033
- Figure 16: Europe Microprojector Revenue (undefined), by Types 2025 & 2033
- Figure 17: Europe Microprojector Revenue Share (%), by Types 2025 & 2033
- Figure 18: Europe Microprojector Revenue (undefined), by Country 2025 & 2033
- Figure 19: Europe Microprojector Revenue Share (%), by Country 2025 & 2033
- Figure 20: Middle East & Africa Microprojector Revenue (undefined), by Application 2025 & 2033
- Figure 21: Middle East & Africa Microprojector Revenue Share (%), by Application 2025 & 2033
- Figure 22: Middle East & Africa Microprojector Revenue (undefined), by Types 2025 & 2033
- Figure 23: Middle East & Africa Microprojector Revenue Share (%), by Types 2025 & 2033
- Figure 24: Middle East & Africa Microprojector Revenue (undefined), by Country 2025 & 2033
- Figure 25: Middle East & Africa Microprojector Revenue Share (%), by Country 2025 & 2033
- Figure 26: Asia Pacific Microprojector Revenue (undefined), by Application 2025 & 2033
- Figure 27: Asia Pacific Microprojector Revenue Share (%), by Application 2025 & 2033
- Figure 28: Asia Pacific Microprojector Revenue (undefined), by Types 2025 & 2033
- Figure 29: Asia Pacific Microprojector Revenue Share (%), by Types 2025 & 2033
- Figure 30: Asia Pacific Microprojector Revenue (undefined), by Country 2025 & 2033
- Figure 31: Asia Pacific Microprojector Revenue Share (%), by Country 2025 & 2033
List of Tables
- Table 1: Global Microprojector Revenue undefined Forecast, by Application 2020 & 2033
- Table 2: Global Microprojector Revenue undefined Forecast, by Types 2020 & 2033
- Table 3: Global Microprojector Revenue undefined Forecast, by Region 2020 & 2033
- Table 4: Global Microprojector Revenue undefined Forecast, by Application 2020 & 2033
- Table 5: Global Microprojector Revenue undefined Forecast, by Types 2020 & 2033
- Table 6: Global Microprojector Revenue undefined Forecast, by Country 2020 & 2033
- Table 7: United States Microprojector Revenue (undefined) Forecast, by Application 2020 & 2033
- Table 8: Canada Microprojector Revenue (undefined) Forecast, by Application 2020 & 2033
- Table 9: Mexico Microprojector Revenue (undefined) Forecast, by Application 2020 & 2033
- Table 10: Global Microprojector Revenue undefined Forecast, by Application 2020 & 2033
- Table 11: Global Microprojector Revenue undefined Forecast, by Types 2020 & 2033
- Table 12: Global Microprojector Revenue undefined Forecast, by Country 2020 & 2033
- Table 13: Brazil Microprojector Revenue (undefined) Forecast, by Application 2020 & 2033
- Table 14: Argentina Microprojector Revenue (undefined) Forecast, by Application 2020 & 2033
- Table 15: Rest of South America Microprojector Revenue (undefined) Forecast, by Application 2020 & 2033
- Table 16: Global Microprojector Revenue undefined Forecast, by Application 2020 & 2033
- Table 17: Global Microprojector Revenue undefined Forecast, by Types 2020 & 2033
- Table 18: Global Microprojector Revenue undefined Forecast, by Country 2020 & 2033
- Table 19: United Kingdom Microprojector Revenue (undefined) Forecast, by Application 2020 & 2033
- Table 20: Germany Microprojector Revenue (undefined) Forecast, by Application 2020 & 2033
- Table 21: France Microprojector Revenue (undefined) Forecast, by Application 2020 & 2033
- Table 22: Italy Microprojector Revenue (undefined) Forecast, by Application 2020 & 2033
- Table 23: Spain Microprojector Revenue (undefined) Forecast, by Application 2020 & 2033
- Table 24: Russia Microprojector Revenue (undefined) Forecast, by Application 2020 & 2033
- Table 25: Benelux Microprojector Revenue (undefined) Forecast, by Application 2020 & 2033
- Table 26: Nordics Microprojector Revenue (undefined) Forecast, by Application 2020 & 2033
- Table 27: Rest of Europe Microprojector Revenue (undefined) Forecast, by Application 2020 & 2033
- Table 28: Global Microprojector Revenue undefined Forecast, by Application 2020 & 2033
- Table 29: Global Microprojector Revenue undefined Forecast, by Types 2020 & 2033
- Table 30: Global Microprojector Revenue undefined Forecast, by Country 2020 & 2033
- Table 31: Turkey Microprojector Revenue (undefined) Forecast, by Application 2020 & 2033
- Table 32: Israel Microprojector Revenue (undefined) Forecast, by Application 2020 & 2033
- Table 33: GCC Microprojector Revenue (undefined) Forecast, by Application 2020 & 2033
- Table 34: North Africa Microprojector Revenue (undefined) Forecast, by Application 2020 & 2033
- Table 35: South Africa Microprojector Revenue (undefined) Forecast, by Application 2020 & 2033
- Table 36: Rest of Middle East & Africa Microprojector Revenue (undefined) Forecast, by Application 2020 & 2033
- Table 37: Global Microprojector Revenue undefined Forecast, by Application 2020 & 2033
- Table 38: Global Microprojector Revenue undefined Forecast, by Types 2020 & 2033
- Table 39: Global Microprojector Revenue undefined Forecast, by Country 2020 & 2033
- Table 40: China Microprojector Revenue (undefined) Forecast, by Application 2020 & 2033
- Table 41: India Microprojector Revenue (undefined) Forecast, by Application 2020 & 2033
- Table 42: Japan Microprojector Revenue (undefined) Forecast, by Application 2020 & 2033
- Table 43: South Korea Microprojector Revenue (undefined) Forecast, by Application 2020 & 2033
- Table 44: ASEAN Microprojector Revenue (undefined) Forecast, by Application 2020 & 2033
- Table 45: Oceania Microprojector Revenue (undefined) Forecast, by Application 2020 & 2033
- Table 46: Rest of Asia Pacific Microprojector Revenue (undefined) Forecast, by Application 2020 & 2033
Frequently Asked Questions
1. What is the projected Compound Annual Growth Rate (CAGR) of the Microprojector?
The projected CAGR is approximately 9.8%.
2. Which companies are prominent players in the Microprojector?
Key companies in the market include Aaxa Technologies, Philips, Acer, Microvision, Sony, Canon, Syndiant, Toshiba, 3M, Texas Instruments, Samsung, Optoma Technology, LG, BenQ, OPUS Microsystems, Aiptek International, ASK Proxima, Maradin, Luminus Device, WowWee Group, Xiaomi.
3. What are the main segments of the Microprojector?
The market segments include Application, Types.
4. Can you provide details about the market size?
The market size is estimated to be USD XXX N/A as of 2022.
5. What are some drivers contributing to market growth?
N/A
6. What are the notable trends driving market growth?
N/A
7. Are there any restraints impacting market growth?
N/A
8. Can you provide examples of recent developments in the market?
N/A
9. What pricing options are available for accessing the report?
Pricing options include single-user, multi-user, and enterprise licenses priced at USD 2900.00, USD 4350.00, and USD 5800.00 respectively.
10. Is the market size provided in terms of value or volume?
The market size is provided in terms of value, measured in N/A.
11. Are there any specific market keywords associated with the report?
Yes, the market keyword associated with the report is "Microprojector," which aids in identifying and referencing the specific market segment covered.
12. How do I determine which pricing option suits my needs best?
The pricing options vary based on user requirements and access needs. Individual users may opt for single-user licenses, while businesses requiring broader access may choose multi-user or enterprise licenses for cost-effective access to the report.
13. Are there any additional resources or data provided in the Microprojector report?
While the report offers comprehensive insights, it's advisable to review the specific contents or supplementary materials provided to ascertain if additional resources or data are available.
14. How can I stay updated on further developments or reports in the Microprojector?
To stay informed about further developments, trends, and reports in the Microprojector, consider subscribing to industry newsletters, following relevant companies and organizations, or regularly checking reputable industry news sources and publications.
Methodology
Step 1 - Identification of Relevant Samples Size from Population Database


Step 2 - Approaches for Defining Global Market Size (Value, Volume* & Price*)

Note*: In applicable scenarios
Step 3 - Data Sources
Primary Research
- Web Analytics
- Survey Reports
- Research Institute
- Latest Research Reports
- Opinion Leaders
Secondary Research
- Annual Reports
- White Paper
- Latest Press Release
- Industry Association
- Paid Database
- Investor Presentations

Step 4 - Data Triangulation
Involves using different sources of information in order to increase the validity of a study
These sources are likely to be stakeholders in a program - participants, other researchers, program staff, other community members, and so on.
Then we put all data in single framework & apply various statistical tools to find out the dynamic on the market.
During the analysis stage, feedback from the stakeholder groups would be compared to determine areas of agreement as well as areas of divergence