

Key Insights
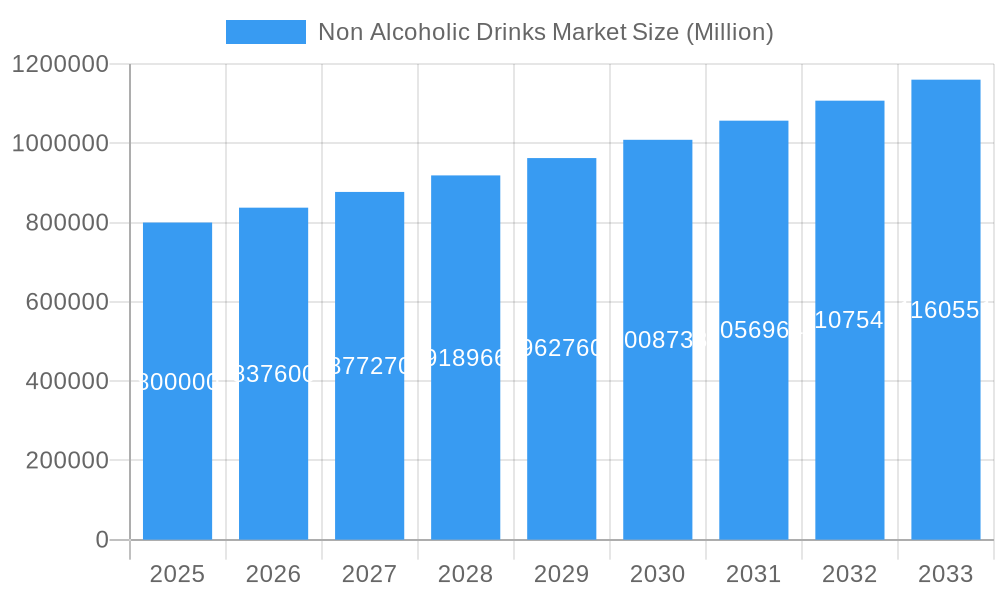
The global non-alcoholic beverage market, valued at approximately $800 billion in 2025, is projected to experience robust growth, exhibiting a compound annual growth rate (CAGR) of 4.70% from 2025 to 2033. This expansion is fueled by several key factors. The increasing health consciousness among consumers is driving demand for healthier options like functional beverages and natural fruit juices, while the rising disposable incomes in emerging economies are expanding the consumer base for premium and diverse non-alcoholic drinks. Furthermore, innovative product launches, such as unique flavor combinations and convenient packaging formats, continue to invigorate the market. The shift towards online retail channels also presents significant growth opportunities, offering greater accessibility and convenience to consumers. However, fluctuating raw material prices and growing concerns regarding added sugar content pose challenges to market expansion.
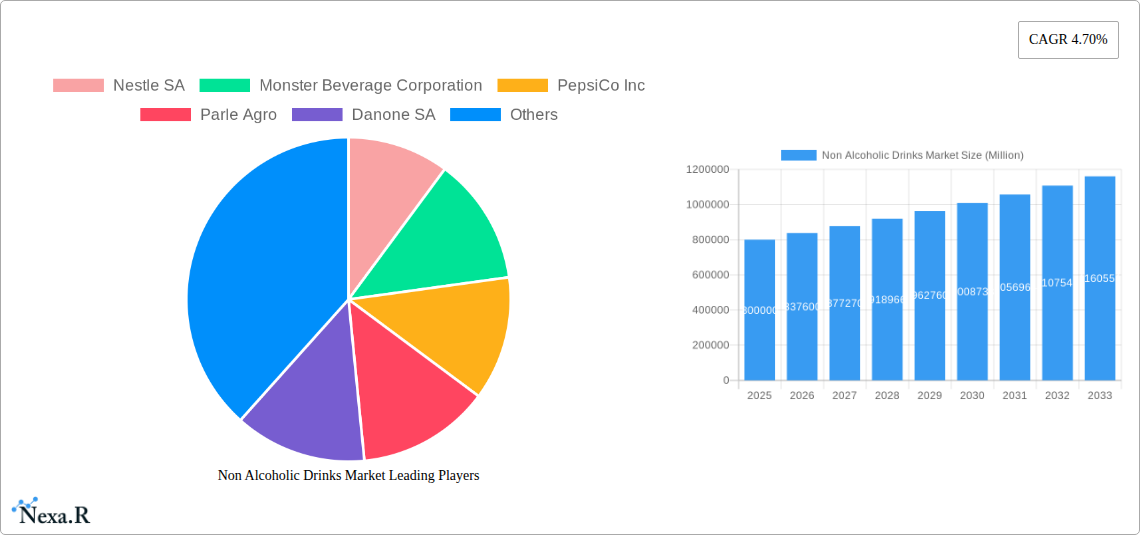
Non Alcoholic Drinks Market Market Size (In Billion)
Market segmentation reveals a dynamic landscape. The carbonated beverage segment, though facing some pressure from health concerns, continues to dominate due to its established market presence and the ongoing appeal of various flavors and brands. Conversely, the non-carbonated segment, particularly fruit juices, functional drinks, and bottled water, demonstrates higher growth potential driven by the aforementioned health-conscious consumer base. Distribution channels are also evolving, with supermarkets and hypermarkets maintaining a substantial market share due to their widespread reach. However, the online segment is experiencing rapid expansion, offering significant growth opportunities for beverage manufacturers. Key players, including Nestle SA, PepsiCo Inc., The Coca-Cola Company, and Monster Beverage Corporation, are strategically investing in innovation, branding, and distribution to maintain their competitive edge within this intensely competitive market. Regional variations exist, with North America and Asia Pacific anticipated to be the largest and fastest-growing markets respectively due to factors like high per capita consumption and burgeoning middle classes.
Non Alcoholic Drinks Market Company Market Share
Non Alcoholic Drinks Market: A Comprehensive Market Report (2019-2033)
This comprehensive report provides a detailed analysis of the Non Alcoholic Drinks Market, encompassing market dynamics, growth trends, regional performance, product landscape, and key players. The study period covers 2019-2033, with 2025 as the base and estimated year. The report offers invaluable insights for industry professionals, investors, and strategists seeking to navigate this dynamic market. The total market size is projected to reach xx Million units by 2033.
Non Alcoholic Drinks Market Dynamics & Structure
This section analyzes the competitive landscape, technological advancements, regulatory influences, and market trends within the non-alcoholic beverage sector. The market is characterized by a high degree of competition among major players and numerous smaller niche brands.
Market Concentration: The market exhibits a concentrated structure, with a few multinational corporations holding significant market share. The top 10 players account for approximately xx% of the global market. However, smaller, specialized brands are increasingly gaining traction.
Technological Innovation: Advancements in production technologies, packaging innovations (e.g., sustainable materials), and flavor development are driving market growth. However, high initial investment costs for advanced technologies represent a significant barrier for smaller players.
Regulatory Frameworks: Varying regulations concerning labeling, ingredients, and health claims across different regions impact market dynamics. Changes in sugar taxes and health-conscious initiatives influence product formulations and consumer preferences.
Competitive Product Substitutes: The non-alcoholic beverage market faces competition from other refreshment options, including water, juices, and other healthy alternatives.
End-User Demographics: Growing health consciousness, increasing disposable income in emerging markets, and evolving consumer preferences (e.g., low-sugar, natural ingredients) are shaping demand.
M&A Trends: The market witnesses frequent mergers and acquisitions (M&As) among major players aiming to expand their product portfolio, market reach, and strengthen their competitive positioning. An estimated xx M&A deals occurred between 2019 and 2024. These transactions contributed significantly to the market concentration.
- Market Share (2024): Nestle SA (xx%), PepsiCo Inc (xx%), Coca-Cola Company (xx%), Others (xx%)
- Average M&A deal value (2019-2024): xx Million units
Non Alcoholic Drinks Market Growth Trends & Insights
The non-alcoholic drinks market is experiencing robust growth, driven by increasing consumer demand, especially for healthier options. The market size has increased from xx Million units in 2019 to xx Million units in 2024, exhibiting a CAGR of xx% during this period. This growth trajectory is expected to continue, with the market projected to reach xx Million units by 2033, representing a CAGR of xx% during the forecast period (2025-2033). The increasing adoption of premium and functional non-alcoholic beverages is a notable trend. This segment is experiencing faster-than-average growth due to rising consumer interest in health and wellness. Factors influencing consumer choice include price sensitivity, availability, and brand loyalty. Technological disruptions, particularly in areas like packaging and flavor enhancement, further accelerate market growth.
Dominant Regions, Countries, or Segments in Non Alcoholic Drinks Market
By Type: The non-carbonated beverage segment dominates the market, driven by growing health consciousness and demand for healthier alternatives.
By Distribution Channel: Supermarkets/Hypermarkets holds the largest market share due to their wide reach and extensive product assortment. Online stores are a fast-growing segment, reflecting increasing e-commerce penetration.
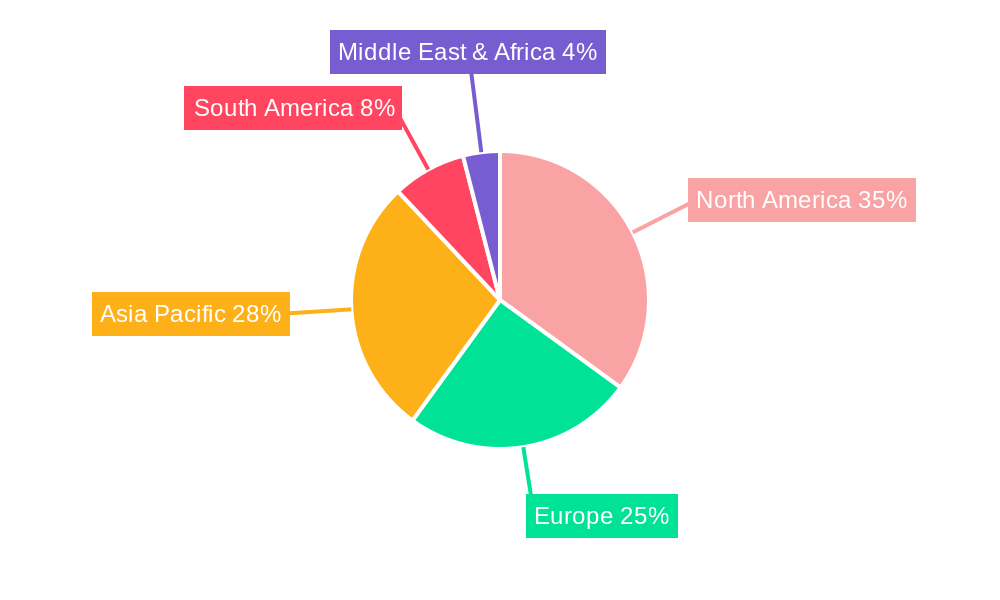
Regional Dominance: North America and Europe currently hold the largest market share. However, Asia-Pacific is a rapidly growing region, driven by increasing disposable incomes and changing consumer preferences.
- Key Drivers for North America: High per capita consumption, strong brand presence of major players, and established distribution channels.
- Key Drivers for Asia-Pacific: Rising disposable income, growing population, and increasing health consciousness.
- Growth Potential: Latin America and Africa offer significant untapped potential due to their large populations and increasing demand for non-alcoholic beverages.
Non Alcoholic Drinks Market Product Landscape
The market offers a diverse range of products catering to various consumer preferences, including carbonated soft drinks, juices, functional drinks, ready-to-drink teas, and bottled water. Product innovation centers around health and wellness, with a growing focus on low-sugar, natural, and functional beverages. Sustainable packaging is another key area of innovation, with increased adoption of recyclable and biodegradable materials. Key differentiators in the market include unique flavor profiles, functional benefits (e.g., enhanced energy, immunity support), and convenient packaging options.
Key Drivers, Barriers & Challenges in Non Alcoholic Drinks Market
Key Drivers: Rising disposable incomes, changing lifestyle patterns, increasing health awareness, and product innovation fuel market growth. Government regulations promoting healthier lifestyles also play a crucial role.
Key Challenges: Intense competition from established players and new entrants, fluctuating raw material prices, and stringent regulatory compliance requirements present significant challenges. Supply chain disruptions and environmental concerns related to packaging waste are additional barriers. The estimated impact of these challenges on market growth is xx% by 2033.
Emerging Opportunities in Non Alcoholic Drinks Market
The market presents substantial opportunities for growth through product diversification, expansion into untapped markets, and strategic partnerships. The demand for organic, locally sourced, and ethically produced non-alcoholic drinks offers a significant opportunity. The rise of premiumization and functional beverages further presents opportunities for innovation and higher-margin products.
Growth Accelerators in the Non Alcoholic Drinks Market Industry
Technological advancements in manufacturing and packaging, strategic mergers and acquisitions, and expansion into new geographic markets are key drivers of long-term growth. Sustainable practices and eco-friendly packaging initiatives are gaining importance, attracting environmentally conscious consumers. The development of functional beverages with specific health benefits contributes to accelerated market growth.
Key Players Shaping the Non Alcoholic Drinks Market Market
- Nestle SA
- Monster Beverage Corporation
- PepsiCo Inc
- Parle Agro
- Danone SA
- Keurig Dr Pepper Inc
- Red Bull GmbH
- The Coca-Cola Company
- AriZona Beverages USA
- IBS Partners Lt
Notable Milestones in Non Alcoholic Drinks Market Sector
- July 2022: PepsiCo opened its largest US bottling plant in Colorado, emphasizing sustainability initiatives.
- March 2022: Red Bull launched a limited-edition flavor, expanding its product portfolio.
- March 2022: PerfectTed launched a range of canned natural energy drinks, targeting the health-conscious consumer segment.
In-Depth Non Alcoholic Drinks Market Market Outlook
The non-alcoholic drinks market is poised for significant growth, driven by ongoing innovation, expanding consumer base, and increasing health awareness. Strategic partnerships, particularly with ingredient suppliers and technology providers, will be crucial for success. Sustainable packaging and ethical sourcing will increasingly shape consumer preferences, creating opportunities for brands committed to these practices. The long-term outlook for the market remains positive, with substantial growth potential in emerging markets and continued product diversification.
Non Alcoholic Drinks Market Segmentation
-
1. Type
- 1.1. Carbonated Beverage
-
1.2. Non-carbonated Beverage
- 1.2.1. Fruit and Vegetable Juice
- 1.2.2. Functional Drinks
- 1.2.3. RTD Tea and Coffee
- 1.2.4. Bottled Water
- 1.2.5. Other Types
-
2. Distribution Channel
- 2.1. Supermarkets/Hypermarkets
- 2.2. Convenience Stores
- 2.3. Speciality Stores
- 2.4. Online Stores
- 2.5. Other Distribution Channels
Non Alcoholic Drinks Market Segmentation By Geography
-
1. North America
- 1.1. United States
- 1.2. Canada
- 1.3. Mexico
- 1.4. Rest of North America
-
2. Europe
- 2.1. Germany
- 2.2. United Kingdom
- 2.3. France
- 2.4. Spain
- 2.5. Russia
- 2.6. Italy
- 2.7. Rest of Europe
-
3. Asia Pacific
- 3.1. China
- 3.2. India
- 3.3. Japan
- 3.4. Australia
- 3.5. Rest of Asia Pacific
-
4. South America
- 4.1. Brazil
- 4.2. Argentina
- 4.3. Rest of South America
- 5. Middle East
-
6. Saudi Arabia
- 6.1. South Africa
- 6.2. Rest of Middle East
Non Alcoholic Drinks Market Regional Market Share
Geographic Coverage of Non Alcoholic Drinks Market
Non Alcoholic Drinks Market REPORT HIGHLIGHTS
| Aspects | Details |
|---|---|
| Study Period | 2020-2034 |
| Base Year | 2025 |
| Estimated Year | 2026 |
| Forecast Period | 2026-2034 |
| Historical Period | 2020-2025 |
| Growth Rate | CAGR of 4.70% from 2020-2034 |
| Segmentation |
|
Table of Contents
- 1. Introduction
- 1.1. Research Scope
- 1.2. Market Segmentation
- 1.3. Research Objective
- 1.4. Definitions and Assumptions
- 2. Executive Summary
- 2.1. Market Snapshot
- 3. Market Dynamics
- 3.1. Market Drivers
- 3.2. Market Restrains
- 3.3. Market Trends
- 3.4. Market Opportunities
- 4. Market Factor Analysis
- 4.1. Porters Five Forces
- 4.1.1. Bargaining Power of Suppliers
- 4.1.2. Bargaining Power of Buyers
- 4.1.3. Threat of New Entrants
- 4.1.4. Threat of Substitutes
- 4.1.5. Competitive Rivalry
- 4.2. PESTEL analysis
- 4.3. BCG Analysis
- 4.3.1. Stars (High Growth, High Market Share)
- 4.3.2. Cash Cows (Low Growth, High Market Share)
- 4.3.3. Question Mark (High Growth, Low Market Share)
- 4.3.4. Dogs (Low Growth, Low Market Share)
- 4.4. Ansoff Matrix Analysis
- 4.5. Supply Chain Analysis
- 4.6. Regulatory Landscape
- 4.7. Current Market Potential and Opportunity Assessment (TAM–SAM–SOM Framework)
- 4.8. NRP Analyst Note
- 4.1. Porters Five Forces
- 5. Market Analysis, Insights and Forecast 2021-2033
- 5.1. Market Analysis, Insights and Forecast - by Type
- 5.1.1. Carbonated Beverage
- 5.1.2. Non-carbonated Beverage
- 5.1.2.1. Fruit and Vegetable Juice
- 5.1.2.2. Functional Drinks
- 5.1.2.3. RTD Tea and Coffee
- 5.1.2.4. Bottled Water
- 5.1.2.5. Other Types
- 5.2. Market Analysis, Insights and Forecast - by Distribution Channel
- 5.2.1. Supermarkets/Hypermarkets
- 5.2.2. Convenience Stores
- 5.2.3. Speciality Stores
- 5.2.4. Online Stores
- 5.2.5. Other Distribution Channels
- 5.3. Market Analysis, Insights and Forecast - by Region
- 5.3.1. North America
- 5.3.2. Europe
- 5.3.3. Asia Pacific
- 5.3.4. South America
- 5.3.5. Middle East
- 5.3.6. Saudi Arabia
- 5.1. Market Analysis, Insights and Forecast - by Type
- 6. Global Non Alcoholic Drinks Market Analysis, Insights and Forecast, 2021-2033
- 6.1. Market Analysis, Insights and Forecast - by Type
- 6.1.1. Carbonated Beverage
- 6.1.2. Non-carbonated Beverage
- 6.1.2.1. Fruit and Vegetable Juice
- 6.1.2.2. Functional Drinks
- 6.1.2.3. RTD Tea and Coffee
- 6.1.2.4. Bottled Water
- 6.1.2.5. Other Types
- 6.2. Market Analysis, Insights and Forecast - by Distribution Channel
- 6.2.1. Supermarkets/Hypermarkets
- 6.2.2. Convenience Stores
- 6.2.3. Speciality Stores
- 6.2.4. Online Stores
- 6.2.5. Other Distribution Channels
- 6.1. Market Analysis, Insights and Forecast - by Type
- 7. North America Non Alcoholic Drinks Market Analysis, Insights and Forecast, 2020-2032
- 7.1. Market Analysis, Insights and Forecast - by Type
- 7.1.1. Carbonated Beverage
- 7.1.2. Non-carbonated Beverage
- 7.1.2.1. Fruit and Vegetable Juice
- 7.1.2.2. Functional Drinks
- 7.1.2.3. RTD Tea and Coffee
- 7.1.2.4. Bottled Water
- 7.1.2.5. Other Types
- 7.2. Market Analysis, Insights and Forecast - by Distribution Channel
- 7.2.1. Supermarkets/Hypermarkets
- 7.2.2. Convenience Stores
- 7.2.3. Speciality Stores
- 7.2.4. Online Stores
- 7.2.5. Other Distribution Channels
- 7.1. Market Analysis, Insights and Forecast - by Type
- 8. Europe Non Alcoholic Drinks Market Analysis, Insights and Forecast, 2020-2032
- 8.1. Market Analysis, Insights and Forecast - by Type
- 8.1.1. Carbonated Beverage
- 8.1.2. Non-carbonated Beverage
- 8.1.2.1. Fruit and Vegetable Juice
- 8.1.2.2. Functional Drinks
- 8.1.2.3. RTD Tea and Coffee
- 8.1.2.4. Bottled Water
- 8.1.2.5. Other Types
- 8.2. Market Analysis, Insights and Forecast - by Distribution Channel
- 8.2.1. Supermarkets/Hypermarkets
- 8.2.2. Convenience Stores
- 8.2.3. Speciality Stores
- 8.2.4. Online Stores
- 8.2.5. Other Distribution Channels
- 8.1. Market Analysis, Insights and Forecast - by Type
- 9. Asia Pacific Non Alcoholic Drinks Market Analysis, Insights and Forecast, 2020-2032
- 9.1. Market Analysis, Insights and Forecast - by Type
- 9.1.1. Carbonated Beverage
- 9.1.2. Non-carbonated Beverage
- 9.1.2.1. Fruit and Vegetable Juice
- 9.1.2.2. Functional Drinks
- 9.1.2.3. RTD Tea and Coffee
- 9.1.2.4. Bottled Water
- 9.1.2.5. Other Types
- 9.2. Market Analysis, Insights and Forecast - by Distribution Channel
- 9.2.1. Supermarkets/Hypermarkets
- 9.2.2. Convenience Stores
- 9.2.3. Speciality Stores
- 9.2.4. Online Stores
- 9.2.5. Other Distribution Channels
- 9.1. Market Analysis, Insights and Forecast - by Type
- 10. South America Non Alcoholic Drinks Market Analysis, Insights and Forecast, 2020-2032
- 10.1. Market Analysis, Insights and Forecast - by Type
- 10.1.1. Carbonated Beverage
- 10.1.2. Non-carbonated Beverage
- 10.1.2.1. Fruit and Vegetable Juice
- 10.1.2.2. Functional Drinks
- 10.1.2.3. RTD Tea and Coffee
- 10.1.2.4. Bottled Water
- 10.1.2.5. Other Types
- 10.2. Market Analysis, Insights and Forecast - by Distribution Channel
- 10.2.1. Supermarkets/Hypermarkets
- 10.2.2. Convenience Stores
- 10.2.3. Speciality Stores
- 10.2.4. Online Stores
- 10.2.5. Other Distribution Channels
- 10.1. Market Analysis, Insights and Forecast - by Type
- 11. Middle East Non Alcoholic Drinks Market Analysis, Insights and Forecast, 2020-2032
- 11.1. Market Analysis, Insights and Forecast - by Type
- 11.1.1. Carbonated Beverage
- 11.1.2. Non-carbonated Beverage
- 11.1.2.1. Fruit and Vegetable Juice
- 11.1.2.2. Functional Drinks
- 11.1.2.3. RTD Tea and Coffee
- 11.1.2.4. Bottled Water
- 11.1.2.5. Other Types
- 11.2. Market Analysis, Insights and Forecast - by Distribution Channel
- 11.2.1. Supermarkets/Hypermarkets
- 11.2.2. Convenience Stores
- 11.2.3. Speciality Stores
- 11.2.4. Online Stores
- 11.2.5. Other Distribution Channels
- 11.1. Market Analysis, Insights and Forecast - by Type
- 12. Saudi Arabia Non Alcoholic Drinks Market Analysis, Insights and Forecast, 2020-2032
- 12.1. Market Analysis, Insights and Forecast - by Type
- 12.1.1. Carbonated Beverage
- 12.1.2. Non-carbonated Beverage
- 12.1.2.1. Fruit and Vegetable Juice
- 12.1.2.2. Functional Drinks
- 12.1.2.3. RTD Tea and Coffee
- 12.1.2.4. Bottled Water
- 12.1.2.5. Other Types
- 12.2. Market Analysis, Insights and Forecast - by Distribution Channel
- 12.2.1. Supermarkets/Hypermarkets
- 12.2.2. Convenience Stores
- 12.2.3. Speciality Stores
- 12.2.4. Online Stores
- 12.2.5. Other Distribution Channels
- 12.1. Market Analysis, Insights and Forecast - by Type
- 13. Competitive Analysis
- 13.1. Company Profiles
- 13.1.1 Nestle SA
- 13.1.1.1. Company Overview
- 13.1.1.2. Products
- 13.1.1.3. Company Financials
- 13.1.1.4. SWOT Analysis
- 13.1.2 Monster Beverage Corporation
- 13.1.2.1. Company Overview
- 13.1.2.2. Products
- 13.1.2.3. Company Financials
- 13.1.2.4. SWOT Analysis
- 13.1.3 PepsiCo Inc
- 13.1.3.1. Company Overview
- 13.1.3.2. Products
- 13.1.3.3. Company Financials
- 13.1.3.4. SWOT Analysis
- 13.1.4 Parle Agro
- 13.1.4.1. Company Overview
- 13.1.4.2. Products
- 13.1.4.3. Company Financials
- 13.1.4.4. SWOT Analysis
- 13.1.5 Danone SA
- 13.1.5.1. Company Overview
- 13.1.5.2. Products
- 13.1.5.3. Company Financials
- 13.1.5.4. SWOT Analysis
- 13.1.6 Keurig Dr Pepper Inc
- 13.1.6.1. Company Overview
- 13.1.6.2. Products
- 13.1.6.3. Company Financials
- 13.1.6.4. SWOT Analysis
- 13.1.7 Red Bull GmbH
- 13.1.7.1. Company Overview
- 13.1.7.2. Products
- 13.1.7.3. Company Financials
- 13.1.7.4. SWOT Analysis
- 13.1.8 The Coca-Cola Company
- 13.1.8.1. Company Overview
- 13.1.8.2. Products
- 13.1.8.3. Company Financials
- 13.1.8.4. SWOT Analysis
- 13.1.9 AriZona Beverages USA
- 13.1.9.1. Company Overview
- 13.1.9.2. Products
- 13.1.9.3. Company Financials
- 13.1.9.4. SWOT Analysis
- 13.1.10 IBS Partners Lt
- 13.1.10.1. Company Overview
- 13.1.10.2. Products
- 13.1.10.3. Company Financials
- 13.1.10.4. SWOT Analysis
- 13.1.1 Nestle SA
- 13.2. Market Entropy
- 13.2.1 Company's Key Areas Served
- 13.2.2 Recent Developments
- 13.3. Company Market Share Analysis 2025
- 13.3.1 Top 5 Companies Market Share Analysis
- 13.3.2 Top 3 Companies Market Share Analysis
- 13.4. List of Potential Customers
- 14. Research Methodology
List of Figures
- Figure 1: Global Non Alcoholic Drinks Market Revenue Breakdown (Million, %) by Region 2025 & 2033
- Figure 2: North America Non Alcoholic Drinks Market Revenue (Million), by Type 2025 & 2033
- Figure 3: North America Non Alcoholic Drinks Market Revenue Share (%), by Type 2025 & 2033
- Figure 4: North America Non Alcoholic Drinks Market Revenue (Million), by Distribution Channel 2025 & 2033
- Figure 5: North America Non Alcoholic Drinks Market Revenue Share (%), by Distribution Channel 2025 & 2033
- Figure 6: North America Non Alcoholic Drinks Market Revenue (Million), by Country 2025 & 2033
- Figure 7: North America Non Alcoholic Drinks Market Revenue Share (%), by Country 2025 & 2033
- Figure 8: Europe Non Alcoholic Drinks Market Revenue (Million), by Type 2025 & 2033
- Figure 9: Europe Non Alcoholic Drinks Market Revenue Share (%), by Type 2025 & 2033
- Figure 10: Europe Non Alcoholic Drinks Market Revenue (Million), by Distribution Channel 2025 & 2033
- Figure 11: Europe Non Alcoholic Drinks Market Revenue Share (%), by Distribution Channel 2025 & 2033
- Figure 12: Europe Non Alcoholic Drinks Market Revenue (Million), by Country 2025 & 2033
- Figure 13: Europe Non Alcoholic Drinks Market Revenue Share (%), by Country 2025 & 2033
- Figure 14: Asia Pacific Non Alcoholic Drinks Market Revenue (Million), by Type 2025 & 2033
- Figure 15: Asia Pacific Non Alcoholic Drinks Market Revenue Share (%), by Type 2025 & 2033
- Figure 16: Asia Pacific Non Alcoholic Drinks Market Revenue (Million), by Distribution Channel 2025 & 2033
- Figure 17: Asia Pacific Non Alcoholic Drinks Market Revenue Share (%), by Distribution Channel 2025 & 2033
- Figure 18: Asia Pacific Non Alcoholic Drinks Market Revenue (Million), by Country 2025 & 2033
- Figure 19: Asia Pacific Non Alcoholic Drinks Market Revenue Share (%), by Country 2025 & 2033
- Figure 20: South America Non Alcoholic Drinks Market Revenue (Million), by Type 2025 & 2033
- Figure 21: South America Non Alcoholic Drinks Market Revenue Share (%), by Type 2025 & 2033
- Figure 22: South America Non Alcoholic Drinks Market Revenue (Million), by Distribution Channel 2025 & 2033
- Figure 23: South America Non Alcoholic Drinks Market Revenue Share (%), by Distribution Channel 2025 & 2033
- Figure 24: South America Non Alcoholic Drinks Market Revenue (Million), by Country 2025 & 2033
- Figure 25: South America Non Alcoholic Drinks Market Revenue Share (%), by Country 2025 & 2033
- Figure 26: Middle East Non Alcoholic Drinks Market Revenue (Million), by Type 2025 & 2033
- Figure 27: Middle East Non Alcoholic Drinks Market Revenue Share (%), by Type 2025 & 2033
- Figure 28: Middle East Non Alcoholic Drinks Market Revenue (Million), by Distribution Channel 2025 & 2033
- Figure 29: Middle East Non Alcoholic Drinks Market Revenue Share (%), by Distribution Channel 2025 & 2033
- Figure 30: Middle East Non Alcoholic Drinks Market Revenue (Million), by Country 2025 & 2033
- Figure 31: Middle East Non Alcoholic Drinks Market Revenue Share (%), by Country 2025 & 2033
- Figure 32: Saudi Arabia Non Alcoholic Drinks Market Revenue (Million), by Type 2025 & 2033
- Figure 33: Saudi Arabia Non Alcoholic Drinks Market Revenue Share (%), by Type 2025 & 2033
- Figure 34: Saudi Arabia Non Alcoholic Drinks Market Revenue (Million), by Distribution Channel 2025 & 2033
- Figure 35: Saudi Arabia Non Alcoholic Drinks Market Revenue Share (%), by Distribution Channel 2025 & 2033
- Figure 36: Saudi Arabia Non Alcoholic Drinks Market Revenue (Million), by Country 2025 & 2033
- Figure 37: Saudi Arabia Non Alcoholic Drinks Market Revenue Share (%), by Country 2025 & 2033
List of Tables
- Table 1: Global Non Alcoholic Drinks Market Revenue Million Forecast, by Type 2020 & 2033
- Table 2: Global Non Alcoholic Drinks Market Revenue Million Forecast, by Distribution Channel 2020 & 2033
- Table 3: Global Non Alcoholic Drinks Market Revenue Million Forecast, by Region 2020 & 2033
- Table 4: Global Non Alcoholic Drinks Market Revenue Million Forecast, by Type 2020 & 2033
- Table 5: Global Non Alcoholic Drinks Market Revenue Million Forecast, by Distribution Channel 2020 & 2033
- Table 6: Global Non Alcoholic Drinks Market Revenue Million Forecast, by Country 2020 & 2033
- Table 7: United States Non Alcoholic Drinks Market Revenue (Million) Forecast, by Application 2020 & 2033
- Table 8: Canada Non Alcoholic Drinks Market Revenue (Million) Forecast, by Application 2020 & 2033
- Table 9: Mexico Non Alcoholic Drinks Market Revenue (Million) Forecast, by Application 2020 & 2033
- Table 10: Rest of North America Non Alcoholic Drinks Market Revenue (Million) Forecast, by Application 2020 & 2033
- Table 11: Global Non Alcoholic Drinks Market Revenue Million Forecast, by Type 2020 & 2033
- Table 12: Global Non Alcoholic Drinks Market Revenue Million Forecast, by Distribution Channel 2020 & 2033
- Table 13: Global Non Alcoholic Drinks Market Revenue Million Forecast, by Country 2020 & 2033
- Table 14: Germany Non Alcoholic Drinks Market Revenue (Million) Forecast, by Application 2020 & 2033
- Table 15: United Kingdom Non Alcoholic Drinks Market Revenue (Million) Forecast, by Application 2020 & 2033
- Table 16: France Non Alcoholic Drinks Market Revenue (Million) Forecast, by Application 2020 & 2033
- Table 17: Spain Non Alcoholic Drinks Market Revenue (Million) Forecast, by Application 2020 & 2033
- Table 18: Russia Non Alcoholic Drinks Market Revenue (Million) Forecast, by Application 2020 & 2033
- Table 19: Italy Non Alcoholic Drinks Market Revenue (Million) Forecast, by Application 2020 & 2033
- Table 20: Rest of Europe Non Alcoholic Drinks Market Revenue (Million) Forecast, by Application 2020 & 2033
- Table 21: Global Non Alcoholic Drinks Market Revenue Million Forecast, by Type 2020 & 2033
- Table 22: Global Non Alcoholic Drinks Market Revenue Million Forecast, by Distribution Channel 2020 & 2033
- Table 23: Global Non Alcoholic Drinks Market Revenue Million Forecast, by Country 2020 & 2033
- Table 24: China Non Alcoholic Drinks Market Revenue (Million) Forecast, by Application 2020 & 2033
- Table 25: India Non Alcoholic Drinks Market Revenue (Million) Forecast, by Application 2020 & 2033
- Table 26: Japan Non Alcoholic Drinks Market Revenue (Million) Forecast, by Application 2020 & 2033
- Table 27: Australia Non Alcoholic Drinks Market Revenue (Million) Forecast, by Application 2020 & 2033
- Table 28: Rest of Asia Pacific Non Alcoholic Drinks Market Revenue (Million) Forecast, by Application 2020 & 2033
- Table 29: Global Non Alcoholic Drinks Market Revenue Million Forecast, by Type 2020 & 2033
- Table 30: Global Non Alcoholic Drinks Market Revenue Million Forecast, by Distribution Channel 2020 & 2033
- Table 31: Global Non Alcoholic Drinks Market Revenue Million Forecast, by Country 2020 & 2033
- Table 32: Brazil Non Alcoholic Drinks Market Revenue (Million) Forecast, by Application 2020 & 2033
- Table 33: Argentina Non Alcoholic Drinks Market Revenue (Million) Forecast, by Application 2020 & 2033
- Table 34: Rest of South America Non Alcoholic Drinks Market Revenue (Million) Forecast, by Application 2020 & 2033
- Table 35: Global Non Alcoholic Drinks Market Revenue Million Forecast, by Type 2020 & 2033
- Table 36: Global Non Alcoholic Drinks Market Revenue Million Forecast, by Distribution Channel 2020 & 2033
- Table 37: Global Non Alcoholic Drinks Market Revenue Million Forecast, by Country 2020 & 2033
- Table 38: Global Non Alcoholic Drinks Market Revenue Million Forecast, by Type 2020 & 2033
- Table 39: Global Non Alcoholic Drinks Market Revenue Million Forecast, by Distribution Channel 2020 & 2033
- Table 40: Global Non Alcoholic Drinks Market Revenue Million Forecast, by Country 2020 & 2033
- Table 41: South Africa Non Alcoholic Drinks Market Revenue (Million) Forecast, by Application 2020 & 2033
- Table 42: Rest of Middle East Non Alcoholic Drinks Market Revenue (Million) Forecast, by Application 2020 & 2033
Frequently Asked Questions
1. What is the projected Compound Annual Growth Rate (CAGR) of the Non Alcoholic Drinks Market?
The projected CAGR is approximately 4.70%.
2. Which companies are prominent players in the Non Alcoholic Drinks Market?
Key companies in the market include Nestle SA, Monster Beverage Corporation, PepsiCo Inc, Parle Agro, Danone SA, Keurig Dr Pepper Inc, Red Bull GmbH, The Coca-Cola Company, AriZona Beverages USA, IBS Partners Lt.
3. What are the main segments of the Non Alcoholic Drinks Market?
The market segments include Type, Distribution Channel.
4. Can you provide details about the market size?
The market size is estimated to be USD XX Million as of 2022.
5. What are some drivers contributing to market growth?
Increasing Health Consciousness Among Consumers; Increasing Demand for Vegan Food Products.
6. What are the notable trends driving market growth?
Strong Demand from Fitness Conscious Consumers.
7. Are there any restraints impacting market growth?
Poor Supply Chain.
8. Can you provide examples of recent developments in the market?
In July 2022, PepsiCo opened its largest US bottling plant in Colorado. The proposed facility might achieve 100% renewable electricity, best-in-class water efficiency, and reduced virgin plastic use.
9. What pricing options are available for accessing the report?
Pricing options include single-user, multi-user, and enterprise licenses priced at USD 4750, USD 5250, and USD 8750 respectively.
10. Is the market size provided in terms of value or volume?
The market size is provided in terms of value, measured in Million.
11. Are there any specific market keywords associated with the report?
Yes, the market keyword associated with the report is "Non Alcoholic Drinks Market," which aids in identifying and referencing the specific market segment covered.
12. How do I determine which pricing option suits my needs best?
The pricing options vary based on user requirements and access needs. Individual users may opt for single-user licenses, while businesses requiring broader access may choose multi-user or enterprise licenses for cost-effective access to the report.
13. Are there any additional resources or data provided in the Non Alcoholic Drinks Market report?
While the report offers comprehensive insights, it's advisable to review the specific contents or supplementary materials provided to ascertain if additional resources or data are available.
14. How can I stay updated on further developments or reports in the Non Alcoholic Drinks Market?
To stay informed about further developments, trends, and reports in the Non Alcoholic Drinks Market, consider subscribing to industry newsletters, following relevant companies and organizations, or regularly checking reputable industry news sources and publications.
Methodology
Step 1 - Identification of Relevant Samples Size from Population Database


Step 2 - Approaches for Defining Global Market Size (Value, Volume* & Price*)

Note*: In applicable scenarios
Step 3 - Data Sources
Primary Research
- Web Analytics
- Survey Reports
- Research Institute
- Latest Research Reports
- Opinion Leaders
Secondary Research
- Annual Reports
- White Paper
- Latest Press Release
- Industry Association
- Paid Database
- Investor Presentations

Step 4 - Data Triangulation
Involves using different sources of information in order to increase the validity of a study
These sources are likely to be stakeholders in a program - participants, other researchers, program staff, other community members, and so on.
Then we put all data in single framework & apply various statistical tools to find out the dynamic on the market.
During the analysis stage, feedback from the stakeholder groups would be compared to determine areas of agreement as well as areas of divergence