

Key Insights
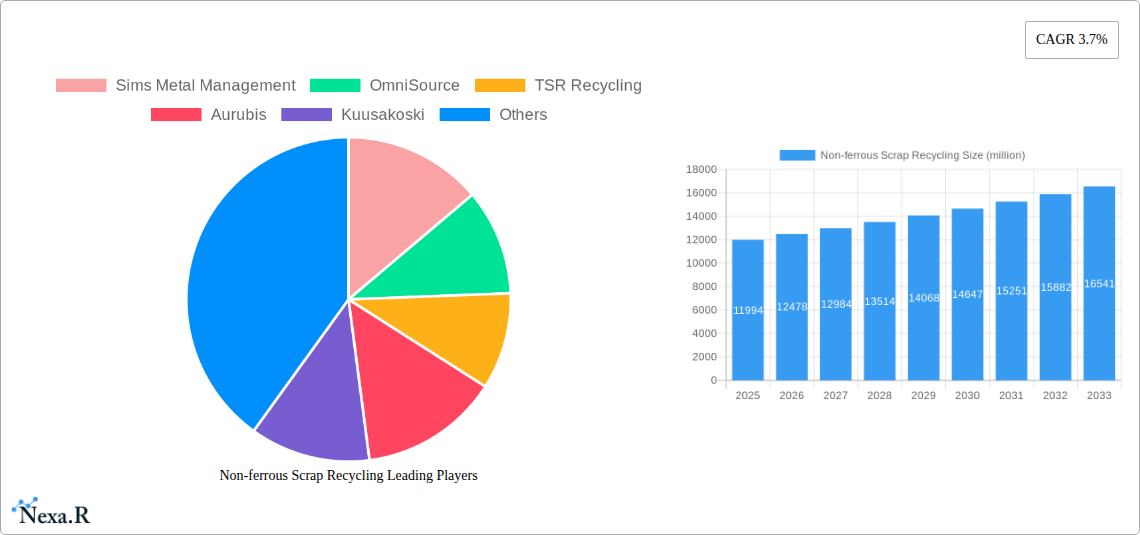
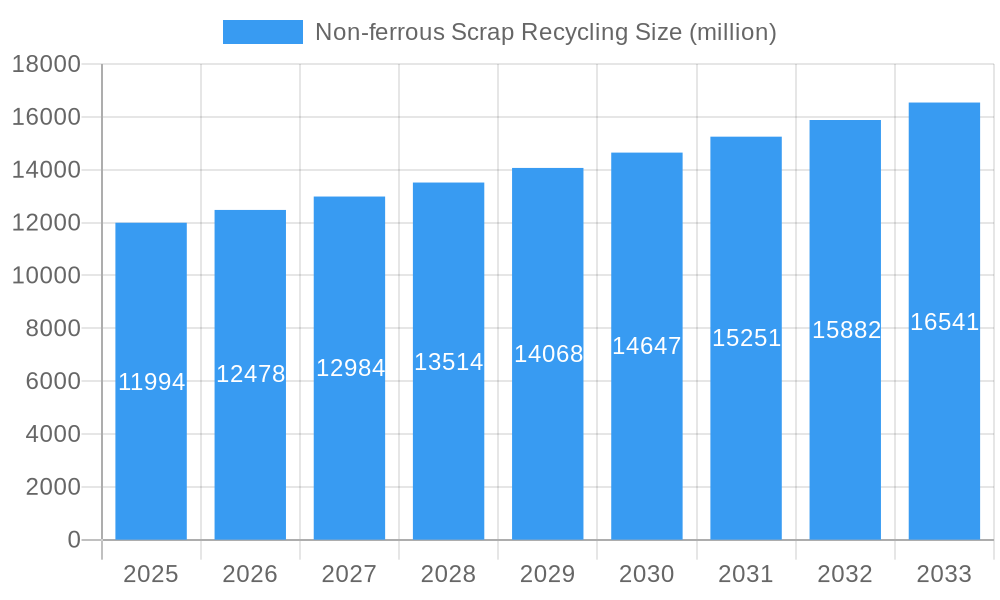
The non-ferrous scrap recycling market, valued at $11,994 million in 2025, is projected to experience steady growth, driven by increasing demand for recycled metals in various industries and growing environmental consciousness. A Compound Annual Growth Rate (CAGR) of 3.7% from 2025 to 2033 indicates a significant market expansion. Key drivers include the rising cost of virgin metals, stringent environmental regulations promoting sustainable practices, and advancements in recycling technologies leading to higher recovery rates and improved metal purity. The increasing adoption of electric vehicles, which utilize significant quantities of non-ferrous metals, further fuels market growth. Competition among established players like Sims Metal Management, OmniSource, TSR Recycling, Aurubis, Kuusakoski, Hindalco, Giampaolo Group, and Hanwa is expected to intensify, driving innovation and efficiency improvements within the sector. While challenges such as fluctuating commodity prices and the complexity of processing certain non-ferrous scrap materials exist, the overall market outlook remains positive, with considerable opportunities for growth and expansion in the coming years. The market segmentation, although not provided, is likely to be based on metal type (aluminum, copper, zinc, etc.), recycling process, and geographic location. Further research into these segments will provide more granular insights into this dynamic market.
Non-ferrous Scrap Recycling Market Size (In Billion)
The market's trajectory is influenced by global economic conditions. Periods of economic growth generally correlate with increased demand for metals, thereby increasing the value of scrap materials. Conversely, economic downturns might temporarily slow down the market's growth rate. However, long-term trends suggest that the demand for recycled non-ferrous metals will continue to rise, driven by sustainability concerns and resource scarcity. Companies are likely focusing on optimizing their recycling processes, expanding their geographical reach, and exploring new technologies to maintain a competitive edge. Strategic partnerships and mergers & acquisitions may also play a significant role in shaping the market landscape in the coming years. This signifies a promising future for the non-ferrous scrap recycling sector, with continued growth expected throughout the forecast period.
Non-ferrous Scrap Recycling Company Market Share
Non-ferrous Scrap Recycling Market Report: 2019-2033
This comprehensive report provides a detailed analysis of the global non-ferrous scrap recycling market, offering invaluable insights for industry professionals, investors, and strategic decision-makers. Covering the period from 2019 to 2033, with a base year of 2025, this report leverages advanced analytical techniques to forecast market trends and identify lucrative opportunities within this dynamic sector. The report segments the market by key players such as Sims Metal Management, OmniSource, TSR Recycling, Aurubis, Kuusakoski, Hindalco, Giampaolo Group, and Hanwa, providing a granular understanding of the competitive landscape. The parent market is Metal Recycling and the child market is Non-ferrous Scrap Recycling.
Non-ferrous Scrap Recycling Market Dynamics & Structure
This section analyzes the market structure, including market concentration, technological innovation, regulatory influences, competitive substitutes, end-user demographics, and merger & acquisition (M&A) activities within the non-ferrous scrap recycling industry. The global market size in 2025 is estimated at $xx billion.
- Market Concentration: The market is moderately concentrated, with the top five players holding approximately xx% of the market share in 2025. This is attributed to economies of scale and established recycling networks.
- Technological Innovation: Advancements in sorting technologies, automated processing, and material characterization are driving efficiency gains and value extraction from complex scrap streams. However, high initial investment costs pose a barrier to entry for smaller players.
- Regulatory Framework: Stringent environmental regulations concerning hazardous waste disposal and resource recovery are creating a favorable environment for recycling, driving adoption. Variations in regulations across regions impact market dynamics and create opportunities for specialized recyclers.
- Competitive Product Substitutes: The availability of primary metals presents a competitive challenge, but price volatility and environmental concerns are increasingly favoring recycled non-ferrous materials.
- End-User Demographics: The key end-users are found in the automotive, construction, electronics, and aerospace industries. Growth in these sectors fuels demand for recycled materials.
- M&A Trends: The past five years have witnessed xx M&A deals in the non-ferrous scrap recycling sector, primarily driven by the pursuit of scale, geographic expansion, and technological integration.
Non-ferrous Scrap Recycling Growth Trends & Insights
This section provides a detailed analysis of market size evolution, adoption rates, technological disruptions, and shifts in consumer behavior, using advanced analytical methodologies including time-series analysis and econometric modeling.
The global non-ferrous scrap recycling market is projected to experience robust growth during the forecast period (2025-2033), with a Compound Annual Growth Rate (CAGR) of xx%. This growth is primarily driven by increasing demand for recycled materials, stringent environmental regulations, and technological advancements that improve the efficiency and profitability of recycling processes. Market penetration is expected to increase from xx% in 2025 to xx% by 2033. Technological disruptions, such as AI-powered sorting systems, are streamlining operations and improving the quality of recycled materials. Growing awareness of environmental sustainability among consumers also influences the market growth.
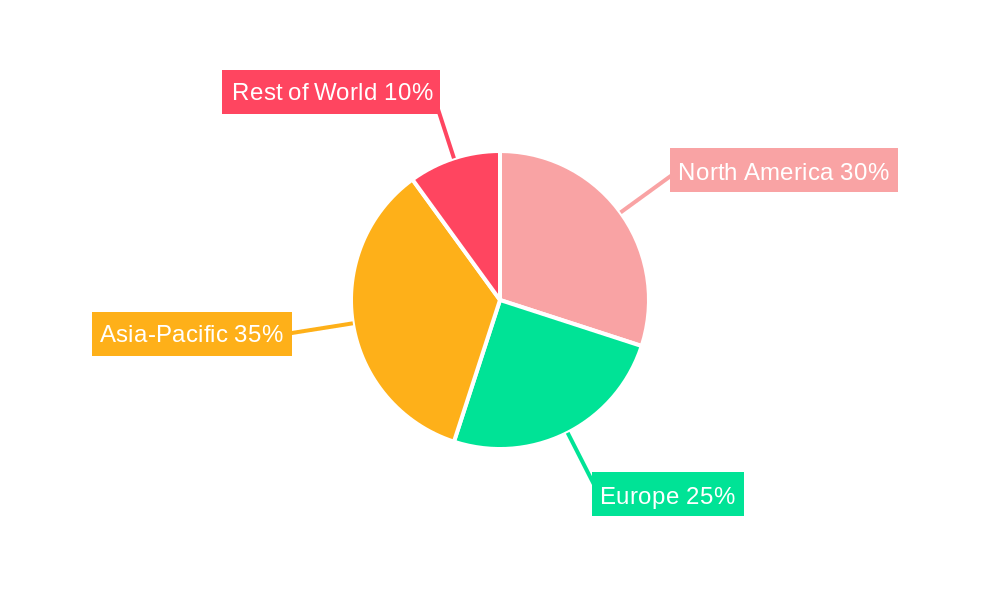
Dominant Regions, Countries, or Segments in Non-ferrous Scrap Recycling
This section identifies the leading geographical regions and segments driving market growth.
The North American and European regions are currently the dominant markets, accounting for approximately xx% of the global market share in 2025. However, Asia Pacific is projected to exhibit the fastest growth during the forecast period, driven by rapid industrialization and urbanization.
- Key Drivers for North America: Strong regulatory frameworks, well-established recycling infrastructure, and high demand from the automotive and construction industries.
- Key Drivers for Europe: Stringent environmental regulations, a mature recycling industry, and high consumer awareness of sustainability.
- Key Drivers for Asia Pacific: Rapid economic growth, increasing industrialization, and rising demand for recycled materials from various sectors.
Non-ferrous Scrap Recycling Product Landscape
The non-ferrous scrap recycling industry encompasses a range of products, including aluminum, copper, zinc, lead, and other precious metals. Recent innovations focus on improving the efficiency and quality of the recycling process. Advancements in automated sorting technologies and specialized processing techniques are enabling the recovery of higher-quality materials, leading to increased value extraction and broader applications in various industries. Unique selling propositions often center on high-purity recycled materials and sustainable sourcing practices.
Key Drivers, Barriers & Challenges in Non-ferrous Scrap Recycling
Key Drivers:
- Rising demand for recycled metals due to increasing metal prices and resource scarcity.
- Stringent environmental regulations promoting recycling and reducing waste.
- Technological advancements leading to higher efficiency and quality of recycled materials.
Key Challenges:
- Fluctuations in commodity prices impacting profitability.
- Complexities in processing mixed scrap streams.
- Lack of infrastructure and technology in developing economies.
- Competition from primary metal producers.
Emerging Opportunities in Non-ferrous Scrap Recycling
Emerging opportunities include the expansion into developing economies, the development of innovative recycling technologies for complex scrap streams, and the growth of circular economy initiatives. Untapped markets exist in the recycling of electronic waste and other specialized materials. The potential for strategic partnerships with technology providers and end-users offers significant growth potential.
Growth Accelerators in the Non-ferrous Scrap Recycling Industry
Long-term growth will be driven by technological advancements such as AI-powered sorting systems and the development of more efficient recycling processes. Strategic collaborations between recyclers and manufacturers to develop closed-loop systems, where recycled materials are directly integrated into manufacturing, are crucial for long-term sustainability and growth. Expansion into new geographical markets and the development of advanced recycling methods for complex materials will significantly influence market growth.
Key Players Shaping the Non-ferrous Scrap Recycling Market
- Sims Metal Management
- OmniSource
- TSR Recycling
- Aurubis
- Kuusakoski
- Hindalco
- Giampaolo Group
- Hanwa
Notable Milestones in Non-ferrous Scrap Recycling Sector
- 2021: Introduction of AI-powered sorting technology by [Company Name].
- 2022: Sims Metal Management acquired [Company Name], expanding its global reach.
- 2023: Implementation of new environmental regulations in [Region] increased demand for recycled metals.
In-Depth Non-ferrous Scrap Recycling Market Outlook
The non-ferrous scrap recycling market is poised for significant growth in the coming years, driven by a convergence of factors including increasing demand for sustainable materials, technological advancements, and supportive government policies. Strategic partnerships, technological innovation, and expansion into new markets represent key opportunities for market players to capture significant market share and drive long-term growth. The market is expected to reach $xx billion by 2033.
Non-ferrous Scrap Recycling Segmentation
-
1. Application
- 1.1. Construction
- 1.2. Automotive
- 1.3. Consumer Goods
- 1.4. Industrial Goods
- 1.5. Others
-
2. Types
- 2.1. Aluminum Scrap Recycling
- 2.2. Copper Scrap Recycling
- 2.3. Lead Scrap Recycling
- 2.4. Others
Non-ferrous Scrap Recycling Segmentation By Geography
-
1. North America
- 1.1. United States
- 1.2. Canada
- 1.3. Mexico
-
2. South America
- 2.1. Brazil
- 2.2. Argentina
- 2.3. Rest of South America
-
3. Europe
- 3.1. United Kingdom
- 3.2. Germany
- 3.3. France
- 3.4. Italy
- 3.5. Spain
- 3.6. Russia
- 3.7. Benelux
- 3.8. Nordics
- 3.9. Rest of Europe
-
4. Middle East & Africa
- 4.1. Turkey
- 4.2. Israel
- 4.3. GCC
- 4.4. North Africa
- 4.5. South Africa
- 4.6. Rest of Middle East & Africa
-
5. Asia Pacific
- 5.1. China
- 5.2. India
- 5.3. Japan
- 5.4. South Korea
- 5.5. ASEAN
- 5.6. Oceania
- 5.7. Rest of Asia Pacific
Non-ferrous Scrap Recycling Regional Market Share
Geographic Coverage of Non-ferrous Scrap Recycling
Non-ferrous Scrap Recycling REPORT HIGHLIGHTS
| Aspects | Details |
|---|---|
| Study Period | 2020-2034 |
| Base Year | 2025 |
| Estimated Year | 2026 |
| Forecast Period | 2026-2034 |
| Historical Period | 2020-2025 |
| Growth Rate | CAGR of 3.7% from 2020-2034 |
| Segmentation |
|
Table of Contents
- 1. Introduction
- 1.1. Research Scope
- 1.2. Market Segmentation
- 1.3. Research Methodology
- 1.4. Definitions and Assumptions
- 2. Executive Summary
- 2.1. Introduction
- 3. Market Dynamics
- 3.1. Introduction
- 3.2. Market Drivers
- 3.3. Market Restrains
- 3.4. Market Trends
- 4. Market Factor Analysis
- 4.1. Porters Five Forces
- 4.2. Supply/Value Chain
- 4.3. PESTEL analysis
- 4.4. Market Entropy
- 4.5. Patent/Trademark Analysis
- 5. Global Non-ferrous Scrap Recycling Analysis, Insights and Forecast, 2020-2032
- 5.1. Market Analysis, Insights and Forecast - by Application
- 5.1.1. Construction
- 5.1.2. Automotive
- 5.1.3. Consumer Goods
- 5.1.4. Industrial Goods
- 5.1.5. Others
- 5.2. Market Analysis, Insights and Forecast - by Types
- 5.2.1. Aluminum Scrap Recycling
- 5.2.2. Copper Scrap Recycling
- 5.2.3. Lead Scrap Recycling
- 5.2.4. Others
- 5.3. Market Analysis, Insights and Forecast - by Region
- 5.3.1. North America
- 5.3.2. South America
- 5.3.3. Europe
- 5.3.4. Middle East & Africa
- 5.3.5. Asia Pacific
- 5.1. Market Analysis, Insights and Forecast - by Application
- 6. North America Non-ferrous Scrap Recycling Analysis, Insights and Forecast, 2020-2032
- 6.1. Market Analysis, Insights and Forecast - by Application
- 6.1.1. Construction
- 6.1.2. Automotive
- 6.1.3. Consumer Goods
- 6.1.4. Industrial Goods
- 6.1.5. Others
- 6.2. Market Analysis, Insights and Forecast - by Types
- 6.2.1. Aluminum Scrap Recycling
- 6.2.2. Copper Scrap Recycling
- 6.2.3. Lead Scrap Recycling
- 6.2.4. Others
- 6.1. Market Analysis, Insights and Forecast - by Application
- 7. South America Non-ferrous Scrap Recycling Analysis, Insights and Forecast, 2020-2032
- 7.1. Market Analysis, Insights and Forecast - by Application
- 7.1.1. Construction
- 7.1.2. Automotive
- 7.1.3. Consumer Goods
- 7.1.4. Industrial Goods
- 7.1.5. Others
- 7.2. Market Analysis, Insights and Forecast - by Types
- 7.2.1. Aluminum Scrap Recycling
- 7.2.2. Copper Scrap Recycling
- 7.2.3. Lead Scrap Recycling
- 7.2.4. Others
- 7.1. Market Analysis, Insights and Forecast - by Application
- 8. Europe Non-ferrous Scrap Recycling Analysis, Insights and Forecast, 2020-2032
- 8.1. Market Analysis, Insights and Forecast - by Application
- 8.1.1. Construction
- 8.1.2. Automotive
- 8.1.3. Consumer Goods
- 8.1.4. Industrial Goods
- 8.1.5. Others
- 8.2. Market Analysis, Insights and Forecast - by Types
- 8.2.1. Aluminum Scrap Recycling
- 8.2.2. Copper Scrap Recycling
- 8.2.3. Lead Scrap Recycling
- 8.2.4. Others
- 8.1. Market Analysis, Insights and Forecast - by Application
- 9. Middle East & Africa Non-ferrous Scrap Recycling Analysis, Insights and Forecast, 2020-2032
- 9.1. Market Analysis, Insights and Forecast - by Application
- 9.1.1. Construction
- 9.1.2. Automotive
- 9.1.3. Consumer Goods
- 9.1.4. Industrial Goods
- 9.1.5. Others
- 9.2. Market Analysis, Insights and Forecast - by Types
- 9.2.1. Aluminum Scrap Recycling
- 9.2.2. Copper Scrap Recycling
- 9.2.3. Lead Scrap Recycling
- 9.2.4. Others
- 9.1. Market Analysis, Insights and Forecast - by Application
- 10. Asia Pacific Non-ferrous Scrap Recycling Analysis, Insights and Forecast, 2020-2032
- 10.1. Market Analysis, Insights and Forecast - by Application
- 10.1.1. Construction
- 10.1.2. Automotive
- 10.1.3. Consumer Goods
- 10.1.4. Industrial Goods
- 10.1.5. Others
- 10.2. Market Analysis, Insights and Forecast - by Types
- 10.2.1. Aluminum Scrap Recycling
- 10.2.2. Copper Scrap Recycling
- 10.2.3. Lead Scrap Recycling
- 10.2.4. Others
- 10.1. Market Analysis, Insights and Forecast - by Application
- 11. Competitive Analysis
- 11.1. Global Market Share Analysis 2025
- 11.2. Company Profiles
- 11.2.1 Sims Metal Management
- 11.2.1.1. Overview
- 11.2.1.2. Products
- 11.2.1.3. SWOT Analysis
- 11.2.1.4. Recent Developments
- 11.2.1.5. Financials (Based on Availability)
- 11.2.2 OmniSource
- 11.2.2.1. Overview
- 11.2.2.2. Products
- 11.2.2.3. SWOT Analysis
- 11.2.2.4. Recent Developments
- 11.2.2.5. Financials (Based on Availability)
- 11.2.3 TSR Recycling
- 11.2.3.1. Overview
- 11.2.3.2. Products
- 11.2.3.3. SWOT Analysis
- 11.2.3.4. Recent Developments
- 11.2.3.5. Financials (Based on Availability)
- 11.2.4 Aurubis
- 11.2.4.1. Overview
- 11.2.4.2. Products
- 11.2.4.3. SWOT Analysis
- 11.2.4.4. Recent Developments
- 11.2.4.5. Financials (Based on Availability)
- 11.2.5 Kuusakoski
- 11.2.5.1. Overview
- 11.2.5.2. Products
- 11.2.5.3. SWOT Analysis
- 11.2.5.4. Recent Developments
- 11.2.5.5. Financials (Based on Availability)
- 11.2.6 Hindalco
- 11.2.6.1. Overview
- 11.2.6.2. Products
- 11.2.6.3. SWOT Analysis
- 11.2.6.4. Recent Developments
- 11.2.6.5. Financials (Based on Availability)
- 11.2.7 Giampaolo Group
- 11.2.7.1. Overview
- 11.2.7.2. Products
- 11.2.7.3. SWOT Analysis
- 11.2.7.4. Recent Developments
- 11.2.7.5. Financials (Based on Availability)
- 11.2.8 Hanwa
- 11.2.8.1. Overview
- 11.2.8.2. Products
- 11.2.8.3. SWOT Analysis
- 11.2.8.4. Recent Developments
- 11.2.8.5. Financials (Based on Availability)
- 11.2.1 Sims Metal Management
List of Figures
- Figure 1: Global Non-ferrous Scrap Recycling Revenue Breakdown (million, %) by Region 2025 & 2033
- Figure 2: North America Non-ferrous Scrap Recycling Revenue (million), by Application 2025 & 2033
- Figure 3: North America Non-ferrous Scrap Recycling Revenue Share (%), by Application 2025 & 2033
- Figure 4: North America Non-ferrous Scrap Recycling Revenue (million), by Types 2025 & 2033
- Figure 5: North America Non-ferrous Scrap Recycling Revenue Share (%), by Types 2025 & 2033
- Figure 6: North America Non-ferrous Scrap Recycling Revenue (million), by Country 2025 & 2033
- Figure 7: North America Non-ferrous Scrap Recycling Revenue Share (%), by Country 2025 & 2033
- Figure 8: South America Non-ferrous Scrap Recycling Revenue (million), by Application 2025 & 2033
- Figure 9: South America Non-ferrous Scrap Recycling Revenue Share (%), by Application 2025 & 2033
- Figure 10: South America Non-ferrous Scrap Recycling Revenue (million), by Types 2025 & 2033
- Figure 11: South America Non-ferrous Scrap Recycling Revenue Share (%), by Types 2025 & 2033
- Figure 12: South America Non-ferrous Scrap Recycling Revenue (million), by Country 2025 & 2033
- Figure 13: South America Non-ferrous Scrap Recycling Revenue Share (%), by Country 2025 & 2033
- Figure 14: Europe Non-ferrous Scrap Recycling Revenue (million), by Application 2025 & 2033
- Figure 15: Europe Non-ferrous Scrap Recycling Revenue Share (%), by Application 2025 & 2033
- Figure 16: Europe Non-ferrous Scrap Recycling Revenue (million), by Types 2025 & 2033
- Figure 17: Europe Non-ferrous Scrap Recycling Revenue Share (%), by Types 2025 & 2033
- Figure 18: Europe Non-ferrous Scrap Recycling Revenue (million), by Country 2025 & 2033
- Figure 19: Europe Non-ferrous Scrap Recycling Revenue Share (%), by Country 2025 & 2033
- Figure 20: Middle East & Africa Non-ferrous Scrap Recycling Revenue (million), by Application 2025 & 2033
- Figure 21: Middle East & Africa Non-ferrous Scrap Recycling Revenue Share (%), by Application 2025 & 2033
- Figure 22: Middle East & Africa Non-ferrous Scrap Recycling Revenue (million), by Types 2025 & 2033
- Figure 23: Middle East & Africa Non-ferrous Scrap Recycling Revenue Share (%), by Types 2025 & 2033
- Figure 24: Middle East & Africa Non-ferrous Scrap Recycling Revenue (million), by Country 2025 & 2033
- Figure 25: Middle East & Africa Non-ferrous Scrap Recycling Revenue Share (%), by Country 2025 & 2033
- Figure 26: Asia Pacific Non-ferrous Scrap Recycling Revenue (million), by Application 2025 & 2033
- Figure 27: Asia Pacific Non-ferrous Scrap Recycling Revenue Share (%), by Application 2025 & 2033
- Figure 28: Asia Pacific Non-ferrous Scrap Recycling Revenue (million), by Types 2025 & 2033
- Figure 29: Asia Pacific Non-ferrous Scrap Recycling Revenue Share (%), by Types 2025 & 2033
- Figure 30: Asia Pacific Non-ferrous Scrap Recycling Revenue (million), by Country 2025 & 2033
- Figure 31: Asia Pacific Non-ferrous Scrap Recycling Revenue Share (%), by Country 2025 & 2033
List of Tables
- Table 1: Global Non-ferrous Scrap Recycling Revenue million Forecast, by Application 2020 & 2033
- Table 2: Global Non-ferrous Scrap Recycling Revenue million Forecast, by Types 2020 & 2033
- Table 3: Global Non-ferrous Scrap Recycling Revenue million Forecast, by Region 2020 & 2033
- Table 4: Global Non-ferrous Scrap Recycling Revenue million Forecast, by Application 2020 & 2033
- Table 5: Global Non-ferrous Scrap Recycling Revenue million Forecast, by Types 2020 & 2033
- Table 6: Global Non-ferrous Scrap Recycling Revenue million Forecast, by Country 2020 & 2033
- Table 7: United States Non-ferrous Scrap Recycling Revenue (million) Forecast, by Application 2020 & 2033
- Table 8: Canada Non-ferrous Scrap Recycling Revenue (million) Forecast, by Application 2020 & 2033
- Table 9: Mexico Non-ferrous Scrap Recycling Revenue (million) Forecast, by Application 2020 & 2033
- Table 10: Global Non-ferrous Scrap Recycling Revenue million Forecast, by Application 2020 & 2033
- Table 11: Global Non-ferrous Scrap Recycling Revenue million Forecast, by Types 2020 & 2033
- Table 12: Global Non-ferrous Scrap Recycling Revenue million Forecast, by Country 2020 & 2033
- Table 13: Brazil Non-ferrous Scrap Recycling Revenue (million) Forecast, by Application 2020 & 2033
- Table 14: Argentina Non-ferrous Scrap Recycling Revenue (million) Forecast, by Application 2020 & 2033
- Table 15: Rest of South America Non-ferrous Scrap Recycling Revenue (million) Forecast, by Application 2020 & 2033
- Table 16: Global Non-ferrous Scrap Recycling Revenue million Forecast, by Application 2020 & 2033
- Table 17: Global Non-ferrous Scrap Recycling Revenue million Forecast, by Types 2020 & 2033
- Table 18: Global Non-ferrous Scrap Recycling Revenue million Forecast, by Country 2020 & 2033
- Table 19: United Kingdom Non-ferrous Scrap Recycling Revenue (million) Forecast, by Application 2020 & 2033
- Table 20: Germany Non-ferrous Scrap Recycling Revenue (million) Forecast, by Application 2020 & 2033
- Table 21: France Non-ferrous Scrap Recycling Revenue (million) Forecast, by Application 2020 & 2033
- Table 22: Italy Non-ferrous Scrap Recycling Revenue (million) Forecast, by Application 2020 & 2033
- Table 23: Spain Non-ferrous Scrap Recycling Revenue (million) Forecast, by Application 2020 & 2033
- Table 24: Russia Non-ferrous Scrap Recycling Revenue (million) Forecast, by Application 2020 & 2033
- Table 25: Benelux Non-ferrous Scrap Recycling Revenue (million) Forecast, by Application 2020 & 2033
- Table 26: Nordics Non-ferrous Scrap Recycling Revenue (million) Forecast, by Application 2020 & 2033
- Table 27: Rest of Europe Non-ferrous Scrap Recycling Revenue (million) Forecast, by Application 2020 & 2033
- Table 28: Global Non-ferrous Scrap Recycling Revenue million Forecast, by Application 2020 & 2033
- Table 29: Global Non-ferrous Scrap Recycling Revenue million Forecast, by Types 2020 & 2033
- Table 30: Global Non-ferrous Scrap Recycling Revenue million Forecast, by Country 2020 & 2033
- Table 31: Turkey Non-ferrous Scrap Recycling Revenue (million) Forecast, by Application 2020 & 2033
- Table 32: Israel Non-ferrous Scrap Recycling Revenue (million) Forecast, by Application 2020 & 2033
- Table 33: GCC Non-ferrous Scrap Recycling Revenue (million) Forecast, by Application 2020 & 2033
- Table 34: North Africa Non-ferrous Scrap Recycling Revenue (million) Forecast, by Application 2020 & 2033
- Table 35: South Africa Non-ferrous Scrap Recycling Revenue (million) Forecast, by Application 2020 & 2033
- Table 36: Rest of Middle East & Africa Non-ferrous Scrap Recycling Revenue (million) Forecast, by Application 2020 & 2033
- Table 37: Global Non-ferrous Scrap Recycling Revenue million Forecast, by Application 2020 & 2033
- Table 38: Global Non-ferrous Scrap Recycling Revenue million Forecast, by Types 2020 & 2033
- Table 39: Global Non-ferrous Scrap Recycling Revenue million Forecast, by Country 2020 & 2033
- Table 40: China Non-ferrous Scrap Recycling Revenue (million) Forecast, by Application 2020 & 2033
- Table 41: India Non-ferrous Scrap Recycling Revenue (million) Forecast, by Application 2020 & 2033
- Table 42: Japan Non-ferrous Scrap Recycling Revenue (million) Forecast, by Application 2020 & 2033
- Table 43: South Korea Non-ferrous Scrap Recycling Revenue (million) Forecast, by Application 2020 & 2033
- Table 44: ASEAN Non-ferrous Scrap Recycling Revenue (million) Forecast, by Application 2020 & 2033
- Table 45: Oceania Non-ferrous Scrap Recycling Revenue (million) Forecast, by Application 2020 & 2033
- Table 46: Rest of Asia Pacific Non-ferrous Scrap Recycling Revenue (million) Forecast, by Application 2020 & 2033
Frequently Asked Questions
1. What is the projected Compound Annual Growth Rate (CAGR) of the Non-ferrous Scrap Recycling?
The projected CAGR is approximately 3.7%.
2. Which companies are prominent players in the Non-ferrous Scrap Recycling?
Key companies in the market include Sims Metal Management, OmniSource, TSR Recycling, Aurubis, Kuusakoski, Hindalco, Giampaolo Group, Hanwa.
3. What are the main segments of the Non-ferrous Scrap Recycling?
The market segments include Application, Types.
4. Can you provide details about the market size?
The market size is estimated to be USD 119940 million as of 2022.
5. What are some drivers contributing to market growth?
N/A
6. What are the notable trends driving market growth?
N/A
7. Are there any restraints impacting market growth?
N/A
8. Can you provide examples of recent developments in the market?
N/A
9. What pricing options are available for accessing the report?
Pricing options include single-user, multi-user, and enterprise licenses priced at USD 5600.00, USD 8400.00, and USD 11200.00 respectively.
10. Is the market size provided in terms of value or volume?
The market size is provided in terms of value, measured in million.
11. Are there any specific market keywords associated with the report?
Yes, the market keyword associated with the report is "Non-ferrous Scrap Recycling," which aids in identifying and referencing the specific market segment covered.
12. How do I determine which pricing option suits my needs best?
The pricing options vary based on user requirements and access needs. Individual users may opt for single-user licenses, while businesses requiring broader access may choose multi-user or enterprise licenses for cost-effective access to the report.
13. Are there any additional resources or data provided in the Non-ferrous Scrap Recycling report?
While the report offers comprehensive insights, it's advisable to review the specific contents or supplementary materials provided to ascertain if additional resources or data are available.
14. How can I stay updated on further developments or reports in the Non-ferrous Scrap Recycling?
To stay informed about further developments, trends, and reports in the Non-ferrous Scrap Recycling, consider subscribing to industry newsletters, following relevant companies and organizations, or regularly checking reputable industry news sources and publications.
Methodology
Step 1 - Identification of Relevant Samples Size from Population Database


Step 2 - Approaches for Defining Global Market Size (Value, Volume* & Price*)

Note*: In applicable scenarios
Step 3 - Data Sources
Primary Research
- Web Analytics
- Survey Reports
- Research Institute
- Latest Research Reports
- Opinion Leaders
Secondary Research
- Annual Reports
- White Paper
- Latest Press Release
- Industry Association
- Paid Database
- Investor Presentations

Step 4 - Data Triangulation
Involves using different sources of information in order to increase the validity of a study
These sources are likely to be stakeholders in a program - participants, other researchers, program staff, other community members, and so on.
Then we put all data in single framework & apply various statistical tools to find out the dynamic on the market.
During the analysis stage, feedback from the stakeholder groups would be compared to determine areas of agreement as well as areas of divergence