

Key Insights
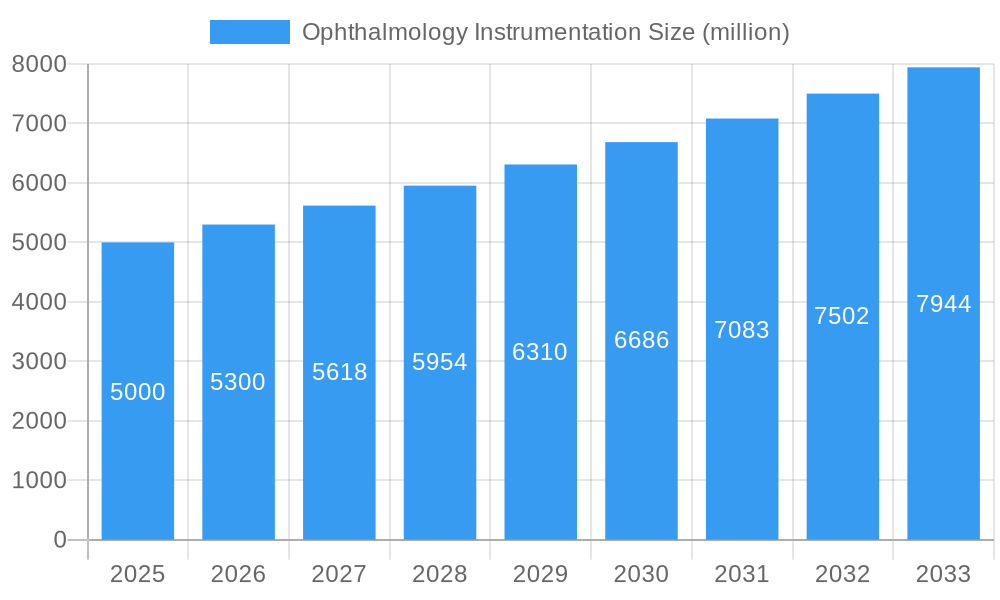
The global ophthalmology instrumentation market is poised for significant expansion, propelled by the increasing incidence of age-related eye conditions such as cataracts and glaucoma, alongside a growing elderly demographic. Technological innovations, including advancements in minimally invasive surgical procedures and sophisticated imaging technologies, are primary drivers of this growth. The rising demand for advanced diagnostic equipment and superior surgical instruments directly contributes to improved treatment outcomes and enhanced patient care, thereby boosting market valuation. Although initial challenges such as high capital expenditure and a scarcity of specialized professionals, especially in developing economies, were noted, these are being effectively addressed through augmented healthcare investments, supportive government policies for eye health, and the proliferation of specialized training initiatives. The market is segmented by product category (diagnostic, surgical, and consumables), end-user facilities (hospitals, ophthalmology practices, and outpatient surgical centers), and geographical distribution. Leading entities such as Duckworth & Kent Ltd, Aurolab, and Neitz are actively pursuing product development and strategic alliances to solidify their market positions. We project the market size for 2025 to reach $76.02 billion, with an anticipated Compound Annual Growth Rate (CAGR) of 4.9% between 2025 and 2033, signifying sustained robust growth.
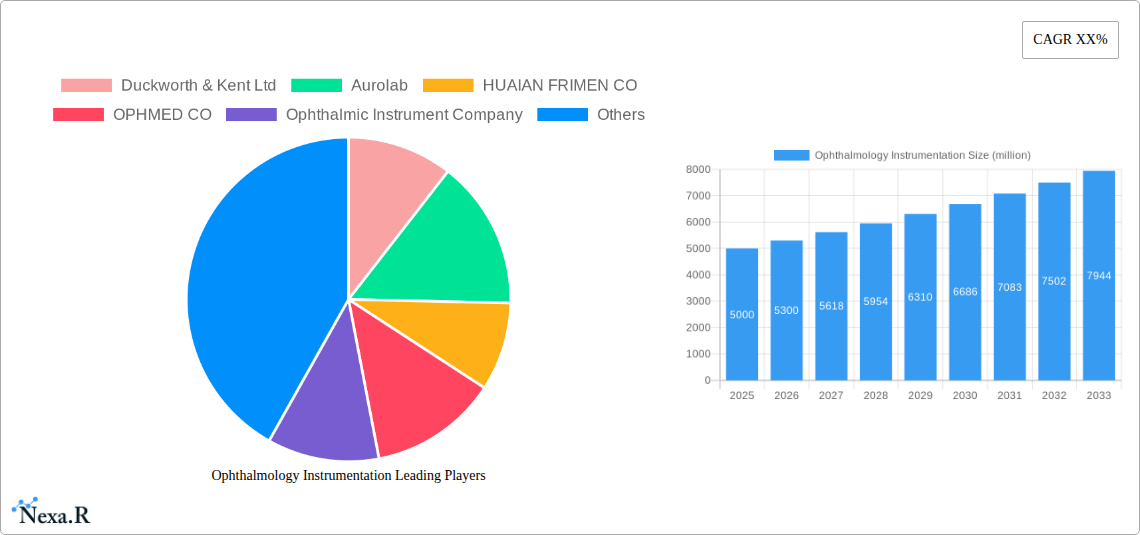
Ophthalmology Instrumentation Market Size (In Billion)
The forecast horizon (2025-2033) presents substantial avenues for market proliferation. Growth is expected to be particularly vigorous in regions characterized by rapidly advancing healthcare infrastructure and escalating consumer purchasing power. The integration of artificial intelligence and machine learning within ophthalmology instrumentation holds the potential to elevate diagnostic precision and therapeutic effectiveness, fueling further market expansion. Nevertheless, navigating regulatory complexities and evolving reimbursement frameworks may impact market penetration in specific territories. Companies are strategically focusing on developing affordable solutions and expanding their logistical reach to penetrate underserved markets, effectively mitigating existing market barriers. The future trajectory of the market is contingent upon continuous technological innovation, favorable regulatory environments, and strategic approaches to manage escalating healthcare expenditures related to eye care. Intensified competition is anticipated as new entrants introduce novel products and services.
Ophthalmology Instrumentation Company Market Share
Ophthalmology Instrumentation Market Report: 2019-2033
This comprehensive report provides an in-depth analysis of the Ophthalmology Instrumentation market, encompassing market dynamics, growth trends, regional performance, product landscape, key players, and future outlook. The study period covers 2019-2033, with 2025 serving as the base and estimated year. The forecast period spans 2025-2033, and the historical period encompasses 2019-2024. This report is invaluable for ophthalmologists, investors, and industry professionals seeking a detailed understanding of this dynamic sector. The market size is projected to reach xx million units by 2033.
Ophthalmology Instrumentation Market Dynamics & Structure
The global ophthalmology instrumentation market is characterized by moderate concentration, with a few major players holding significant market share. Technological innovation, driven by advancements in imaging, laser technology, and minimally invasive surgical techniques, is a key growth driver. Stringent regulatory frameworks governing medical device approvals influence market entry and product development. The market also experiences competition from substitute technologies, particularly in certain diagnostic procedures. The end-user demographic is expanding due to aging populations and rising prevalence of eye diseases. Consolidation through mergers and acquisitions (M&A) is observed, with xx M&A deals recorded between 2019 and 2024.
- Market Concentration: Moderately concentrated, with top 5 players holding approximately xx% market share in 2024.
- Technological Innovation: Key drivers include advancements in OCT, laser systems, and micro-surgical tools. Innovation barriers include high R&D costs and stringent regulatory approvals.
- Regulatory Frameworks: Stringent regulatory pathways (e.g., FDA, CE marking) impact time-to-market and product development costs.
- Competitive Product Substitutes: Alternative diagnostic and treatment methods pose competitive challenges in specific niches.
- End-User Demographics: Aging populations and increased prevalence of age-related eye diseases fuel market growth.
- M&A Trends: xx M&A deals between 2019 and 2024, indicating consolidation within the sector.
Ophthalmology Instrumentation Growth Trends & Insights
The ophthalmology instrumentation market exhibits a steady growth trajectory, driven by increasing demand for advanced diagnostic and surgical tools. The market size, valued at xx million units in 2024, is projected to reach xx million units by 2033, exhibiting a CAGR of xx% during the forecast period. This growth is fueled by technological advancements leading to improved treatment outcomes and increased patient preference for minimally invasive procedures. The adoption rate of new technologies varies across regions, with developed markets exhibiting higher penetration. Changing consumer behavior, including increased awareness and demand for advanced eye care, further contributes to market expansion. Market penetration is expected to increase from xx% in 2024 to xx% by 2033.
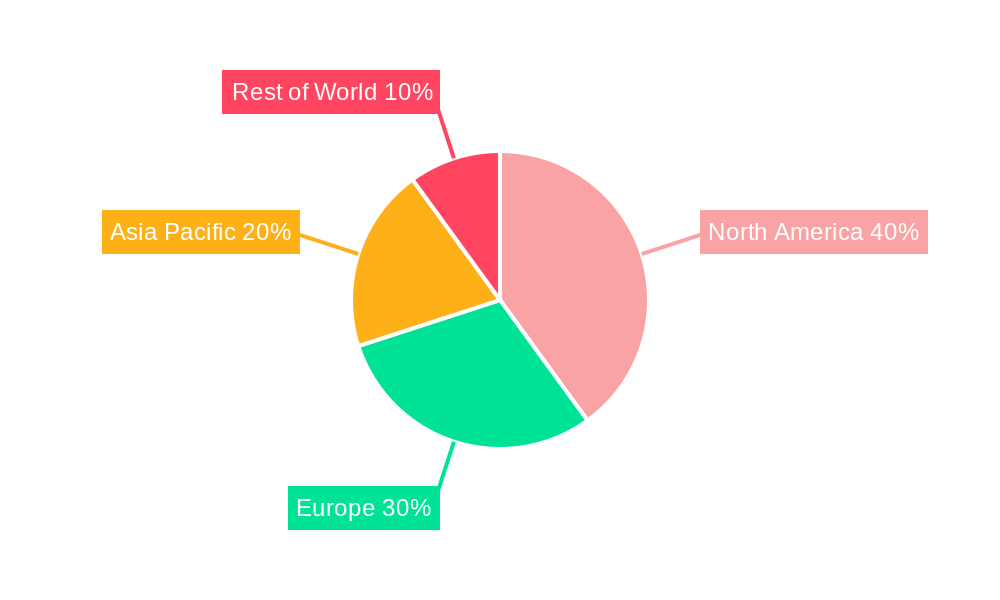
Dominant Regions, Countries, or Segments in Ophthalmology Instrumentation
North America currently dominates the ophthalmology instrumentation market, driven by high healthcare expenditure, advanced infrastructure, and a large aging population. Europe follows as a significant market, with strong regulatory frameworks and a focus on technological advancements. The Asia-Pacific region presents substantial growth potential, fueled by increasing healthcare spending and rising prevalence of eye diseases.
- North America: High healthcare expenditure, advanced infrastructure, large aging population.
- Europe: Strong regulatory frameworks, focus on technological advancements.
- Asia-Pacific: Increasing healthcare spending, rising prevalence of eye diseases, untapped market potential.
- Key Drivers: Government initiatives promoting eye care, technological advancements, increasing disposable incomes.
Ophthalmology Instrumentation Product Landscape
The ophthalmology instrumentation market encompasses a wide range of products, including diagnostic devices (OCT, fundus cameras), surgical instruments (laser systems, phacoemulsifiers), and intraocular lenses. Continuous innovation results in enhanced image quality, improved precision, and minimally invasive procedures. Unique selling propositions frequently focus on speed, precision, and ease of use. Technological advancements like AI integration improve diagnostic accuracy and streamline surgical workflows.
Key Drivers, Barriers & Challenges in Ophthalmology Instrumentation
Key Drivers: Technological advancements leading to minimally invasive procedures, increasing prevalence of age-related eye diseases, rising healthcare expenditure, and government initiatives promoting eye health.
Challenges: High cost of advanced instruments, stringent regulatory requirements, competition from substitute technologies, and supply chain disruptions impacting the availability of components. These factors collectively exert a xx% negative impact on market growth.
Emerging Opportunities in Ophthalmology Instrumentation
Emerging opportunities exist in developing markets with expanding healthcare infrastructure and untapped potential. Innovative applications of AI and machine learning in diagnostics and surgery promise to revolutionize ophthalmic care. Teleophthalmology and remote patient monitoring present new avenues for efficient and accessible eye care.
Growth Accelerators in the Ophthalmology Instrumentation Industry
Strategic partnerships between instrument manufacturers and healthcare providers drive market expansion. Technological breakthroughs in areas like gene therapy and regenerative medicine open new treatment avenues, stimulating demand for associated instrumentation. Expansion into underserved markets and the development of cost-effective devices increase accessibility and broaden market reach.
Key Players Shaping the Ophthalmology Instrumentation Market
- Duckworth & Kent Ltd
- Aurolab
- HUAIAN FRIMEN CO
- OPHMED CO
- Ophthalmic Instrument Company
- Zabbys
- Rumex
- Neitz
- Takagi
Notable Milestones in Ophthalmology Instrumentation Sector
- 2020: FDA approval of a novel laser system for cataract surgery.
- 2022: Launch of a new generation OCT device with enhanced image resolution.
- 2023: Acquisition of a smaller ophthalmic instrument company by a major player.
In-Depth Ophthalmology Instrumentation Market Outlook
The ophthalmology instrumentation market is poised for continued growth, driven by technological advancements, expanding healthcare infrastructure, and a rising prevalence of eye diseases. Strategic investments in R&D, strategic partnerships, and expansion into emerging markets offer significant opportunities for growth and market share expansion. The market's future success hinges on innovation, accessibility, and affordability of advanced ophthalmic instruments.
Ophthalmology Instrumentation Segmentation
-
1. Application
- 1.1. General Hospitals
- 1.2. Ophthalmic Hospitals
- 1.3. Others
-
2. Types
- 2.1. Ophthalmic Forceps
- 2.2. Ophthalmic Scissors
- 2.3. Ophthalmic Cannulas
- 2.4. Others
Ophthalmology Instrumentation Segmentation By Geography
-
1. North America
- 1.1. United States
- 1.2. Canada
- 1.3. Mexico
-
2. South America
- 2.1. Brazil
- 2.2. Argentina
- 2.3. Rest of South America
-
3. Europe
- 3.1. United Kingdom
- 3.2. Germany
- 3.3. France
- 3.4. Italy
- 3.5. Spain
- 3.6. Russia
- 3.7. Benelux
- 3.8. Nordics
- 3.9. Rest of Europe
-
4. Middle East & Africa
- 4.1. Turkey
- 4.2. Israel
- 4.3. GCC
- 4.4. North Africa
- 4.5. South Africa
- 4.6. Rest of Middle East & Africa
-
5. Asia Pacific
- 5.1. China
- 5.2. India
- 5.3. Japan
- 5.4. South Korea
- 5.5. ASEAN
- 5.6. Oceania
- 5.7. Rest of Asia Pacific
Ophthalmology Instrumentation Regional Market Share
Geographic Coverage of Ophthalmology Instrumentation
Ophthalmology Instrumentation REPORT HIGHLIGHTS
| Aspects | Details |
|---|---|
| Study Period | 2020-2034 |
| Base Year | 2025 |
| Estimated Year | 2026 |
| Forecast Period | 2026-2034 |
| Historical Period | 2020-2025 |
| Growth Rate | CAGR of 4.9% from 2020-2034 |
| Segmentation |
|
Table of Contents
- 1. Introduction
- 1.1. Research Scope
- 1.2. Market Segmentation
- 1.3. Research Methodology
- 1.4. Definitions and Assumptions
- 2. Executive Summary
- 2.1. Introduction
- 3. Market Dynamics
- 3.1. Introduction
- 3.2. Market Drivers
- 3.3. Market Restrains
- 3.4. Market Trends
- 4. Market Factor Analysis
- 4.1. Porters Five Forces
- 4.2. Supply/Value Chain
- 4.3. PESTEL analysis
- 4.4. Market Entropy
- 4.5. Patent/Trademark Analysis
- 5. Global Ophthalmology Instrumentation Analysis, Insights and Forecast, 2020-2032
- 5.1. Market Analysis, Insights and Forecast - by Application
- 5.1.1. General Hospitals
- 5.1.2. Ophthalmic Hospitals
- 5.1.3. Others
- 5.2. Market Analysis, Insights and Forecast - by Types
- 5.2.1. Ophthalmic Forceps
- 5.2.2. Ophthalmic Scissors
- 5.2.3. Ophthalmic Cannulas
- 5.2.4. Others
- 5.3. Market Analysis, Insights and Forecast - by Region
- 5.3.1. North America
- 5.3.2. South America
- 5.3.3. Europe
- 5.3.4. Middle East & Africa
- 5.3.5. Asia Pacific
- 5.1. Market Analysis, Insights and Forecast - by Application
- 6. North America Ophthalmology Instrumentation Analysis, Insights and Forecast, 2020-2032
- 6.1. Market Analysis, Insights and Forecast - by Application
- 6.1.1. General Hospitals
- 6.1.2. Ophthalmic Hospitals
- 6.1.3. Others
- 6.2. Market Analysis, Insights and Forecast - by Types
- 6.2.1. Ophthalmic Forceps
- 6.2.2. Ophthalmic Scissors
- 6.2.3. Ophthalmic Cannulas
- 6.2.4. Others
- 6.1. Market Analysis, Insights and Forecast - by Application
- 7. South America Ophthalmology Instrumentation Analysis, Insights and Forecast, 2020-2032
- 7.1. Market Analysis, Insights and Forecast - by Application
- 7.1.1. General Hospitals
- 7.1.2. Ophthalmic Hospitals
- 7.1.3. Others
- 7.2. Market Analysis, Insights and Forecast - by Types
- 7.2.1. Ophthalmic Forceps
- 7.2.2. Ophthalmic Scissors
- 7.2.3. Ophthalmic Cannulas
- 7.2.4. Others
- 7.1. Market Analysis, Insights and Forecast - by Application
- 8. Europe Ophthalmology Instrumentation Analysis, Insights and Forecast, 2020-2032
- 8.1. Market Analysis, Insights and Forecast - by Application
- 8.1.1. General Hospitals
- 8.1.2. Ophthalmic Hospitals
- 8.1.3. Others
- 8.2. Market Analysis, Insights and Forecast - by Types
- 8.2.1. Ophthalmic Forceps
- 8.2.2. Ophthalmic Scissors
- 8.2.3. Ophthalmic Cannulas
- 8.2.4. Others
- 8.1. Market Analysis, Insights and Forecast - by Application
- 9. Middle East & Africa Ophthalmology Instrumentation Analysis, Insights and Forecast, 2020-2032
- 9.1. Market Analysis, Insights and Forecast - by Application
- 9.1.1. General Hospitals
- 9.1.2. Ophthalmic Hospitals
- 9.1.3. Others
- 9.2. Market Analysis, Insights and Forecast - by Types
- 9.2.1. Ophthalmic Forceps
- 9.2.2. Ophthalmic Scissors
- 9.2.3. Ophthalmic Cannulas
- 9.2.4. Others
- 9.1. Market Analysis, Insights and Forecast - by Application
- 10. Asia Pacific Ophthalmology Instrumentation Analysis, Insights and Forecast, 2020-2032
- 10.1. Market Analysis, Insights and Forecast - by Application
- 10.1.1. General Hospitals
- 10.1.2. Ophthalmic Hospitals
- 10.1.3. Others
- 10.2. Market Analysis, Insights and Forecast - by Types
- 10.2.1. Ophthalmic Forceps
- 10.2.2. Ophthalmic Scissors
- 10.2.3. Ophthalmic Cannulas
- 10.2.4. Others
- 10.1. Market Analysis, Insights and Forecast - by Application
- 11. Competitive Analysis
- 11.1. Global Market Share Analysis 2025
- 11.2. Company Profiles
- 11.2.1 Duckworth & Kent Ltd
- 11.2.1.1. Overview
- 11.2.1.2. Products
- 11.2.1.3. SWOT Analysis
- 11.2.1.4. Recent Developments
- 11.2.1.5. Financials (Based on Availability)
- 11.2.2 Aurolab
- 11.2.2.1. Overview
- 11.2.2.2. Products
- 11.2.2.3. SWOT Analysis
- 11.2.2.4. Recent Developments
- 11.2.2.5. Financials (Based on Availability)
- 11.2.3 HUAIAN FRIMEN CO
- 11.2.3.1. Overview
- 11.2.3.2. Products
- 11.2.3.3. SWOT Analysis
- 11.2.3.4. Recent Developments
- 11.2.3.5. Financials (Based on Availability)
- 11.2.4 OPHMED CO
- 11.2.4.1. Overview
- 11.2.4.2. Products
- 11.2.4.3. SWOT Analysis
- 11.2.4.4. Recent Developments
- 11.2.4.5. Financials (Based on Availability)
- 11.2.5 Ophthalmic Instrument Company
- 11.2.5.1. Overview
- 11.2.5.2. Products
- 11.2.5.3. SWOT Analysis
- 11.2.5.4. Recent Developments
- 11.2.5.5. Financials (Based on Availability)
- 11.2.6 Zabbys
- 11.2.6.1. Overview
- 11.2.6.2. Products
- 11.2.6.3. SWOT Analysis
- 11.2.6.4. Recent Developments
- 11.2.6.5. Financials (Based on Availability)
- 11.2.7 Rumex
- 11.2.7.1. Overview
- 11.2.7.2. Products
- 11.2.7.3. SWOT Analysis
- 11.2.7.4. Recent Developments
- 11.2.7.5. Financials (Based on Availability)
- 11.2.8 Neitz
- 11.2.8.1. Overview
- 11.2.8.2. Products
- 11.2.8.3. SWOT Analysis
- 11.2.8.4. Recent Developments
- 11.2.8.5. Financials (Based on Availability)
- 11.2.9 Takagi
- 11.2.9.1. Overview
- 11.2.9.2. Products
- 11.2.9.3. SWOT Analysis
- 11.2.9.4. Recent Developments
- 11.2.9.5. Financials (Based on Availability)
- 11.2.1 Duckworth & Kent Ltd
List of Figures
- Figure 1: Global Ophthalmology Instrumentation Revenue Breakdown (billion, %) by Region 2025 & 2033
- Figure 2: Global Ophthalmology Instrumentation Volume Breakdown (K, %) by Region 2025 & 2033
- Figure 3: North America Ophthalmology Instrumentation Revenue (billion), by Application 2025 & 2033
- Figure 4: North America Ophthalmology Instrumentation Volume (K), by Application 2025 & 2033
- Figure 5: North America Ophthalmology Instrumentation Revenue Share (%), by Application 2025 & 2033
- Figure 6: North America Ophthalmology Instrumentation Volume Share (%), by Application 2025 & 2033
- Figure 7: North America Ophthalmology Instrumentation Revenue (billion), by Types 2025 & 2033
- Figure 8: North America Ophthalmology Instrumentation Volume (K), by Types 2025 & 2033
- Figure 9: North America Ophthalmology Instrumentation Revenue Share (%), by Types 2025 & 2033
- Figure 10: North America Ophthalmology Instrumentation Volume Share (%), by Types 2025 & 2033
- Figure 11: North America Ophthalmology Instrumentation Revenue (billion), by Country 2025 & 2033
- Figure 12: North America Ophthalmology Instrumentation Volume (K), by Country 2025 & 2033
- Figure 13: North America Ophthalmology Instrumentation Revenue Share (%), by Country 2025 & 2033
- Figure 14: North America Ophthalmology Instrumentation Volume Share (%), by Country 2025 & 2033
- Figure 15: South America Ophthalmology Instrumentation Revenue (billion), by Application 2025 & 2033
- Figure 16: South America Ophthalmology Instrumentation Volume (K), by Application 2025 & 2033
- Figure 17: South America Ophthalmology Instrumentation Revenue Share (%), by Application 2025 & 2033
- Figure 18: South America Ophthalmology Instrumentation Volume Share (%), by Application 2025 & 2033
- Figure 19: South America Ophthalmology Instrumentation Revenue (billion), by Types 2025 & 2033
- Figure 20: South America Ophthalmology Instrumentation Volume (K), by Types 2025 & 2033
- Figure 21: South America Ophthalmology Instrumentation Revenue Share (%), by Types 2025 & 2033
- Figure 22: South America Ophthalmology Instrumentation Volume Share (%), by Types 2025 & 2033
- Figure 23: South America Ophthalmology Instrumentation Revenue (billion), by Country 2025 & 2033
- Figure 24: South America Ophthalmology Instrumentation Volume (K), by Country 2025 & 2033
- Figure 25: South America Ophthalmology Instrumentation Revenue Share (%), by Country 2025 & 2033
- Figure 26: South America Ophthalmology Instrumentation Volume Share (%), by Country 2025 & 2033
- Figure 27: Europe Ophthalmology Instrumentation Revenue (billion), by Application 2025 & 2033
- Figure 28: Europe Ophthalmology Instrumentation Volume (K), by Application 2025 & 2033
- Figure 29: Europe Ophthalmology Instrumentation Revenue Share (%), by Application 2025 & 2033
- Figure 30: Europe Ophthalmology Instrumentation Volume Share (%), by Application 2025 & 2033
- Figure 31: Europe Ophthalmology Instrumentation Revenue (billion), by Types 2025 & 2033
- Figure 32: Europe Ophthalmology Instrumentation Volume (K), by Types 2025 & 2033
- Figure 33: Europe Ophthalmology Instrumentation Revenue Share (%), by Types 2025 & 2033
- Figure 34: Europe Ophthalmology Instrumentation Volume Share (%), by Types 2025 & 2033
- Figure 35: Europe Ophthalmology Instrumentation Revenue (billion), by Country 2025 & 2033
- Figure 36: Europe Ophthalmology Instrumentation Volume (K), by Country 2025 & 2033
- Figure 37: Europe Ophthalmology Instrumentation Revenue Share (%), by Country 2025 & 2033
- Figure 38: Europe Ophthalmology Instrumentation Volume Share (%), by Country 2025 & 2033
- Figure 39: Middle East & Africa Ophthalmology Instrumentation Revenue (billion), by Application 2025 & 2033
- Figure 40: Middle East & Africa Ophthalmology Instrumentation Volume (K), by Application 2025 & 2033
- Figure 41: Middle East & Africa Ophthalmology Instrumentation Revenue Share (%), by Application 2025 & 2033
- Figure 42: Middle East & Africa Ophthalmology Instrumentation Volume Share (%), by Application 2025 & 2033
- Figure 43: Middle East & Africa Ophthalmology Instrumentation Revenue (billion), by Types 2025 & 2033
- Figure 44: Middle East & Africa Ophthalmology Instrumentation Volume (K), by Types 2025 & 2033
- Figure 45: Middle East & Africa Ophthalmology Instrumentation Revenue Share (%), by Types 2025 & 2033
- Figure 46: Middle East & Africa Ophthalmology Instrumentation Volume Share (%), by Types 2025 & 2033
- Figure 47: Middle East & Africa Ophthalmology Instrumentation Revenue (billion), by Country 2025 & 2033
- Figure 48: Middle East & Africa Ophthalmology Instrumentation Volume (K), by Country 2025 & 2033
- Figure 49: Middle East & Africa Ophthalmology Instrumentation Revenue Share (%), by Country 2025 & 2033
- Figure 50: Middle East & Africa Ophthalmology Instrumentation Volume Share (%), by Country 2025 & 2033
- Figure 51: Asia Pacific Ophthalmology Instrumentation Revenue (billion), by Application 2025 & 2033
- Figure 52: Asia Pacific Ophthalmology Instrumentation Volume (K), by Application 2025 & 2033
- Figure 53: Asia Pacific Ophthalmology Instrumentation Revenue Share (%), by Application 2025 & 2033
- Figure 54: Asia Pacific Ophthalmology Instrumentation Volume Share (%), by Application 2025 & 2033
- Figure 55: Asia Pacific Ophthalmology Instrumentation Revenue (billion), by Types 2025 & 2033
- Figure 56: Asia Pacific Ophthalmology Instrumentation Volume (K), by Types 2025 & 2033
- Figure 57: Asia Pacific Ophthalmology Instrumentation Revenue Share (%), by Types 2025 & 2033
- Figure 58: Asia Pacific Ophthalmology Instrumentation Volume Share (%), by Types 2025 & 2033
- Figure 59: Asia Pacific Ophthalmology Instrumentation Revenue (billion), by Country 2025 & 2033
- Figure 60: Asia Pacific Ophthalmology Instrumentation Volume (K), by Country 2025 & 2033
- Figure 61: Asia Pacific Ophthalmology Instrumentation Revenue Share (%), by Country 2025 & 2033
- Figure 62: Asia Pacific Ophthalmology Instrumentation Volume Share (%), by Country 2025 & 2033
List of Tables
- Table 1: Global Ophthalmology Instrumentation Revenue billion Forecast, by Application 2020 & 2033
- Table 2: Global Ophthalmology Instrumentation Volume K Forecast, by Application 2020 & 2033
- Table 3: Global Ophthalmology Instrumentation Revenue billion Forecast, by Types 2020 & 2033
- Table 4: Global Ophthalmology Instrumentation Volume K Forecast, by Types 2020 & 2033
- Table 5: Global Ophthalmology Instrumentation Revenue billion Forecast, by Region 2020 & 2033
- Table 6: Global Ophthalmology Instrumentation Volume K Forecast, by Region 2020 & 2033
- Table 7: Global Ophthalmology Instrumentation Revenue billion Forecast, by Application 2020 & 2033
- Table 8: Global Ophthalmology Instrumentation Volume K Forecast, by Application 2020 & 2033
- Table 9: Global Ophthalmology Instrumentation Revenue billion Forecast, by Types 2020 & 2033
- Table 10: Global Ophthalmology Instrumentation Volume K Forecast, by Types 2020 & 2033
- Table 11: Global Ophthalmology Instrumentation Revenue billion Forecast, by Country 2020 & 2033
- Table 12: Global Ophthalmology Instrumentation Volume K Forecast, by Country 2020 & 2033
- Table 13: United States Ophthalmology Instrumentation Revenue (billion) Forecast, by Application 2020 & 2033
- Table 14: United States Ophthalmology Instrumentation Volume (K) Forecast, by Application 2020 & 2033
- Table 15: Canada Ophthalmology Instrumentation Revenue (billion) Forecast, by Application 2020 & 2033
- Table 16: Canada Ophthalmology Instrumentation Volume (K) Forecast, by Application 2020 & 2033
- Table 17: Mexico Ophthalmology Instrumentation Revenue (billion) Forecast, by Application 2020 & 2033
- Table 18: Mexico Ophthalmology Instrumentation Volume (K) Forecast, by Application 2020 & 2033
- Table 19: Global Ophthalmology Instrumentation Revenue billion Forecast, by Application 2020 & 2033
- Table 20: Global Ophthalmology Instrumentation Volume K Forecast, by Application 2020 & 2033
- Table 21: Global Ophthalmology Instrumentation Revenue billion Forecast, by Types 2020 & 2033
- Table 22: Global Ophthalmology Instrumentation Volume K Forecast, by Types 2020 & 2033
- Table 23: Global Ophthalmology Instrumentation Revenue billion Forecast, by Country 2020 & 2033
- Table 24: Global Ophthalmology Instrumentation Volume K Forecast, by Country 2020 & 2033
- Table 25: Brazil Ophthalmology Instrumentation Revenue (billion) Forecast, by Application 2020 & 2033
- Table 26: Brazil Ophthalmology Instrumentation Volume (K) Forecast, by Application 2020 & 2033
- Table 27: Argentina Ophthalmology Instrumentation Revenue (billion) Forecast, by Application 2020 & 2033
- Table 28: Argentina Ophthalmology Instrumentation Volume (K) Forecast, by Application 2020 & 2033
- Table 29: Rest of South America Ophthalmology Instrumentation Revenue (billion) Forecast, by Application 2020 & 2033
- Table 30: Rest of South America Ophthalmology Instrumentation Volume (K) Forecast, by Application 2020 & 2033
- Table 31: Global Ophthalmology Instrumentation Revenue billion Forecast, by Application 2020 & 2033
- Table 32: Global Ophthalmology Instrumentation Volume K Forecast, by Application 2020 & 2033
- Table 33: Global Ophthalmology Instrumentation Revenue billion Forecast, by Types 2020 & 2033
- Table 34: Global Ophthalmology Instrumentation Volume K Forecast, by Types 2020 & 2033
- Table 35: Global Ophthalmology Instrumentation Revenue billion Forecast, by Country 2020 & 2033
- Table 36: Global Ophthalmology Instrumentation Volume K Forecast, by Country 2020 & 2033
- Table 37: United Kingdom Ophthalmology Instrumentation Revenue (billion) Forecast, by Application 2020 & 2033
- Table 38: United Kingdom Ophthalmology Instrumentation Volume (K) Forecast, by Application 2020 & 2033
- Table 39: Germany Ophthalmology Instrumentation Revenue (billion) Forecast, by Application 2020 & 2033
- Table 40: Germany Ophthalmology Instrumentation Volume (K) Forecast, by Application 2020 & 2033
- Table 41: France Ophthalmology Instrumentation Revenue (billion) Forecast, by Application 2020 & 2033
- Table 42: France Ophthalmology Instrumentation Volume (K) Forecast, by Application 2020 & 2033
- Table 43: Italy Ophthalmology Instrumentation Revenue (billion) Forecast, by Application 2020 & 2033
- Table 44: Italy Ophthalmology Instrumentation Volume (K) Forecast, by Application 2020 & 2033
- Table 45: Spain Ophthalmology Instrumentation Revenue (billion) Forecast, by Application 2020 & 2033
- Table 46: Spain Ophthalmology Instrumentation Volume (K) Forecast, by Application 2020 & 2033
- Table 47: Russia Ophthalmology Instrumentation Revenue (billion) Forecast, by Application 2020 & 2033
- Table 48: Russia Ophthalmology Instrumentation Volume (K) Forecast, by Application 2020 & 2033
- Table 49: Benelux Ophthalmology Instrumentation Revenue (billion) Forecast, by Application 2020 & 2033
- Table 50: Benelux Ophthalmology Instrumentation Volume (K) Forecast, by Application 2020 & 2033
- Table 51: Nordics Ophthalmology Instrumentation Revenue (billion) Forecast, by Application 2020 & 2033
- Table 52: Nordics Ophthalmology Instrumentation Volume (K) Forecast, by Application 2020 & 2033
- Table 53: Rest of Europe Ophthalmology Instrumentation Revenue (billion) Forecast, by Application 2020 & 2033
- Table 54: Rest of Europe Ophthalmology Instrumentation Volume (K) Forecast, by Application 2020 & 2033
- Table 55: Global Ophthalmology Instrumentation Revenue billion Forecast, by Application 2020 & 2033
- Table 56: Global Ophthalmology Instrumentation Volume K Forecast, by Application 2020 & 2033
- Table 57: Global Ophthalmology Instrumentation Revenue billion Forecast, by Types 2020 & 2033
- Table 58: Global Ophthalmology Instrumentation Volume K Forecast, by Types 2020 & 2033
- Table 59: Global Ophthalmology Instrumentation Revenue billion Forecast, by Country 2020 & 2033
- Table 60: Global Ophthalmology Instrumentation Volume K Forecast, by Country 2020 & 2033
- Table 61: Turkey Ophthalmology Instrumentation Revenue (billion) Forecast, by Application 2020 & 2033
- Table 62: Turkey Ophthalmology Instrumentation Volume (K) Forecast, by Application 2020 & 2033
- Table 63: Israel Ophthalmology Instrumentation Revenue (billion) Forecast, by Application 2020 & 2033
- Table 64: Israel Ophthalmology Instrumentation Volume (K) Forecast, by Application 2020 & 2033
- Table 65: GCC Ophthalmology Instrumentation Revenue (billion) Forecast, by Application 2020 & 2033
- Table 66: GCC Ophthalmology Instrumentation Volume (K) Forecast, by Application 2020 & 2033
- Table 67: North Africa Ophthalmology Instrumentation Revenue (billion) Forecast, by Application 2020 & 2033
- Table 68: North Africa Ophthalmology Instrumentation Volume (K) Forecast, by Application 2020 & 2033
- Table 69: South Africa Ophthalmology Instrumentation Revenue (billion) Forecast, by Application 2020 & 2033
- Table 70: South Africa Ophthalmology Instrumentation Volume (K) Forecast, by Application 2020 & 2033
- Table 71: Rest of Middle East & Africa Ophthalmology Instrumentation Revenue (billion) Forecast, by Application 2020 & 2033
- Table 72: Rest of Middle East & Africa Ophthalmology Instrumentation Volume (K) Forecast, by Application 2020 & 2033
- Table 73: Global Ophthalmology Instrumentation Revenue billion Forecast, by Application 2020 & 2033
- Table 74: Global Ophthalmology Instrumentation Volume K Forecast, by Application 2020 & 2033
- Table 75: Global Ophthalmology Instrumentation Revenue billion Forecast, by Types 2020 & 2033
- Table 76: Global Ophthalmology Instrumentation Volume K Forecast, by Types 2020 & 2033
- Table 77: Global Ophthalmology Instrumentation Revenue billion Forecast, by Country 2020 & 2033
- Table 78: Global Ophthalmology Instrumentation Volume K Forecast, by Country 2020 & 2033
- Table 79: China Ophthalmology Instrumentation Revenue (billion) Forecast, by Application 2020 & 2033
- Table 80: China Ophthalmology Instrumentation Volume (K) Forecast, by Application 2020 & 2033
- Table 81: India Ophthalmology Instrumentation Revenue (billion) Forecast, by Application 2020 & 2033
- Table 82: India Ophthalmology Instrumentation Volume (K) Forecast, by Application 2020 & 2033
- Table 83: Japan Ophthalmology Instrumentation Revenue (billion) Forecast, by Application 2020 & 2033
- Table 84: Japan Ophthalmology Instrumentation Volume (K) Forecast, by Application 2020 & 2033
- Table 85: South Korea Ophthalmology Instrumentation Revenue (billion) Forecast, by Application 2020 & 2033
- Table 86: South Korea Ophthalmology Instrumentation Volume (K) Forecast, by Application 2020 & 2033
- Table 87: ASEAN Ophthalmology Instrumentation Revenue (billion) Forecast, by Application 2020 & 2033
- Table 88: ASEAN Ophthalmology Instrumentation Volume (K) Forecast, by Application 2020 & 2033
- Table 89: Oceania Ophthalmology Instrumentation Revenue (billion) Forecast, by Application 2020 & 2033
- Table 90: Oceania Ophthalmology Instrumentation Volume (K) Forecast, by Application 2020 & 2033
- Table 91: Rest of Asia Pacific Ophthalmology Instrumentation Revenue (billion) Forecast, by Application 2020 & 2033
- Table 92: Rest of Asia Pacific Ophthalmology Instrumentation Volume (K) Forecast, by Application 2020 & 2033
Frequently Asked Questions
1. What is the projected Compound Annual Growth Rate (CAGR) of the Ophthalmology Instrumentation?
The projected CAGR is approximately 4.9%.
2. Which companies are prominent players in the Ophthalmology Instrumentation?
Key companies in the market include Duckworth & Kent Ltd, Aurolab, HUAIAN FRIMEN CO, OPHMED CO, Ophthalmic Instrument Company, Zabbys, Rumex, Neitz, Takagi.
3. What are the main segments of the Ophthalmology Instrumentation?
The market segments include Application, Types.
4. Can you provide details about the market size?
The market size is estimated to be USD 76.02 billion as of 2022.
5. What are some drivers contributing to market growth?
N/A
6. What are the notable trends driving market growth?
N/A
7. Are there any restraints impacting market growth?
N/A
8. Can you provide examples of recent developments in the market?
N/A
9. What pricing options are available for accessing the report?
Pricing options include single-user, multi-user, and enterprise licenses priced at USD 3350.00, USD 5025.00, and USD 6700.00 respectively.
10. Is the market size provided in terms of value or volume?
The market size is provided in terms of value, measured in billion and volume, measured in K.
11. Are there any specific market keywords associated with the report?
Yes, the market keyword associated with the report is "Ophthalmology Instrumentation," which aids in identifying and referencing the specific market segment covered.
12. How do I determine which pricing option suits my needs best?
The pricing options vary based on user requirements and access needs. Individual users may opt for single-user licenses, while businesses requiring broader access may choose multi-user or enterprise licenses for cost-effective access to the report.
13. Are there any additional resources or data provided in the Ophthalmology Instrumentation report?
While the report offers comprehensive insights, it's advisable to review the specific contents or supplementary materials provided to ascertain if additional resources or data are available.
14. How can I stay updated on further developments or reports in the Ophthalmology Instrumentation?
To stay informed about further developments, trends, and reports in the Ophthalmology Instrumentation, consider subscribing to industry newsletters, following relevant companies and organizations, or regularly checking reputable industry news sources and publications.
Methodology
Step 1 - Identification of Relevant Samples Size from Population Database


Step 2 - Approaches for Defining Global Market Size (Value, Volume* & Price*)

Note*: In applicable scenarios
Step 3 - Data Sources
Primary Research
- Web Analytics
- Survey Reports
- Research Institute
- Latest Research Reports
- Opinion Leaders
Secondary Research
- Annual Reports
- White Paper
- Latest Press Release
- Industry Association
- Paid Database
- Investor Presentations

Step 4 - Data Triangulation
Involves using different sources of information in order to increase the validity of a study
These sources are likely to be stakeholders in a program - participants, other researchers, program staff, other community members, and so on.
Then we put all data in single framework & apply various statistical tools to find out the dynamic on the market.
During the analysis stage, feedback from the stakeholder groups would be compared to determine areas of agreement as well as areas of divergence