

Key Insights
The plant hormone analysis market is experiencing robust growth, driven by the increasing demand for high-throughput screening methods in agricultural research and the rising adoption of precision agriculture techniques. The market's expansion is fueled by several factors, including the growing need to enhance crop yields and quality, the development of novel plant hormone detection technologies, and the increasing awareness of the role of plant hormones in plant growth and development. A Compound Annual Growth Rate (CAGR) of approximately 10% is estimated for the period 2025-2033, indicating a significant expansion. This growth is further propelled by advancements in analytical techniques such as liquid chromatography-mass spectrometry (LC-MS) and gas chromatography-mass spectrometry (GC-MS), providing more sensitive and accurate measurements of plant hormones. However, the high cost of advanced analytical equipment and the need for specialized expertise can pose challenges to market penetration. Market segmentation is largely driven by the type of hormone analyzed (auxins, gibberellins, cytokinins, abscisic acid, ethylene, brassinosteroids, etc.), the application (agricultural research, plant breeding, environmental monitoring), and the geographical location. Key players in the market, including Creative Proteomics, Lifeasible, Metware Biotechnology, and others, are actively involved in developing innovative solutions and expanding their service offerings to cater to the growing market demand.
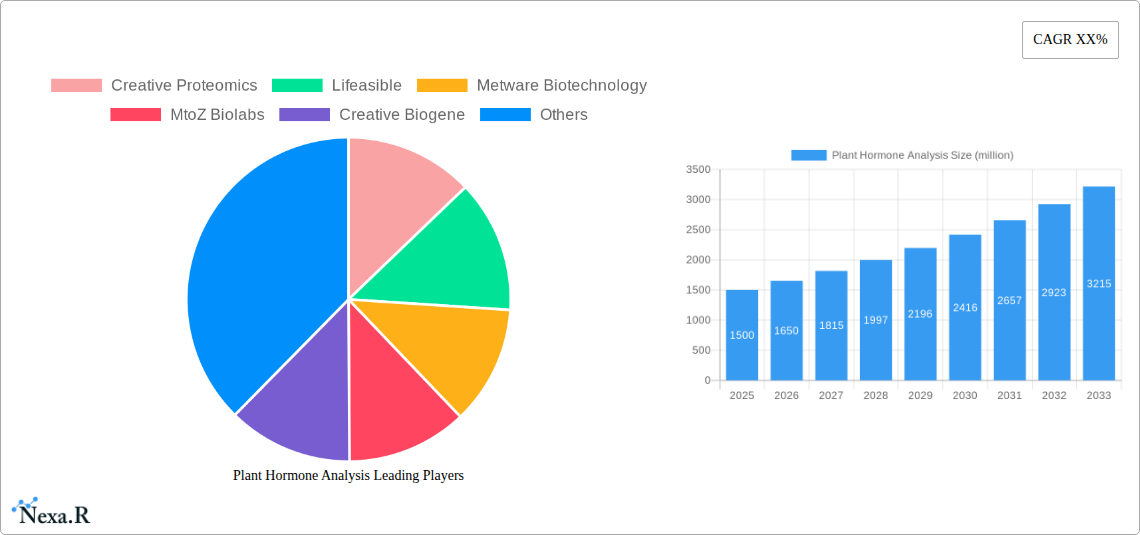
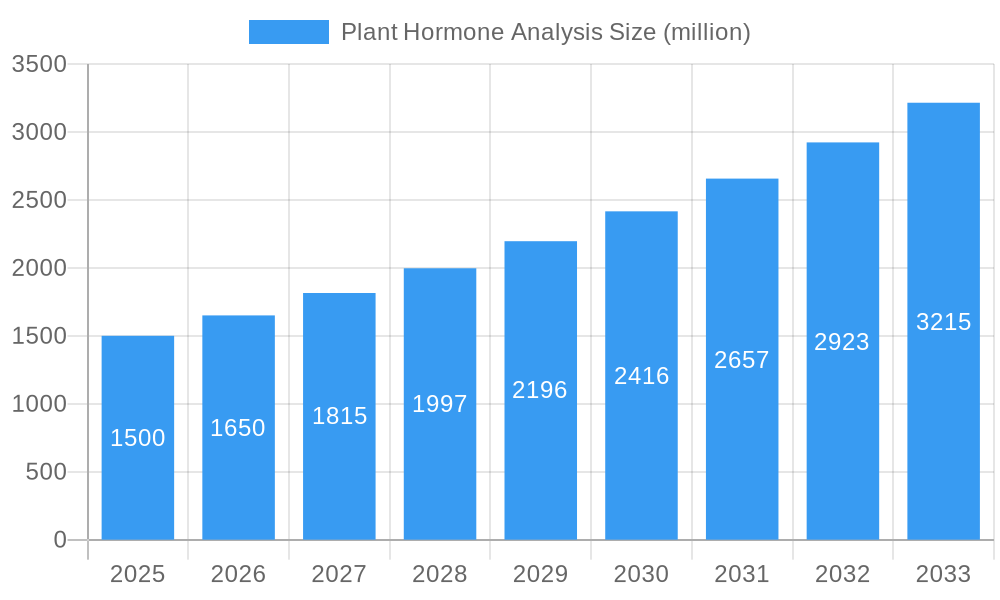
Plant Hormone Analysis Market Size (In Billion)
Despite the positive market outlook, the market faces challenges. The complexity of plant hormone interactions and the diversity of plant species necessitate the development of robust and adaptable analytical methods. Furthermore, standardization of analytical procedures and data interpretation across different laboratories remains crucial for reliable and comparable results. The high cost associated with advanced technologies and the expertise required for their operation could limit the accessibility of these services for smaller research groups or organizations in developing countries. However, continued technological advancements, government initiatives supporting agricultural research, and increasing private investments are expected to overcome these barriers, facilitating the wider adoption of plant hormone analysis technologies. The market's future growth will hinge upon the continuous innovation of cost-effective and user-friendly analytical techniques, improved data management and interpretation, and increased collaboration between researchers and stakeholders.
Plant Hormone Analysis Company Market Share
Plant Hormone Analysis Market Report: 2019-2033
This comprehensive report provides an in-depth analysis of the Plant Hormone Analysis market, offering invaluable insights for industry professionals, investors, and researchers. We delve into market dynamics, growth trends, regional dominance, product innovation, and key players, projecting market evolution from 2019 to 2033. The report leverages extensive data analysis to provide actionable intelligence for strategic decision-making within the broader agricultural biotechnology and life sciences sectors. The base year for this analysis is 2025, with data covering the historical period (2019-2024), the estimated year (2025), and the forecast period (2025-2033). Market values are expressed in million USD.
Plant Hormone Analysis Market Dynamics & Structure
The Plant Hormone Analysis market is experiencing robust growth, driven by advancements in analytical techniques and increasing demand for high-throughput screening in agricultural research and development. Market concentration is moderate, with several key players vying for market share. Technological innovation, primarily in chromatography and mass spectrometry, is a major driver, while stringent regulatory frameworks and the availability of cost-effective substitute methods present challenges. The market is characterized by a high degree of specialized knowledge, creating a barrier to entry for new players. M&A activity is moderate, primarily driven by larger companies seeking to expand their product portfolios and geographical reach.
- Market Concentration: Moderately concentrated, with the top 5 players holding approximately xx% of the market share in 2025.
- Technological Innovation: Significant advancements in LC-MS/MS, GC-MS, and ELISA techniques are driving market growth.
- Regulatory Framework: Stringent regulations regarding the use of plant hormones and data privacy requirements influence market operations.
- Competitive Substitutes: Simpler, less expensive methods, like immunoassays, provide some competitive pressure.
- End-User Demographics: Primarily agricultural research institutions, biotechnology companies, and pharmaceutical companies involved in plant-based drug development.
- M&A Trends: Moderate level of M&A activity observed, primarily focused on expanding capabilities and market reach. An estimated xx M&A deals occurred between 2019 and 2024.
Plant Hormone Analysis Growth Trends & Insights
The Plant Hormone Analysis market has shown significant growth from 2019 to 2024, with a Compound Annual Growth Rate (CAGR) of xx%. The market size is estimated to reach xx million in 2025, driven by increased adoption of advanced analytical techniques across various applications, including crop improvement, stress response studies, and plant-based drug discovery. Technological disruptions, particularly in automation and data analysis capabilities, are further fueling market expansion. Consumer behavior is shifting towards a greater demand for higher-throughput analysis and data-driven insights, thus favoring providers capable of delivering comprehensive and efficient services. We project a CAGR of xx% from 2025 to 2033, with the market reaching xx million by 2033. Market penetration is expected to increase significantly, especially in developing economies with expanding agricultural sectors.
Dominant Regions, Countries, or Segments in Plant Hormone Analysis
North America currently dominates the Plant Hormone Analysis market, driven by strong R&D investments in the agricultural biotechnology sector and a robust regulatory framework that supports innovation. Europe and Asia-Pacific follow closely, exhibiting considerable growth potential due to increasing agricultural output and government initiatives promoting technological advancements. The research segment represents a significant share of the market, owing to extensive research in plant science and agriculture, and the development of novel plant-based drugs.
- North America: Strong R&D investments, well-established infrastructure, and supportive regulatory environment are driving market dominance.
- Europe: Significant presence of agricultural research institutions and biotechnology companies fuels market growth.
- Asia-Pacific: Rapidly expanding agricultural sector and government support for technological advancements contribute to market expansion.
- Research Segment: High demand from research institutions and pharmaceutical companies for plant hormone analysis related services.
Plant Hormone Analysis Product Landscape
The Plant Hormone Analysis market offers a range of services, from basic hormone quantification using established techniques to highly specialized analyses that incorporate cutting-edge technologies, such as metabolomics and proteomics. Service providers offer varied levels of customization, addressing specific research needs. Technological advancements focus on miniaturization, increased throughput, reduced analysis times, and improved sensitivity and accuracy. Unique selling propositions emphasize fast turnaround times, highly accurate data, and comprehensive data interpretation and reporting.
Key Drivers, Barriers & Challenges in Plant Hormone Analysis
Key Drivers:
- Increasing demand for high-throughput screening in agricultural research.
- Advancements in analytical technologies, improving sensitivity and accuracy.
- Growing focus on plant-based pharmaceuticals and nutraceuticals.
- Government funding and support for agricultural research.
Key Barriers and Challenges:
- High cost of advanced analytical equipment and expertise.
- Stringent regulatory requirements and data privacy concerns.
- The availability of cost-effective alternative methods.
- Competition among service providers necessitates continuous innovation. This impacts the market by roughly xx million annually.
Emerging Opportunities in Plant Hormone Analysis
Untapped market opportunities exist in developing economies with rapidly expanding agricultural sectors. Innovative applications in precision agriculture, including real-time monitoring of plant hormone levels for optimized crop management, offer significant potential. Evolving consumer preferences for sustainably produced food and eco-friendly agricultural practices are driving demand for improved crop yields and stress tolerance, further fueling the market.
Growth Accelerators in the Plant Hormone Analysis Industry
Technological breakthroughs in areas like AI-driven data analysis and automation are accelerating market growth. Strategic partnerships between analytical service providers and agricultural technology companies are enabling the development of integrated solutions that cater to the evolving needs of researchers and farmers. Market expansion into developing economies and the application of plant hormone analysis in the pharmaceutical industry represents significant opportunities for growth.
Key Players Shaping the Plant Hormone Analysis Market
- Creative Proteomics
- Lifeasible
- Metware Biotechnology
- MtoZ Biolabs
- Creative Biogene
- Anacon Laboratories
- Springer Nature Experiments
- IBMCP
Notable Milestones in Plant Hormone Analysis Sector
- 2021: Introduction of a novel high-throughput LC-MS/MS platform by Creative Proteomics.
- 2022: Metware Biotechnology launched a comprehensive plant hormone profiling service.
- 2023: Lifeasible acquired a smaller competitor, expanding its service offerings.
- 2024: Publication of a significant research study using plant hormone analysis to enhance crop yield in a leading scientific journal.
In-Depth Plant Hormone Analysis Market Outlook
The Plant Hormone Analysis market is poised for sustained growth over the next decade, driven by continued technological advancements and increasing demand from various sectors. Strategic opportunities lie in developing innovative analytical solutions for precision agriculture, expanding into untapped markets, and forging strategic partnerships to create integrated solutions. The integration of AI and machine learning holds immense potential for enhancing data analysis capabilities and providing predictive insights, further stimulating market growth.
Plant Hormone Analysis Segmentation
-
1. Application
- 1.1. Research on Pant Growth, Reproduction and Development
- 1.2. Abiotic Stress Research
- 1.3. Biological Stress Response Research
- 1.4. Plant Hormone Interactions
-
2. Types
- 2.1. ELISA
- 2.2. HPLC
- 2.3. HPLC-MS
Plant Hormone Analysis Segmentation By Geography
-
1. North America
- 1.1. United States
- 1.2. Canada
- 1.3. Mexico
-
2. South America
- 2.1. Brazil
- 2.2. Argentina
- 2.3. Rest of South America
-
3. Europe
- 3.1. United Kingdom
- 3.2. Germany
- 3.3. France
- 3.4. Italy
- 3.5. Spain
- 3.6. Russia
- 3.7. Benelux
- 3.8. Nordics
- 3.9. Rest of Europe
-
4. Middle East & Africa
- 4.1. Turkey
- 4.2. Israel
- 4.3. GCC
- 4.4. North Africa
- 4.5. South Africa
- 4.6. Rest of Middle East & Africa
-
5. Asia Pacific
- 5.1. China
- 5.2. India
- 5.3. Japan
- 5.4. South Korea
- 5.5. ASEAN
- 5.6. Oceania
- 5.7. Rest of Asia Pacific

Plant Hormone Analysis Regional Market Share
Geographic Coverage of Plant Hormone Analysis
Plant Hormone Analysis REPORT HIGHLIGHTS
| Aspects | Details |
|---|---|
| Study Period | 2020-2034 |
| Base Year | 2025 |
| Estimated Year | 2026 |
| Forecast Period | 2026-2034 |
| Historical Period | 2020-2025 |
| Growth Rate | CAGR of 8.86% from 2020-2034 |
| Segmentation |
|
Table of Contents
- 1. Introduction
- 1.1. Research Scope
- 1.2. Market Segmentation
- 1.3. Research Methodology
- 1.4. Definitions and Assumptions
- 2. Executive Summary
- 2.1. Introduction
- 3. Market Dynamics
- 3.1. Introduction
- 3.2. Market Drivers
- 3.3. Market Restrains
- 3.4. Market Trends
- 4. Market Factor Analysis
- 4.1. Porters Five Forces
- 4.2. Supply/Value Chain
- 4.3. PESTEL analysis
- 4.4. Market Entropy
- 4.5. Patent/Trademark Analysis
- 5. Global Plant Hormone Analysis Analysis, Insights and Forecast, 2020-2032
- 5.1. Market Analysis, Insights and Forecast - by Application
- 5.1.1. Research on Pant Growth, Reproduction and Development
- 5.1.2. Abiotic Stress Research
- 5.1.3. Biological Stress Response Research
- 5.1.4. Plant Hormone Interactions
- 5.2. Market Analysis, Insights and Forecast - by Types
- 5.2.1. ELISA
- 5.2.2. HPLC
- 5.2.3. HPLC-MS
- 5.3. Market Analysis, Insights and Forecast - by Region
- 5.3.1. North America
- 5.3.2. South America
- 5.3.3. Europe
- 5.3.4. Middle East & Africa
- 5.3.5. Asia Pacific
- 5.1. Market Analysis, Insights and Forecast - by Application
- 6. North America Plant Hormone Analysis Analysis, Insights and Forecast, 2020-2032
- 6.1. Market Analysis, Insights and Forecast - by Application
- 6.1.1. Research on Pant Growth, Reproduction and Development
- 6.1.2. Abiotic Stress Research
- 6.1.3. Biological Stress Response Research
- 6.1.4. Plant Hormone Interactions
- 6.2. Market Analysis, Insights and Forecast - by Types
- 6.2.1. ELISA
- 6.2.2. HPLC
- 6.2.3. HPLC-MS
- 6.1. Market Analysis, Insights and Forecast - by Application
- 7. South America Plant Hormone Analysis Analysis, Insights and Forecast, 2020-2032
- 7.1. Market Analysis, Insights and Forecast - by Application
- 7.1.1. Research on Pant Growth, Reproduction and Development
- 7.1.2. Abiotic Stress Research
- 7.1.3. Biological Stress Response Research
- 7.1.4. Plant Hormone Interactions
- 7.2. Market Analysis, Insights and Forecast - by Types
- 7.2.1. ELISA
- 7.2.2. HPLC
- 7.2.3. HPLC-MS
- 7.1. Market Analysis, Insights and Forecast - by Application
- 8. Europe Plant Hormone Analysis Analysis, Insights and Forecast, 2020-2032
- 8.1. Market Analysis, Insights and Forecast - by Application
- 8.1.1. Research on Pant Growth, Reproduction and Development
- 8.1.2. Abiotic Stress Research
- 8.1.3. Biological Stress Response Research
- 8.1.4. Plant Hormone Interactions
- 8.2. Market Analysis, Insights and Forecast - by Types
- 8.2.1. ELISA
- 8.2.2. HPLC
- 8.2.3. HPLC-MS
- 8.1. Market Analysis, Insights and Forecast - by Application
- 9. Middle East & Africa Plant Hormone Analysis Analysis, Insights and Forecast, 2020-2032
- 9.1. Market Analysis, Insights and Forecast - by Application
- 9.1.1. Research on Pant Growth, Reproduction and Development
- 9.1.2. Abiotic Stress Research
- 9.1.3. Biological Stress Response Research
- 9.1.4. Plant Hormone Interactions
- 9.2. Market Analysis, Insights and Forecast - by Types
- 9.2.1. ELISA
- 9.2.2. HPLC
- 9.2.3. HPLC-MS
- 9.1. Market Analysis, Insights and Forecast - by Application
- 10. Asia Pacific Plant Hormone Analysis Analysis, Insights and Forecast, 2020-2032
- 10.1. Market Analysis, Insights and Forecast - by Application
- 10.1.1. Research on Pant Growth, Reproduction and Development
- 10.1.2. Abiotic Stress Research
- 10.1.3. Biological Stress Response Research
- 10.1.4. Plant Hormone Interactions
- 10.2. Market Analysis, Insights and Forecast - by Types
- 10.2.1. ELISA
- 10.2.2. HPLC
- 10.2.3. HPLC-MS
- 10.1. Market Analysis, Insights and Forecast - by Application
- 11. Competitive Analysis
- 11.1. Global Market Share Analysis 2025
- 11.2. Company Profiles
- 11.2.1 Creative Proteomics
- 11.2.1.1. Overview
- 11.2.1.2. Products
- 11.2.1.3. SWOT Analysis
- 11.2.1.4. Recent Developments
- 11.2.1.5. Financials (Based on Availability)
- 11.2.2 Lifeasible
- 11.2.2.1. Overview
- 11.2.2.2. Products
- 11.2.2.3. SWOT Analysis
- 11.2.2.4. Recent Developments
- 11.2.2.5. Financials (Based on Availability)
- 11.2.3 Metware Biotechnology
- 11.2.3.1. Overview
- 11.2.3.2. Products
- 11.2.3.3. SWOT Analysis
- 11.2.3.4. Recent Developments
- 11.2.3.5. Financials (Based on Availability)
- 11.2.4 MtoZ Biolabs
- 11.2.4.1. Overview
- 11.2.4.2. Products
- 11.2.4.3. SWOT Analysis
- 11.2.4.4. Recent Developments
- 11.2.4.5. Financials (Based on Availability)
- 11.2.5 Creative Biogene
- 11.2.5.1. Overview
- 11.2.5.2. Products
- 11.2.5.3. SWOT Analysis
- 11.2.5.4. Recent Developments
- 11.2.5.5. Financials (Based on Availability)
- 11.2.6 Anacon Laboratories
- 11.2.6.1. Overview
- 11.2.6.2. Products
- 11.2.6.3. SWOT Analysis
- 11.2.6.4. Recent Developments
- 11.2.6.5. Financials (Based on Availability)
- 11.2.7 Springer Nature Experiments
- 11.2.7.1. Overview
- 11.2.7.2. Products
- 11.2.7.3. SWOT Analysis
- 11.2.7.4. Recent Developments
- 11.2.7.5. Financials (Based on Availability)
- 11.2.8 IBMCP
- 11.2.8.1. Overview
- 11.2.8.2. Products
- 11.2.8.3. SWOT Analysis
- 11.2.8.4. Recent Developments
- 11.2.8.5. Financials (Based on Availability)
- 11.2.1 Creative Proteomics
List of Figures
- Figure 1: Global Plant Hormone Analysis Revenue Breakdown (undefined, %) by Region 2025 & 2033
- Figure 2: North America Plant Hormone Analysis Revenue (undefined), by Application 2025 & 2033
- Figure 3: North America Plant Hormone Analysis Revenue Share (%), by Application 2025 & 2033
- Figure 4: North America Plant Hormone Analysis Revenue (undefined), by Types 2025 & 2033
- Figure 5: North America Plant Hormone Analysis Revenue Share (%), by Types 2025 & 2033
- Figure 6: North America Plant Hormone Analysis Revenue (undefined), by Country 2025 & 2033
- Figure 7: North America Plant Hormone Analysis Revenue Share (%), by Country 2025 & 2033
- Figure 8: South America Plant Hormone Analysis Revenue (undefined), by Application 2025 & 2033
- Figure 9: South America Plant Hormone Analysis Revenue Share (%), by Application 2025 & 2033
- Figure 10: South America Plant Hormone Analysis Revenue (undefined), by Types 2025 & 2033
- Figure 11: South America Plant Hormone Analysis Revenue Share (%), by Types 2025 & 2033
- Figure 12: South America Plant Hormone Analysis Revenue (undefined), by Country 2025 & 2033
- Figure 13: South America Plant Hormone Analysis Revenue Share (%), by Country 2025 & 2033
- Figure 14: Europe Plant Hormone Analysis Revenue (undefined), by Application 2025 & 2033
- Figure 15: Europe Plant Hormone Analysis Revenue Share (%), by Application 2025 & 2033
- Figure 16: Europe Plant Hormone Analysis Revenue (undefined), by Types 2025 & 2033
- Figure 17: Europe Plant Hormone Analysis Revenue Share (%), by Types 2025 & 2033
- Figure 18: Europe Plant Hormone Analysis Revenue (undefined), by Country 2025 & 2033
- Figure 19: Europe Plant Hormone Analysis Revenue Share (%), by Country 2025 & 2033
- Figure 20: Middle East & Africa Plant Hormone Analysis Revenue (undefined), by Application 2025 & 2033
- Figure 21: Middle East & Africa Plant Hormone Analysis Revenue Share (%), by Application 2025 & 2033
- Figure 22: Middle East & Africa Plant Hormone Analysis Revenue (undefined), by Types 2025 & 2033
- Figure 23: Middle East & Africa Plant Hormone Analysis Revenue Share (%), by Types 2025 & 2033
- Figure 24: Middle East & Africa Plant Hormone Analysis Revenue (undefined), by Country 2025 & 2033
- Figure 25: Middle East & Africa Plant Hormone Analysis Revenue Share (%), by Country 2025 & 2033
- Figure 26: Asia Pacific Plant Hormone Analysis Revenue (undefined), by Application 2025 & 2033
- Figure 27: Asia Pacific Plant Hormone Analysis Revenue Share (%), by Application 2025 & 2033
- Figure 28: Asia Pacific Plant Hormone Analysis Revenue (undefined), by Types 2025 & 2033
- Figure 29: Asia Pacific Plant Hormone Analysis Revenue Share (%), by Types 2025 & 2033
- Figure 30: Asia Pacific Plant Hormone Analysis Revenue (undefined), by Country 2025 & 2033
- Figure 31: Asia Pacific Plant Hormone Analysis Revenue Share (%), by Country 2025 & 2033
List of Tables
- Table 1: Global Plant Hormone Analysis Revenue undefined Forecast, by Application 2020 & 2033
- Table 2: Global Plant Hormone Analysis Revenue undefined Forecast, by Types 2020 & 2033
- Table 3: Global Plant Hormone Analysis Revenue undefined Forecast, by Region 2020 & 2033
- Table 4: Global Plant Hormone Analysis Revenue undefined Forecast, by Application 2020 & 2033
- Table 5: Global Plant Hormone Analysis Revenue undefined Forecast, by Types 2020 & 2033
- Table 6: Global Plant Hormone Analysis Revenue undefined Forecast, by Country 2020 & 2033
- Table 7: United States Plant Hormone Analysis Revenue (undefined) Forecast, by Application 2020 & 2033
- Table 8: Canada Plant Hormone Analysis Revenue (undefined) Forecast, by Application 2020 & 2033
- Table 9: Mexico Plant Hormone Analysis Revenue (undefined) Forecast, by Application 2020 & 2033
- Table 10: Global Plant Hormone Analysis Revenue undefined Forecast, by Application 2020 & 2033
- Table 11: Global Plant Hormone Analysis Revenue undefined Forecast, by Types 2020 & 2033
- Table 12: Global Plant Hormone Analysis Revenue undefined Forecast, by Country 2020 & 2033
- Table 13: Brazil Plant Hormone Analysis Revenue (undefined) Forecast, by Application 2020 & 2033
- Table 14: Argentina Plant Hormone Analysis Revenue (undefined) Forecast, by Application 2020 & 2033
- Table 15: Rest of South America Plant Hormone Analysis Revenue (undefined) Forecast, by Application 2020 & 2033
- Table 16: Global Plant Hormone Analysis Revenue undefined Forecast, by Application 2020 & 2033
- Table 17: Global Plant Hormone Analysis Revenue undefined Forecast, by Types 2020 & 2033
- Table 18: Global Plant Hormone Analysis Revenue undefined Forecast, by Country 2020 & 2033
- Table 19: United Kingdom Plant Hormone Analysis Revenue (undefined) Forecast, by Application 2020 & 2033
- Table 20: Germany Plant Hormone Analysis Revenue (undefined) Forecast, by Application 2020 & 2033
- Table 21: France Plant Hormone Analysis Revenue (undefined) Forecast, by Application 2020 & 2033
- Table 22: Italy Plant Hormone Analysis Revenue (undefined) Forecast, by Application 2020 & 2033
- Table 23: Spain Plant Hormone Analysis Revenue (undefined) Forecast, by Application 2020 & 2033
- Table 24: Russia Plant Hormone Analysis Revenue (undefined) Forecast, by Application 2020 & 2033
- Table 25: Benelux Plant Hormone Analysis Revenue (undefined) Forecast, by Application 2020 & 2033
- Table 26: Nordics Plant Hormone Analysis Revenue (undefined) Forecast, by Application 2020 & 2033
- Table 27: Rest of Europe Plant Hormone Analysis Revenue (undefined) Forecast, by Application 2020 & 2033
- Table 28: Global Plant Hormone Analysis Revenue undefined Forecast, by Application 2020 & 2033
- Table 29: Global Plant Hormone Analysis Revenue undefined Forecast, by Types 2020 & 2033
- Table 30: Global Plant Hormone Analysis Revenue undefined Forecast, by Country 2020 & 2033
- Table 31: Turkey Plant Hormone Analysis Revenue (undefined) Forecast, by Application 2020 & 2033
- Table 32: Israel Plant Hormone Analysis Revenue (undefined) Forecast, by Application 2020 & 2033
- Table 33: GCC Plant Hormone Analysis Revenue (undefined) Forecast, by Application 2020 & 2033
- Table 34: North Africa Plant Hormone Analysis Revenue (undefined) Forecast, by Application 2020 & 2033
- Table 35: South Africa Plant Hormone Analysis Revenue (undefined) Forecast, by Application 2020 & 2033
- Table 36: Rest of Middle East & Africa Plant Hormone Analysis Revenue (undefined) Forecast, by Application 2020 & 2033
- Table 37: Global Plant Hormone Analysis Revenue undefined Forecast, by Application 2020 & 2033
- Table 38: Global Plant Hormone Analysis Revenue undefined Forecast, by Types 2020 & 2033
- Table 39: Global Plant Hormone Analysis Revenue undefined Forecast, by Country 2020 & 2033
- Table 40: China Plant Hormone Analysis Revenue (undefined) Forecast, by Application 2020 & 2033
- Table 41: India Plant Hormone Analysis Revenue (undefined) Forecast, by Application 2020 & 2033
- Table 42: Japan Plant Hormone Analysis Revenue (undefined) Forecast, by Application 2020 & 2033
- Table 43: South Korea Plant Hormone Analysis Revenue (undefined) Forecast, by Application 2020 & 2033
- Table 44: ASEAN Plant Hormone Analysis Revenue (undefined) Forecast, by Application 2020 & 2033
- Table 45: Oceania Plant Hormone Analysis Revenue (undefined) Forecast, by Application 2020 & 2033
- Table 46: Rest of Asia Pacific Plant Hormone Analysis Revenue (undefined) Forecast, by Application 2020 & 2033
Frequently Asked Questions
1. What is the projected Compound Annual Growth Rate (CAGR) of the Plant Hormone Analysis?
The projected CAGR is approximately 8.86%.
2. Which companies are prominent players in the Plant Hormone Analysis?
Key companies in the market include Creative Proteomics, Lifeasible, Metware Biotechnology, MtoZ Biolabs, Creative Biogene, Anacon Laboratories, Springer Nature Experiments, IBMCP.
3. What are the main segments of the Plant Hormone Analysis?
The market segments include Application, Types.
4. Can you provide details about the market size?
The market size is estimated to be USD XXX N/A as of 2022.
5. What are some drivers contributing to market growth?
N/A
6. What are the notable trends driving market growth?
N/A
7. Are there any restraints impacting market growth?
N/A
8. Can you provide examples of recent developments in the market?
N/A
9. What pricing options are available for accessing the report?
Pricing options include single-user, multi-user, and enterprise licenses priced at USD 3350.00, USD 5025.00, and USD 6700.00 respectively.
10. Is the market size provided in terms of value or volume?
The market size is provided in terms of value, measured in N/A.
11. Are there any specific market keywords associated with the report?
Yes, the market keyword associated with the report is "Plant Hormone Analysis," which aids in identifying and referencing the specific market segment covered.
12. How do I determine which pricing option suits my needs best?
The pricing options vary based on user requirements and access needs. Individual users may opt for single-user licenses, while businesses requiring broader access may choose multi-user or enterprise licenses for cost-effective access to the report.
13. Are there any additional resources or data provided in the Plant Hormone Analysis report?
While the report offers comprehensive insights, it's advisable to review the specific contents or supplementary materials provided to ascertain if additional resources or data are available.
14. How can I stay updated on further developments or reports in the Plant Hormone Analysis?
To stay informed about further developments, trends, and reports in the Plant Hormone Analysis, consider subscribing to industry newsletters, following relevant companies and organizations, or regularly checking reputable industry news sources and publications.
Methodology
Step 1 - Identification of Relevant Samples Size from Population Database


Step 2 - Approaches for Defining Global Market Size (Value, Volume* & Price*)

Note*: In applicable scenarios
Step 3 - Data Sources
Primary Research
- Web Analytics
- Survey Reports
- Research Institute
- Latest Research Reports
- Opinion Leaders
Secondary Research
- Annual Reports
- White Paper
- Latest Press Release
- Industry Association
- Paid Database
- Investor Presentations

Step 4 - Data Triangulation
Involves using different sources of information in order to increase the validity of a study
These sources are likely to be stakeholders in a program - participants, other researchers, program staff, other community members, and so on.
Then we put all data in single framework & apply various statistical tools to find out the dynamic on the market.
During the analysis stage, feedback from the stakeholder groups would be compared to determine areas of agreement as well as areas of divergence