

Key Insights
The Premium Bakery Products market is projected to achieve a size of 494.7 billion by 2033, expanding at a Compound Annual Growth Rate (CAGR) of 4.78% from a base year of 2025. This growth is propelled by shifting consumer preferences towards artisanal, high-quality baked goods, enhanced by increasing disposable incomes. Consumers increasingly seek products made with premium, healthier ingredients, including whole grains and reduced sugar, alongside innovative flavor profiles. The Cakes and Pastries segment is expected to lead this expansion, driven by their association with celebrations and gifting. The "others" segment, featuring specialized dietary options like gluten-free and vegan items, is also experiencing rapid adoption as manufacturers address niche consumer needs and wellness trends. Online retail channels are becoming crucial, offering convenience and direct access to premium products, thereby increasing market accessibility.
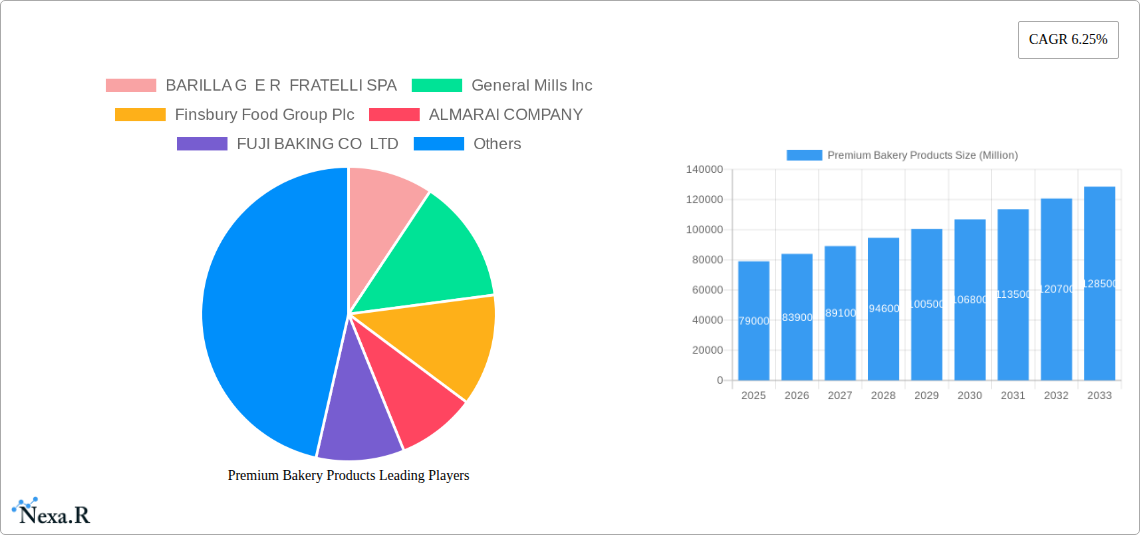
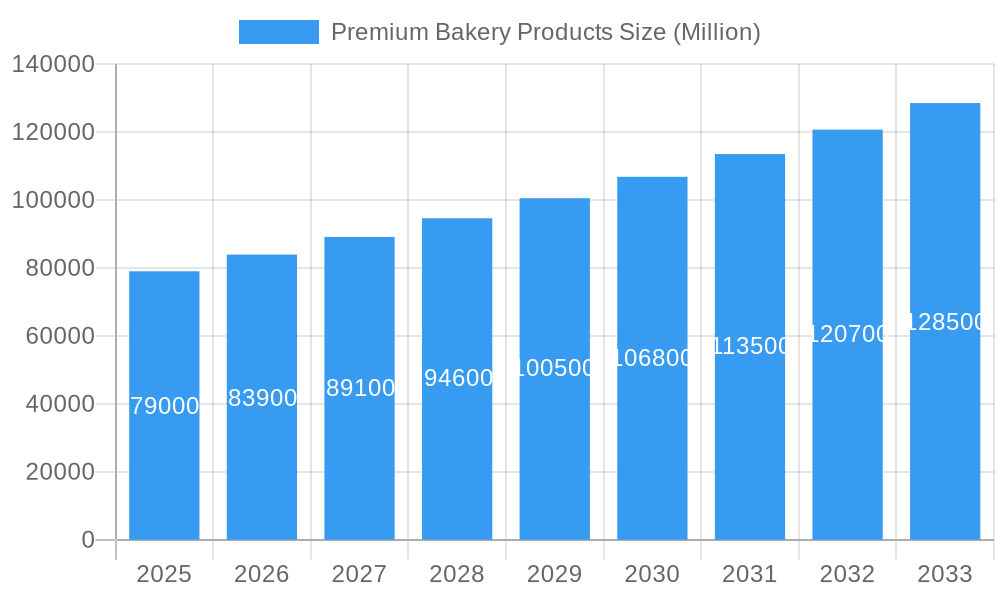
Premium Bakery Products Market Size (In Billion)
The market is characterized by robust competition and strategic initiatives from major players such as General Mills Inc., Mondelez International Inc., and Associated British Foods plc. These companies are focused on product innovation, sustainable sourcing, and distribution network enhancement to secure market share. The retail landscape is dynamic, with supermarkets and hypermarkets dedicating premium shelf space to high-end bakery items, complemented by specialty stores focusing on artisanal offerings. Geographically, the Asia Pacific region is poised for significant growth, fueled by its expanding middle class and the adoption of Western dietary habits. Mature markets in Europe and North America will continue their steady growth through innovation and sustained consumer demand for indulgent, high-quality products. Potential challenges include rising raw material costs and stringent food safety regulations, but the premium bakery products market's adaptability to consumer demands and strong growth momentum indicate a highly positive outlook.
Premium Bakery Products Company Market Share
Premium Bakery Products Market Analysis: Global Trends, Growth Drivers, and Forecast
This report offers a comprehensive analysis of the global premium bakery products market, detailing market dynamics, growth trends, regional performance, product innovations, key players, and future opportunities. It provides actionable insights for industry professionals, investors, and strategists navigating the evolving high-quality baked goods sector, from artisanal breads and gourmet cakes to specialty cookies. Our analysis covers the parent bakery products market and its premium segment, offering a holistic view of market structure and potential. The study period spans 2019-2033, with a detailed base year of 2025 and a forecast period of 2025-2033, building on historical data from 2019-2024.
Premium Bakery Products Market Dynamics & Structure
The premium bakery products market is characterized by a moderately concentrated structure, with key players focusing on product differentiation and brand building. Technological innovation plays a crucial role, driven by advancements in baking techniques, ingredient sourcing, and sustainable packaging solutions. Regulatory frameworks, particularly concerning food safety, labeling, and ingredient transparency, influence product development and market entry. Competitive product substitutes, including other premium snack categories and home-baking kits, present ongoing challenges. End-user demographics are shifting towards health-conscious consumers, demanding artisanal quality, natural ingredients, and unique flavor profiles. Mergers and acquisitions (M&A) are a significant trend, with companies seeking to expand their product portfolios, market reach, and technological capabilities.
- Market Concentration: Dominated by a few large multinational corporations and a growing number of niche, artisanal producers.
- Technological Innovation Drivers: Focus on clean label ingredients, plant-based alternatives, and advanced processing for extended shelf life without compromising quality.
- Regulatory Frameworks: Stringent food safety standards, allergen labeling, and increasing demand for ethical sourcing.
- Competitive Product Substitutes: Premium confectionery, ready-to-eat meals, and health-focused snack bars.
- End-User Demographics: Growing middle class, millennials and Gen Z with disposable income and a preference for experiential and high-quality food products.
- M&A Trends: Strategic acquisitions to gain market share, acquire innovative technologies, and expand into new geographical regions. For instance, the acquisition of Chipita S.A. by Mondelez International in May 2021 for approximately USD 2 billion highlights this trend.
Premium Bakery Products Growth Trends & Insights
The global premium bakery products market is poised for robust growth, fueled by evolving consumer preferences and increasing disposable incomes. The market size is projected to witness a significant expansion from approximately $120,000 million units in the base year 2025, driven by a Compound Annual Growth Rate (CAGR) of xx% during the forecast period of 2025–2033. Adoption rates for premium offerings are increasing as consumers prioritize quality, health benefits, and unique taste experiences over price. Technological disruptions, such as advanced baking equipment that mimics artisanal processes and the integration of AI in production and supply chain management, are enhancing efficiency and product consistency. Consumer behavior shifts are evident, with a rising demand for convenience, personalized options, and products with traceable ingredients and sustainable sourcing. The penetration of premium bakery products is expected to deepen, particularly in emerging economies where a growing middle class seeks aspirational food choices.
- Market Size Evolution: Projected to grow significantly, reaching an estimated $150,000 million units by 2030.
- Adoption Rates: Steadily increasing, driven by a growing appreciation for quality, taste, and perceived health benefits.
- Technological Disruptions: Innovations in ingredient technology (e.g., natural preservatives, alternative flours), automated artisanal baking, and online customization platforms are reshaping the industry.
- Consumer Behavior Shifts: Emphasis on "free-from" products (gluten-free, dairy-free), organic certification, plant-based ingredients, and visually appealing, Instagrammable baked goods.
- Market Penetration: Expanding into urban centers and suburban areas with higher consumer spending power, with a projected penetration rate of xx% in key markets by 2030.
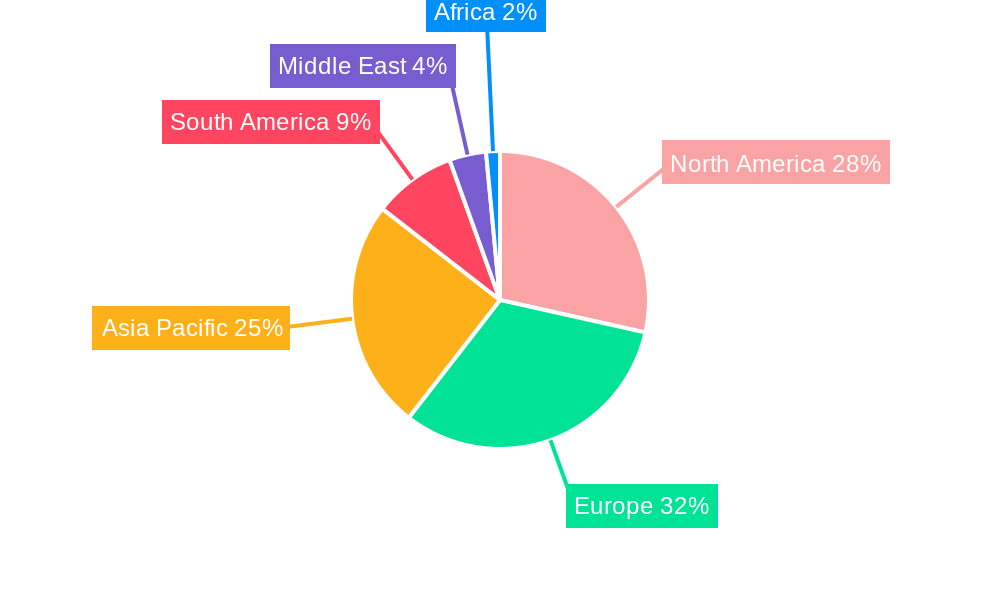
Dominant Regions, Countries, or Segments in Premium Bakery Products
North America and Europe currently dominate the global premium bakery products market, driven by mature economies, established distribution networks, and a strong consumer demand for high-quality baked goods. Within these regions, Cakes and Pastries emerge as the leading product segment, accounting for an estimated xx% of the market share in 2025. This dominance is attributed to their versatility, celebratory appeal, and the continuous innovation in flavor profiles, decorative techniques, and dietary options (e.g., vegan, gluten-free cakes). Supermarkets/Hypermarkets are the primary distribution channel, capturing approximately xx% of sales due to their convenience and wide product selection.
However, significant growth potential exists in the Asia-Pacific region, particularly in countries like China and India, where rapid urbanization, rising disposable incomes, and increasing Westernization are fueling demand for premium bakery items. The Online Retail Stores distribution channel is experiencing exponential growth across all regions, projected to reach xx% market share by 2033, driven by convenience and the ability to offer a wider range of specialized products. Countries such as the United States, the United Kingdom, and Germany are key markets within the dominant regions, characterized by sophisticated consumer tastes and strong brand loyalty. Economic policies that support small and medium-sized enterprises (SMEs) and infrastructure development for cold chain logistics are critical for market expansion.
- Dominant Regions: North America, Europe.
- Emerging Regions: Asia-Pacific (China, India), Latin America.
- Leading Product Segment: Cakes and Pastries.
- Key Drivers for Cakes & Pastries: Indulgence, gifting occasions, customization options, and innovation in dietary-friendly alternatives.
- Dominant Distribution Channel: Supermarkets/Hypermarkets.
- Growth Drivers for Supermarkets/Hypermarkets: One-stop shopping convenience, competitive pricing, and widespread availability of premium brands.
- Fastest Growing Distribution Channel: Online Retail Stores.
- Drivers for Online Retail: Convenience, wider selection, direct-to-consumer models, and personalized offers.
- Key Countries: United States, United Kingdom, Germany, France, China, Japan.
Premium Bakery Products Product Landscape
The product landscape of premium bakery products is defined by innovation and a commitment to superior quality. Consumers are increasingly seeking artisanal breads made with heritage grains and long fermentation processes, alongside elaborately decorated cakes and pastries crafted with premium ingredients like Belgian chocolate and exotic fruits. The cookies and biscuits segment is witnessing a rise in gourmet, single-origin, and health-conscious options, such as gluten-free, vegan, and low-sugar varieties. Product performance is measured by taste, texture, ingredient quality, visual appeal, and perceived health benefits. Technological advancements are enabling manufacturers to create products with enhanced nutritional profiles, extended shelf life through natural methods, and unique flavor fusions.
Key Drivers, Barriers & Challenges in Premium Bakery Products
The premium bakery products market is propelled by several key drivers, including the growing consumer preference for high-quality, artisanal, and health-conscious food options. An increasing disposable income in emerging economies and the growing influence of social media trends showcasing visually appealing baked goods also contribute significantly to market growth. Furthermore, innovations in ingredients and baking technologies that cater to specific dietary needs (e.g., gluten-free, vegan) are expanding the consumer base.
However, the market faces several barriers and challenges. High ingredient costs, particularly for premium and organic components, can lead to higher retail prices, potentially limiting affordability for some consumer segments. Stringent regulatory requirements for food safety and labeling can increase operational costs and complexity. Supply chain disruptions, especially for specialized ingredients, can impact production and availability. Intense competition from both established players and emerging artisanal bakeries necessitates continuous product innovation and effective marketing strategies to maintain market share.
- Key Drivers:
- Rising demand for artisanal and gourmet baked goods.
- Increasing disposable incomes and consumer spending on premium food items.
- Growing health and wellness consciousness driving demand for "free-from" and natural products.
- Influence of social media and food bloggers on consumer preferences.
- Technological advancements in baking and ingredient formulation.
- Barriers & Challenges:
- High raw material costs and sourcing complexities.
- Strict food safety regulations and labeling requirements.
- Supply chain volatility and logistical challenges.
- Intense competition and the need for continuous innovation.
- Price sensitivity among certain consumer segments.
Emerging Opportunities in Premium Bakery Products
Emerging opportunities in the premium bakery products industry lie in the expansion of plant-based and vegan offerings, catering to a rapidly growing ethical consumer segment. The demand for personalized and customizable bakery items, facilitated by e-commerce platforms and direct-to-consumer models, presents a significant growth avenue. Furthermore, the integration of functional ingredients, such as probiotics, prebiotics, and adaptogens, into premium baked goods to enhance health benefits offers a niche but growing market. Exploring untapped markets in developing economies with rising middle-class populations and introducing innovative product formats for on-the-go consumption are also key opportunities.
Growth Accelerators in the Premium Bakery Products Industry
Several factors are accelerating growth in the premium bakery products industry. Technological breakthroughs in ingredient sourcing and processing allow for the creation of healthier and more sustainable products. Strategic partnerships between ingredient suppliers, manufacturers, and retailers are streamlining supply chains and expanding market reach. The increasing adoption of e-commerce and direct-to-consumer strategies allows for greater customer engagement and personalized offerings, driving sales and brand loyalty. Furthermore, the continuous development of unique flavor profiles and product innovations that align with emerging dietary trends (e.g., keto-friendly, low-carb) are attracting new consumer segments and encouraging repeat purchases.
Key Players Shaping the Premium Bakery Products Market
- BARILLA G E R FRATELLI SPA
- General Mills Inc
- Finsbury Food Group Plc
- ALMARAI COMPANY
- FUJI BAKING CO LTD
- Associated British Foods plc
- Mondelez International Inc
- Bimbo Bakeries USA
- Bakers Delight Holdings Limited
- Britannia Industries Ltd
Notable Milestones in Premium Bakery Products Sector
- April 2022: Walker's Shortbread partners with retailer Dufry for the launch of a new Global Travel Retailer range into more than 55 travel sites worldwide, including France, featuring various shortbreads and other products.
- April 2022: Burton's Biscuit Company announces their merger with Fox's Biscuits, forming a new entity under the leadership of Simon Browne to develop innovative biscuit products.
- May 2021: Mondelez International declares the acquisition of Greek snacking company Chipita S.A. for approximately USD 2 billion, expanding its portfolio in the savory and sweet snacks market in Europe.
In-Depth Premium Bakery Products Market Outlook
The future outlook for the premium bakery products market is exceptionally bright, driven by sustained consumer demand for quality, health, and unique culinary experiences. Growth accelerators include the ongoing innovation in clean label ingredients, plant-based alternatives, and functional food integration. Strategic alliances and a growing emphasis on direct-to-consumer models will further enhance market penetration and customer engagement. The increasing disposable incomes in emerging economies, coupled with a growing awareness of global food trends, are poised to create significant untapped potential. Companies that focus on sustainability, ethical sourcing, and personalized offerings will be best positioned to capitalize on the evolving market landscape and achieve substantial long-term growth.
Premium Bakery Products Segmentation
-
1. Product Type
- 1.1. Breads
- 1.2. Cookies and Biscuits
- 1.3. Morning Goods
- 1.4. Cakes and Pastries
- 1.5. others
-
2. Distibution Channel
- 2.1. Supermarkets/Hypermarkets
- 2.2. Speciality stores
- 2.3. Online Retail Stores
- 2.4. Other Distribution Channels
Premium Bakery Products Segmentation By Geography
-
1. North America
- 1.1. United States
- 1.2. Canada
- 1.3. Mexico
- 1.4. Rest of North America
-
2. Europe
- 2.1. United Kingdom
- 2.2. Germany
- 2.3. Spain
- 2.4. France
- 2.5. Italy
- 2.6. Russia
- 2.7. Rest of Europe
-
3. Asia Pacific
- 3.1. China
- 3.2. Japan
- 3.3. India
- 3.4. Australia
- 3.5. Rest of Asia Pacific
-
4. South America
- 4.1. Brazil
- 4.2. Argentina
- 4.3. Rest of South America
- 5. Middle East
-
6. Saudi Arabia
- 6.1. South Africa
- 6.2. Rest of Middle East
Premium Bakery Products Regional Market Share
Geographic Coverage of Premium Bakery Products
Premium Bakery Products REPORT HIGHLIGHTS
| Aspects | Details |
|---|---|
| Study Period | 2020-2034 |
| Base Year | 2025 |
| Estimated Year | 2026 |
| Forecast Period | 2026-2034 |
| Historical Period | 2020-2025 |
| Growth Rate | CAGR of 4.78% from 2020-2034 |
| Segmentation |
|
Table of Contents
- 1. Introduction
- 1.1. Research Scope
- 1.2. Market Segmentation
- 1.3. Research Objective
- 1.4. Definitions and Assumptions
- 2. Executive Summary
- 2.1. Market Snapshot
- 3. Market Dynamics
- 3.1. Market Drivers
- 3.2. Market Restrains
- 3.3. Market Trends
- 3.4. Market Opportunities
- 4. Market Factor Analysis
- 4.1. Porters Five Forces
- 4.1.1. Bargaining Power of Suppliers
- 4.1.2. Bargaining Power of Buyers
- 4.1.3. Threat of New Entrants
- 4.1.4. Threat of Substitutes
- 4.1.5. Competitive Rivalry
- 4.2. PESTEL analysis
- 4.3. BCG Analysis
- 4.3.1. Stars (High Growth, High Market Share)
- 4.3.2. Cash Cows (Low Growth, High Market Share)
- 4.3.3. Question Mark (High Growth, Low Market Share)
- 4.3.4. Dogs (Low Growth, Low Market Share)
- 4.4. Ansoff Matrix Analysis
- 4.5. Supply Chain Analysis
- 4.6. Regulatory Landscape
- 4.7. Current Market Potential and Opportunity Assessment (TAM–SAM–SOM Framework)
- 4.8. NRP Analyst Note
- 4.1. Porters Five Forces
- 5. Market Analysis, Insights and Forecast 2021-2033
- 5.1. Market Analysis, Insights and Forecast - by Product Type
- 5.1.1. Breads
- 5.1.2. Cookies and Biscuits
- 5.1.3. Morning Goods
- 5.1.4. Cakes and Pastries
- 5.1.5. others
- 5.2. Market Analysis, Insights and Forecast - by Distibution Channel
- 5.2.1. Supermarkets/Hypermarkets
- 5.2.2. Speciality stores
- 5.2.3. Online Retail Stores
- 5.2.4. Other Distribution Channels
- 5.3. Market Analysis, Insights and Forecast - by Region
- 5.3.1. North America
- 5.3.2. Europe
- 5.3.3. Asia Pacific
- 5.3.4. South America
- 5.3.5. Middle East
- 5.3.6. Saudi Arabia
- 5.1. Market Analysis, Insights and Forecast - by Product Type
- 6. Global Premium Bakery Products Analysis, Insights and Forecast, 2021-2033
- 6.1. Market Analysis, Insights and Forecast - by Product Type
- 6.1.1. Breads
- 6.1.2. Cookies and Biscuits
- 6.1.3. Morning Goods
- 6.1.4. Cakes and Pastries
- 6.1.5. others
- 6.2. Market Analysis, Insights and Forecast - by Distibution Channel
- 6.2.1. Supermarkets/Hypermarkets
- 6.2.2. Speciality stores
- 6.2.3. Online Retail Stores
- 6.2.4. Other Distribution Channels
- 6.1. Market Analysis, Insights and Forecast - by Product Type
- 7. North America Premium Bakery Products Analysis, Insights and Forecast, 2020-2032
- 7.1. Market Analysis, Insights and Forecast - by Product Type
- 7.1.1. Breads
- 7.1.2. Cookies and Biscuits
- 7.1.3. Morning Goods
- 7.1.4. Cakes and Pastries
- 7.1.5. others
- 7.2. Market Analysis, Insights and Forecast - by Distibution Channel
- 7.2.1. Supermarkets/Hypermarkets
- 7.2.2. Speciality stores
- 7.2.3. Online Retail Stores
- 7.2.4. Other Distribution Channels
- 7.1. Market Analysis, Insights and Forecast - by Product Type
- 8. Europe Premium Bakery Products Analysis, Insights and Forecast, 2020-2032
- 8.1. Market Analysis, Insights and Forecast - by Product Type
- 8.1.1. Breads
- 8.1.2. Cookies and Biscuits
- 8.1.3. Morning Goods
- 8.1.4. Cakes and Pastries
- 8.1.5. others
- 8.2. Market Analysis, Insights and Forecast - by Distibution Channel
- 8.2.1. Supermarkets/Hypermarkets
- 8.2.2. Speciality stores
- 8.2.3. Online Retail Stores
- 8.2.4. Other Distribution Channels
- 8.1. Market Analysis, Insights and Forecast - by Product Type
- 9. Asia Pacific Premium Bakery Products Analysis, Insights and Forecast, 2020-2032
- 9.1. Market Analysis, Insights and Forecast - by Product Type
- 9.1.1. Breads
- 9.1.2. Cookies and Biscuits
- 9.1.3. Morning Goods
- 9.1.4. Cakes and Pastries
- 9.1.5. others
- 9.2. Market Analysis, Insights and Forecast - by Distibution Channel
- 9.2.1. Supermarkets/Hypermarkets
- 9.2.2. Speciality stores
- 9.2.3. Online Retail Stores
- 9.2.4. Other Distribution Channels
- 9.1. Market Analysis, Insights and Forecast - by Product Type
- 10. South America Premium Bakery Products Analysis, Insights and Forecast, 2020-2032
- 10.1. Market Analysis, Insights and Forecast - by Product Type
- 10.1.1. Breads
- 10.1.2. Cookies and Biscuits
- 10.1.3. Morning Goods
- 10.1.4. Cakes and Pastries
- 10.1.5. others
- 10.2. Market Analysis, Insights and Forecast - by Distibution Channel
- 10.2.1. Supermarkets/Hypermarkets
- 10.2.2. Speciality stores
- 10.2.3. Online Retail Stores
- 10.2.4. Other Distribution Channels
- 10.1. Market Analysis, Insights and Forecast - by Product Type
- 11. Middle East Premium Bakery Products Analysis, Insights and Forecast, 2020-2032
- 11.1. Market Analysis, Insights and Forecast - by Product Type
- 11.1.1. Breads
- 11.1.2. Cookies and Biscuits
- 11.1.3. Morning Goods
- 11.1.4. Cakes and Pastries
- 11.1.5. others
- 11.2. Market Analysis, Insights and Forecast - by Distibution Channel
- 11.2.1. Supermarkets/Hypermarkets
- 11.2.2. Speciality stores
- 11.2.3. Online Retail Stores
- 11.2.4. Other Distribution Channels
- 11.1. Market Analysis, Insights and Forecast - by Product Type
- 12. Saudi Arabia Premium Bakery Products Analysis, Insights and Forecast, 2020-2032
- 12.1. Market Analysis, Insights and Forecast - by Product Type
- 12.1.1. Breads
- 12.1.2. Cookies and Biscuits
- 12.1.3. Morning Goods
- 12.1.4. Cakes and Pastries
- 12.1.5. others
- 12.2. Market Analysis, Insights and Forecast - by Distibution Channel
- 12.2.1. Supermarkets/Hypermarkets
- 12.2.2. Speciality stores
- 12.2.3. Online Retail Stores
- 12.2.4. Other Distribution Channels
- 12.1. Market Analysis, Insights and Forecast - by Product Type
- 13. Competitive Analysis
- 13.1. Company Profiles
- 13.1.1 BARILLA G E R FRATELLI SPA
- 13.1.1.1. Company Overview
- 13.1.1.2. Products
- 13.1.1.3. Company Financials
- 13.1.1.4. SWOT Analysis
- 13.1.2 General Mills Inc
- 13.1.2.1. Company Overview
- 13.1.2.2. Products
- 13.1.2.3. Company Financials
- 13.1.2.4. SWOT Analysis
- 13.1.3 Finsbury Food Group Plc
- 13.1.3.1. Company Overview
- 13.1.3.2. Products
- 13.1.3.3. Company Financials
- 13.1.3.4. SWOT Analysis
- 13.1.4 ALMARAI COMPANY
- 13.1.4.1. Company Overview
- 13.1.4.2. Products
- 13.1.4.3. Company Financials
- 13.1.4.4. SWOT Analysis
- 13.1.5 FUJI BAKING CO LTD
- 13.1.5.1. Company Overview
- 13.1.5.2. Products
- 13.1.5.3. Company Financials
- 13.1.5.4. SWOT Analysis
- 13.1.6 Associated British Foods plc
- 13.1.6.1. Company Overview
- 13.1.6.2. Products
- 13.1.6.3. Company Financials
- 13.1.6.4. SWOT Analysis
- 13.1.7 Mondelez International Inc
- 13.1.7.1. Company Overview
- 13.1.7.2. Products
- 13.1.7.3. Company Financials
- 13.1.7.4. SWOT Analysis
- 13.1.8 Bimbo Bakeries USA
- 13.1.8.1. Company Overview
- 13.1.8.2. Products
- 13.1.8.3. Company Financials
- 13.1.8.4. SWOT Analysis
- 13.1.9 Bakers Delight Holdings Limited
- 13.1.9.1. Company Overview
- 13.1.9.2. Products
- 13.1.9.3. Company Financials
- 13.1.9.4. SWOT Analysis
- 13.1.10 Britannia Industries Ltd*List Not Exhaustive
- 13.1.10.1. Company Overview
- 13.1.10.2. Products
- 13.1.10.3. Company Financials
- 13.1.10.4. SWOT Analysis
- 13.1.1 BARILLA G E R FRATELLI SPA
- 13.2. Market Entropy
- 13.2.1 Company's Key Areas Served
- 13.2.2 Recent Developments
- 13.3. Company Market Share Analysis 2025
- 13.3.1 Top 5 Companies Market Share Analysis
- 13.3.2 Top 3 Companies Market Share Analysis
- 13.4. List of Potential Customers
- 14. Research Methodology
List of Figures
- Figure 1: Global Premium Bakery Products Revenue Breakdown (billion, %) by Region 2025 & 2033
- Figure 2: Global Premium Bakery Products Volume Breakdown (K Tons, %) by Region 2025 & 2033
- Figure 3: North America Premium Bakery Products Revenue (billion), by Product Type 2025 & 2033
- Figure 4: North America Premium Bakery Products Volume (K Tons), by Product Type 2025 & 2033
- Figure 5: North America Premium Bakery Products Revenue Share (%), by Product Type 2025 & 2033
- Figure 6: North America Premium Bakery Products Volume Share (%), by Product Type 2025 & 2033
- Figure 7: North America Premium Bakery Products Revenue (billion), by Distibution Channel 2025 & 2033
- Figure 8: North America Premium Bakery Products Volume (K Tons), by Distibution Channel 2025 & 2033
- Figure 9: North America Premium Bakery Products Revenue Share (%), by Distibution Channel 2025 & 2033
- Figure 10: North America Premium Bakery Products Volume Share (%), by Distibution Channel 2025 & 2033
- Figure 11: North America Premium Bakery Products Revenue (billion), by Country 2025 & 2033
- Figure 12: North America Premium Bakery Products Volume (K Tons), by Country 2025 & 2033
- Figure 13: North America Premium Bakery Products Revenue Share (%), by Country 2025 & 2033
- Figure 14: North America Premium Bakery Products Volume Share (%), by Country 2025 & 2033
- Figure 15: Europe Premium Bakery Products Revenue (billion), by Product Type 2025 & 2033
- Figure 16: Europe Premium Bakery Products Volume (K Tons), by Product Type 2025 & 2033
- Figure 17: Europe Premium Bakery Products Revenue Share (%), by Product Type 2025 & 2033
- Figure 18: Europe Premium Bakery Products Volume Share (%), by Product Type 2025 & 2033
- Figure 19: Europe Premium Bakery Products Revenue (billion), by Distibution Channel 2025 & 2033
- Figure 20: Europe Premium Bakery Products Volume (K Tons), by Distibution Channel 2025 & 2033
- Figure 21: Europe Premium Bakery Products Revenue Share (%), by Distibution Channel 2025 & 2033
- Figure 22: Europe Premium Bakery Products Volume Share (%), by Distibution Channel 2025 & 2033
- Figure 23: Europe Premium Bakery Products Revenue (billion), by Country 2025 & 2033
- Figure 24: Europe Premium Bakery Products Volume (K Tons), by Country 2025 & 2033
- Figure 25: Europe Premium Bakery Products Revenue Share (%), by Country 2025 & 2033
- Figure 26: Europe Premium Bakery Products Volume Share (%), by Country 2025 & 2033
- Figure 27: Asia Pacific Premium Bakery Products Revenue (billion), by Product Type 2025 & 2033
- Figure 28: Asia Pacific Premium Bakery Products Volume (K Tons), by Product Type 2025 & 2033
- Figure 29: Asia Pacific Premium Bakery Products Revenue Share (%), by Product Type 2025 & 2033
- Figure 30: Asia Pacific Premium Bakery Products Volume Share (%), by Product Type 2025 & 2033
- Figure 31: Asia Pacific Premium Bakery Products Revenue (billion), by Distibution Channel 2025 & 2033
- Figure 32: Asia Pacific Premium Bakery Products Volume (K Tons), by Distibution Channel 2025 & 2033
- Figure 33: Asia Pacific Premium Bakery Products Revenue Share (%), by Distibution Channel 2025 & 2033
- Figure 34: Asia Pacific Premium Bakery Products Volume Share (%), by Distibution Channel 2025 & 2033
- Figure 35: Asia Pacific Premium Bakery Products Revenue (billion), by Country 2025 & 2033
- Figure 36: Asia Pacific Premium Bakery Products Volume (K Tons), by Country 2025 & 2033
- Figure 37: Asia Pacific Premium Bakery Products Revenue Share (%), by Country 2025 & 2033
- Figure 38: Asia Pacific Premium Bakery Products Volume Share (%), by Country 2025 & 2033
- Figure 39: South America Premium Bakery Products Revenue (billion), by Product Type 2025 & 2033
- Figure 40: South America Premium Bakery Products Volume (K Tons), by Product Type 2025 & 2033
- Figure 41: South America Premium Bakery Products Revenue Share (%), by Product Type 2025 & 2033
- Figure 42: South America Premium Bakery Products Volume Share (%), by Product Type 2025 & 2033
- Figure 43: South America Premium Bakery Products Revenue (billion), by Distibution Channel 2025 & 2033
- Figure 44: South America Premium Bakery Products Volume (K Tons), by Distibution Channel 2025 & 2033
- Figure 45: South America Premium Bakery Products Revenue Share (%), by Distibution Channel 2025 & 2033
- Figure 46: South America Premium Bakery Products Volume Share (%), by Distibution Channel 2025 & 2033
- Figure 47: South America Premium Bakery Products Revenue (billion), by Country 2025 & 2033
- Figure 48: South America Premium Bakery Products Volume (K Tons), by Country 2025 & 2033
- Figure 49: South America Premium Bakery Products Revenue Share (%), by Country 2025 & 2033
- Figure 50: South America Premium Bakery Products Volume Share (%), by Country 2025 & 2033
- Figure 51: Middle East Premium Bakery Products Revenue (billion), by Product Type 2025 & 2033
- Figure 52: Middle East Premium Bakery Products Volume (K Tons), by Product Type 2025 & 2033
- Figure 53: Middle East Premium Bakery Products Revenue Share (%), by Product Type 2025 & 2033
- Figure 54: Middle East Premium Bakery Products Volume Share (%), by Product Type 2025 & 2033
- Figure 55: Middle East Premium Bakery Products Revenue (billion), by Distibution Channel 2025 & 2033
- Figure 56: Middle East Premium Bakery Products Volume (K Tons), by Distibution Channel 2025 & 2033
- Figure 57: Middle East Premium Bakery Products Revenue Share (%), by Distibution Channel 2025 & 2033
- Figure 58: Middle East Premium Bakery Products Volume Share (%), by Distibution Channel 2025 & 2033
- Figure 59: Middle East Premium Bakery Products Revenue (billion), by Country 2025 & 2033
- Figure 60: Middle East Premium Bakery Products Volume (K Tons), by Country 2025 & 2033
- Figure 61: Middle East Premium Bakery Products Revenue Share (%), by Country 2025 & 2033
- Figure 62: Middle East Premium Bakery Products Volume Share (%), by Country 2025 & 2033
- Figure 63: Saudi Arabia Premium Bakery Products Revenue (billion), by Product Type 2025 & 2033
- Figure 64: Saudi Arabia Premium Bakery Products Volume (K Tons), by Product Type 2025 & 2033
- Figure 65: Saudi Arabia Premium Bakery Products Revenue Share (%), by Product Type 2025 & 2033
- Figure 66: Saudi Arabia Premium Bakery Products Volume Share (%), by Product Type 2025 & 2033
- Figure 67: Saudi Arabia Premium Bakery Products Revenue (billion), by Distibution Channel 2025 & 2033
- Figure 68: Saudi Arabia Premium Bakery Products Volume (K Tons), by Distibution Channel 2025 & 2033
- Figure 69: Saudi Arabia Premium Bakery Products Revenue Share (%), by Distibution Channel 2025 & 2033
- Figure 70: Saudi Arabia Premium Bakery Products Volume Share (%), by Distibution Channel 2025 & 2033
- Figure 71: Saudi Arabia Premium Bakery Products Revenue (billion), by Country 2025 & 2033
- Figure 72: Saudi Arabia Premium Bakery Products Volume (K Tons), by Country 2025 & 2033
- Figure 73: Saudi Arabia Premium Bakery Products Revenue Share (%), by Country 2025 & 2033
- Figure 74: Saudi Arabia Premium Bakery Products Volume Share (%), by Country 2025 & 2033
List of Tables
- Table 1: Global Premium Bakery Products Revenue billion Forecast, by Product Type 2020 & 2033
- Table 2: Global Premium Bakery Products Volume K Tons Forecast, by Product Type 2020 & 2033
- Table 3: Global Premium Bakery Products Revenue billion Forecast, by Distibution Channel 2020 & 2033
- Table 4: Global Premium Bakery Products Volume K Tons Forecast, by Distibution Channel 2020 & 2033
- Table 5: Global Premium Bakery Products Revenue billion Forecast, by Region 2020 & 2033
- Table 6: Global Premium Bakery Products Volume K Tons Forecast, by Region 2020 & 2033
- Table 7: Global Premium Bakery Products Revenue billion Forecast, by Product Type 2020 & 2033
- Table 8: Global Premium Bakery Products Volume K Tons Forecast, by Product Type 2020 & 2033
- Table 9: Global Premium Bakery Products Revenue billion Forecast, by Distibution Channel 2020 & 2033
- Table 10: Global Premium Bakery Products Volume K Tons Forecast, by Distibution Channel 2020 & 2033
- Table 11: Global Premium Bakery Products Revenue billion Forecast, by Country 2020 & 2033
- Table 12: Global Premium Bakery Products Volume K Tons Forecast, by Country 2020 & 2033
- Table 13: United States Premium Bakery Products Revenue (billion) Forecast, by Application 2020 & 2033
- Table 14: United States Premium Bakery Products Volume (K Tons) Forecast, by Application 2020 & 2033
- Table 15: Canada Premium Bakery Products Revenue (billion) Forecast, by Application 2020 & 2033
- Table 16: Canada Premium Bakery Products Volume (K Tons) Forecast, by Application 2020 & 2033
- Table 17: Mexico Premium Bakery Products Revenue (billion) Forecast, by Application 2020 & 2033
- Table 18: Mexico Premium Bakery Products Volume (K Tons) Forecast, by Application 2020 & 2033
- Table 19: Rest of North America Premium Bakery Products Revenue (billion) Forecast, by Application 2020 & 2033
- Table 20: Rest of North America Premium Bakery Products Volume (K Tons) Forecast, by Application 2020 & 2033
- Table 21: Global Premium Bakery Products Revenue billion Forecast, by Product Type 2020 & 2033
- Table 22: Global Premium Bakery Products Volume K Tons Forecast, by Product Type 2020 & 2033
- Table 23: Global Premium Bakery Products Revenue billion Forecast, by Distibution Channel 2020 & 2033
- Table 24: Global Premium Bakery Products Volume K Tons Forecast, by Distibution Channel 2020 & 2033
- Table 25: Global Premium Bakery Products Revenue billion Forecast, by Country 2020 & 2033
- Table 26: Global Premium Bakery Products Volume K Tons Forecast, by Country 2020 & 2033
- Table 27: United Kingdom Premium Bakery Products Revenue (billion) Forecast, by Application 2020 & 2033
- Table 28: United Kingdom Premium Bakery Products Volume (K Tons) Forecast, by Application 2020 & 2033
- Table 29: Germany Premium Bakery Products Revenue (billion) Forecast, by Application 2020 & 2033
- Table 30: Germany Premium Bakery Products Volume (K Tons) Forecast, by Application 2020 & 2033
- Table 31: Spain Premium Bakery Products Revenue (billion) Forecast, by Application 2020 & 2033
- Table 32: Spain Premium Bakery Products Volume (K Tons) Forecast, by Application 2020 & 2033
- Table 33: France Premium Bakery Products Revenue (billion) Forecast, by Application 2020 & 2033
- Table 34: France Premium Bakery Products Volume (K Tons) Forecast, by Application 2020 & 2033
- Table 35: Italy Premium Bakery Products Revenue (billion) Forecast, by Application 2020 & 2033
- Table 36: Italy Premium Bakery Products Volume (K Tons) Forecast, by Application 2020 & 2033
- Table 37: Russia Premium Bakery Products Revenue (billion) Forecast, by Application 2020 & 2033
- Table 38: Russia Premium Bakery Products Volume (K Tons) Forecast, by Application 2020 & 2033
- Table 39: Rest of Europe Premium Bakery Products Revenue (billion) Forecast, by Application 2020 & 2033
- Table 40: Rest of Europe Premium Bakery Products Volume (K Tons) Forecast, by Application 2020 & 2033
- Table 41: Global Premium Bakery Products Revenue billion Forecast, by Product Type 2020 & 2033
- Table 42: Global Premium Bakery Products Volume K Tons Forecast, by Product Type 2020 & 2033
- Table 43: Global Premium Bakery Products Revenue billion Forecast, by Distibution Channel 2020 & 2033
- Table 44: Global Premium Bakery Products Volume K Tons Forecast, by Distibution Channel 2020 & 2033
- Table 45: Global Premium Bakery Products Revenue billion Forecast, by Country 2020 & 2033
- Table 46: Global Premium Bakery Products Volume K Tons Forecast, by Country 2020 & 2033
- Table 47: China Premium Bakery Products Revenue (billion) Forecast, by Application 2020 & 2033
- Table 48: China Premium Bakery Products Volume (K Tons) Forecast, by Application 2020 & 2033
- Table 49: Japan Premium Bakery Products Revenue (billion) Forecast, by Application 2020 & 2033
- Table 50: Japan Premium Bakery Products Volume (K Tons) Forecast, by Application 2020 & 2033
- Table 51: India Premium Bakery Products Revenue (billion) Forecast, by Application 2020 & 2033
- Table 52: India Premium Bakery Products Volume (K Tons) Forecast, by Application 2020 & 2033
- Table 53: Australia Premium Bakery Products Revenue (billion) Forecast, by Application 2020 & 2033
- Table 54: Australia Premium Bakery Products Volume (K Tons) Forecast, by Application 2020 & 2033
- Table 55: Rest of Asia Pacific Premium Bakery Products Revenue (billion) Forecast, by Application 2020 & 2033
- Table 56: Rest of Asia Pacific Premium Bakery Products Volume (K Tons) Forecast, by Application 2020 & 2033
- Table 57: Global Premium Bakery Products Revenue billion Forecast, by Product Type 2020 & 2033
- Table 58: Global Premium Bakery Products Volume K Tons Forecast, by Product Type 2020 & 2033
- Table 59: Global Premium Bakery Products Revenue billion Forecast, by Distibution Channel 2020 & 2033
- Table 60: Global Premium Bakery Products Volume K Tons Forecast, by Distibution Channel 2020 & 2033
- Table 61: Global Premium Bakery Products Revenue billion Forecast, by Country 2020 & 2033
- Table 62: Global Premium Bakery Products Volume K Tons Forecast, by Country 2020 & 2033
- Table 63: Brazil Premium Bakery Products Revenue (billion) Forecast, by Application 2020 & 2033
- Table 64: Brazil Premium Bakery Products Volume (K Tons) Forecast, by Application 2020 & 2033
- Table 65: Argentina Premium Bakery Products Revenue (billion) Forecast, by Application 2020 & 2033
- Table 66: Argentina Premium Bakery Products Volume (K Tons) Forecast, by Application 2020 & 2033
- Table 67: Rest of South America Premium Bakery Products Revenue (billion) Forecast, by Application 2020 & 2033
- Table 68: Rest of South America Premium Bakery Products Volume (K Tons) Forecast, by Application 2020 & 2033
- Table 69: Global Premium Bakery Products Revenue billion Forecast, by Product Type 2020 & 2033
- Table 70: Global Premium Bakery Products Volume K Tons Forecast, by Product Type 2020 & 2033
- Table 71: Global Premium Bakery Products Revenue billion Forecast, by Distibution Channel 2020 & 2033
- Table 72: Global Premium Bakery Products Volume K Tons Forecast, by Distibution Channel 2020 & 2033
- Table 73: Global Premium Bakery Products Revenue billion Forecast, by Country 2020 & 2033
- Table 74: Global Premium Bakery Products Volume K Tons Forecast, by Country 2020 & 2033
- Table 75: Global Premium Bakery Products Revenue billion Forecast, by Product Type 2020 & 2033
- Table 76: Global Premium Bakery Products Volume K Tons Forecast, by Product Type 2020 & 2033
- Table 77: Global Premium Bakery Products Revenue billion Forecast, by Distibution Channel 2020 & 2033
- Table 78: Global Premium Bakery Products Volume K Tons Forecast, by Distibution Channel 2020 & 2033
- Table 79: Global Premium Bakery Products Revenue billion Forecast, by Country 2020 & 2033
- Table 80: Global Premium Bakery Products Volume K Tons Forecast, by Country 2020 & 2033
- Table 81: South Africa Premium Bakery Products Revenue (billion) Forecast, by Application 2020 & 2033
- Table 82: South Africa Premium Bakery Products Volume (K Tons) Forecast, by Application 2020 & 2033
- Table 83: Rest of Middle East Premium Bakery Products Revenue (billion) Forecast, by Application 2020 & 2033
- Table 84: Rest of Middle East Premium Bakery Products Volume (K Tons) Forecast, by Application 2020 & 2033
Frequently Asked Questions
1. What is the projected Compound Annual Growth Rate (CAGR) of the Premium Bakery Products?
The projected CAGR is approximately 4.78%.
2. Which companies are prominent players in the Premium Bakery Products?
Key companies in the market include BARILLA G E R FRATELLI SPA, General Mills Inc, Finsbury Food Group Plc, ALMARAI COMPANY, FUJI BAKING CO LTD, Associated British Foods plc, Mondelez International Inc, Bimbo Bakeries USA, Bakers Delight Holdings Limited, Britannia Industries Ltd*List Not Exhaustive.
3. What are the main segments of the Premium Bakery Products?
The market segments include Product Type, Distibution Channel.
4. Can you provide details about the market size?
The market size is estimated to be USD 494.7 billion as of 2022.
5. What are some drivers contributing to market growth?
Innovation in Vanillin Synthesis; Diverse Functionality of Vanillin In End-use Industries.
6. What are the notable trends driving market growth?
Rising demand for premium healthy snacking options is driving the market.
7. Are there any restraints impacting market growth?
Supply Chain Variability Impacting Vanilla Bean Availability For Flavor Production.
8. Can you provide examples of recent developments in the market?
In April 2022, Walker's Shortbread is partnering with retailer Dufry for the launch of a new Global Travel Retailer range into more than 55 travel sites worldwide including France. The product range will include several types of shortbreads and other products in it.
9. What pricing options are available for accessing the report?
Pricing options include single-user, multi-user, and enterprise licenses priced at USD 4750, USD 5250, and USD 8750 respectively.
10. Is the market size provided in terms of value or volume?
The market size is provided in terms of value, measured in billion and volume, measured in K Tons.
11. Are there any specific market keywords associated with the report?
Yes, the market keyword associated with the report is "Premium Bakery Products," which aids in identifying and referencing the specific market segment covered.
12. How do I determine which pricing option suits my needs best?
The pricing options vary based on user requirements and access needs. Individual users may opt for single-user licenses, while businesses requiring broader access may choose multi-user or enterprise licenses for cost-effective access to the report.
13. Are there any additional resources or data provided in the Premium Bakery Products report?
While the report offers comprehensive insights, it's advisable to review the specific contents or supplementary materials provided to ascertain if additional resources or data are available.
14. How can I stay updated on further developments or reports in the Premium Bakery Products?
To stay informed about further developments, trends, and reports in the Premium Bakery Products, consider subscribing to industry newsletters, following relevant companies and organizations, or regularly checking reputable industry news sources and publications.
Methodology
Step 1 - Identification of Relevant Samples Size from Population Database


Step 2 - Approaches for Defining Global Market Size (Value, Volume* & Price*)

Note*: In applicable scenarios
Step 3 - Data Sources
Primary Research
- Web Analytics
- Survey Reports
- Research Institute
- Latest Research Reports
- Opinion Leaders
Secondary Research
- Annual Reports
- White Paper
- Latest Press Release
- Industry Association
- Paid Database
- Investor Presentations

Step 4 - Data Triangulation
Involves using different sources of information in order to increase the validity of a study
These sources are likely to be stakeholders in a program - participants, other researchers, program staff, other community members, and so on.
Then we put all data in single framework & apply various statistical tools to find out the dynamic on the market.
During the analysis stage, feedback from the stakeholder groups would be compared to determine areas of agreement as well as areas of divergence