

Key Insights
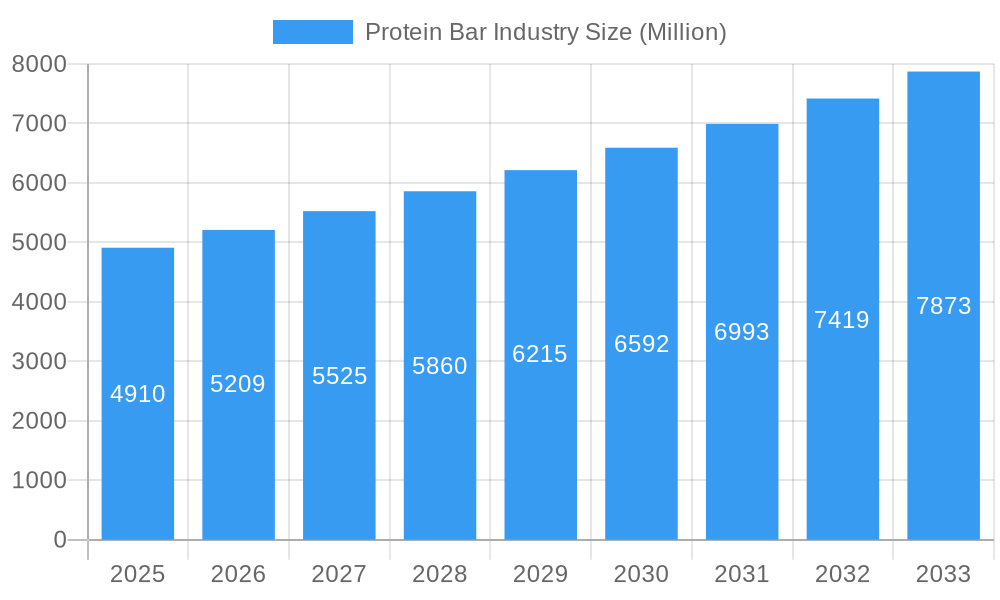
The global protein bar market is experiencing robust expansion, projected to reach an estimated \$4,910 million in 2025. This growth is fueled by a confluence of evolving consumer lifestyles, heightened health consciousness, and a surging demand for convenient and nutritious on-the-go snacking options. The increasing prevalence of fitness culture, coupled with a growing awareness of the benefits of protein for muscle repair, satiety, and overall well-being, has positioned protein bars as a staple in many diets, from professional athletes to everyday health-conscious individuals. This demand is further amplified by the wider availability of protein bars across diverse distribution channels, including convenience stores, online retail, and supermarkets, catering to the modern consumer's need for accessibility and variety. Key market drivers include the rising disposable incomes in emerging economies, leading to increased purchasing power for health and wellness products, and the continuous innovation in product formulations, flavors, and ingredients, offering a wider appeal to a broader consumer base.
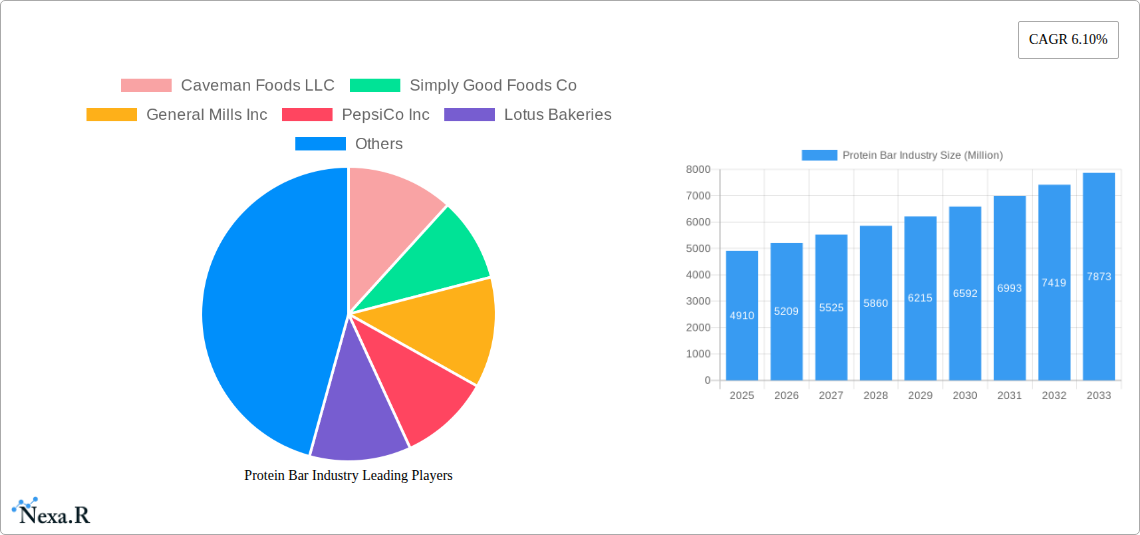
Protein Bar Industry Market Size (In Billion)
The market is characterized by significant growth potential, with a projected Compound Annual Growth Rate (CAGR) of 6.10% anticipated over the forecast period from 2025 to 2033. This sustained growth trajectory suggests a highly dynamic and competitive landscape. Key trends include the emphasis on clean-label ingredients, catering to consumers seeking products with natural, recognizable components, and the rise of plant-based and vegan protein bar options, aligning with the growing global shift towards sustainable and ethical food choices. Additionally, manufacturers are increasingly focusing on functional protein bars, incorporating ingredients like probiotics, adaptogens, and collagen to offer targeted health benefits beyond basic protein supplementation. While the market presents numerous opportunities, certain restraints, such as the potential for high sugar content in some products and intense competition leading to price pressures, necessitate strategic product development and marketing approaches from leading companies like PepsiCo Inc., General Mills Inc., and Simply Good Foods Co. to maintain and grow their market share.
Protein Bar Industry Company Market Share
Report Title: Protein Bar Industry Analysis: Growth, Trends, and Opportunities (2019-2033)
Report Description:
Gain a comprehensive understanding of the dynamic global protein bar market with this in-depth industry report. Covering the period from 2019 to 2033, with a base and estimated year of 2025, this analysis delves into the intricate protein bar industry structure, growth trends, and future market outlook. Discover the key drivers, emerging opportunities, and challenges shaping this multi-billion dollar sector. We provide granular insights into regional dominance, product innovations, and the strategic moves of key players like Caveman Foods LLC, Simply Good Foods Co, General Mills Inc., PepsiCo Inc., Lotus Bakeries, GNC Holdings LLC, Naturell India Pvt Ltd, Mars Incorporated, Fitshit Health Solutions Pvt Ltd, The Hershey Company, Associated British Foods PLC, Stayfit Enterprize Private Limited, Glanbia Plc, and Kellogg Company. This report is essential for nutrition bar manufacturers, health and wellness brands, food ingredient suppliers, market research firms, and investors seeking to capitalize on the burgeoning demand for convenient, protein-rich snacks. Explore market segmentation by distribution channels, including convenience stores, online retail stores, and supermarkets/hypermarkets, and understand the evolving consumer behavior and adoption rates driving market penetration.
Protein Bar Industry Market Dynamics & Structure
The global protein bar market exhibits a moderately concentrated structure, with a blend of large multinational corporations and specialized niche players. Technological innovation is a significant driver, focusing on improving taste profiles, enhancing nutritional content (e.g., plant-based protein sources, added vitamins/minerals), and developing convenient, on-the-go formats. Regulatory frameworks, primarily concerning food safety, labeling accuracy, and health claims, are crucial for market entry and sustained operations. Competitive product substitutes, including other protein-enhanced snacks, traditional confectionery, and meal replacement shakes, pose a constant challenge, necessitating continuous product differentiation. End-user demographics are increasingly diverse, spanning athletes, fitness enthusiasts, health-conscious individuals, and those seeking convenient meal solutions. Mergers and acquisitions (M&A) trends reflect a strategic consolidation, with larger companies acquiring smaller innovative brands to expand their portfolios and market reach.
- Market Concentration: Dominated by a few key players but with significant room for specialized brands.
- Technological Innovation Drivers: Taste enhancement, novel protein sources, and functional ingredients.
- Regulatory Frameworks: Strict adherence to food safety and clear labeling standards.
- Competitive Product Substitutes: A wide array of snack and meal replacement options.
- End-User Demographics: Broad appeal across fitness, health, and convenience-seeking consumers.
- M&A Trends: Strategic acquisitions for portfolio expansion and market penetration.
Protein Bar Industry Growth Trends & Insights
The protein bar industry is poised for robust growth, driven by an escalating global consciousness towards health and wellness. The market size has witnessed a steady evolution, projected to reach significant valuation figures by 2033. Adoption rates are accelerating as protein bars transition from niche fitness products to mainstream snack options. Consumers are increasingly seeking convenient solutions to supplement their protein intake, fueled by busy lifestyles and a greater understanding of the role of protein in muscle repair, satiety, and overall health. Technological disruptions are continuously shaping the landscape, with innovations in protein sourcing (e.g., insect protein, algae-based protein) and formulation leading to bars with superior taste, texture, and nutritional profiles. Consumer behavior shifts are evident, with a growing preference for clean labels, reduced sugar content, and plant-based alternatives. The CAGR of the market is expected to remain strong throughout the forecast period, indicating sustained expansion. Market penetration is deepening across various demographics, moving beyond hardcore athletes to encompass everyday consumers looking for healthier snack choices. The market is anticipated to be valued in the tens of millions by 2025, with substantial growth projected over the coming decade.
Dominant Regions, Countries, or Segments in Protein Bar Industry
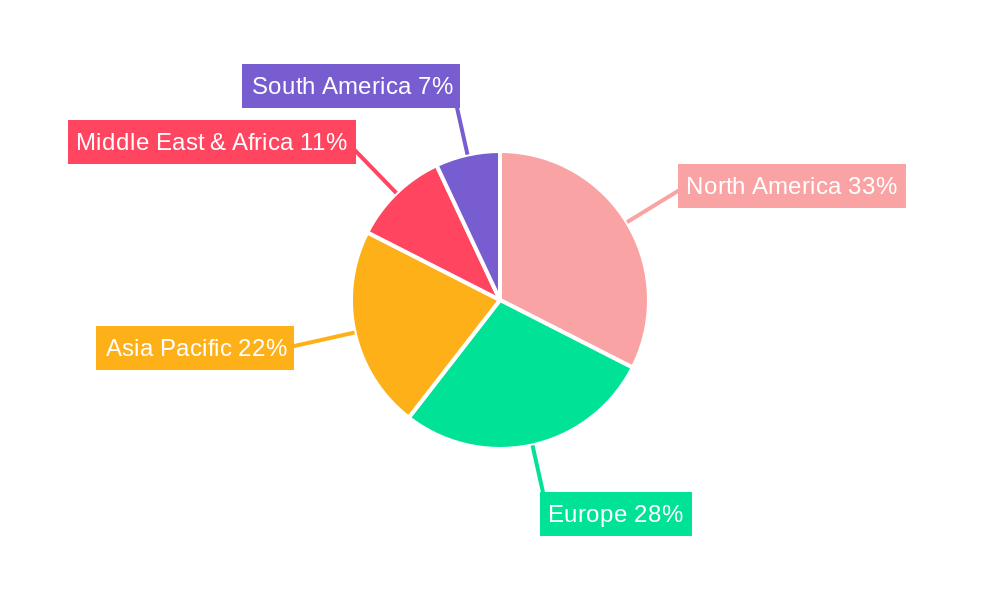
North America currently stands as a dominant region in the global protein bar market, driven by a well-established health and wellness culture and high disposable incomes. The United States, in particular, is a key contributor, characterized by a mature consumer base that readily embraces functional foods and dietary supplements. The Online Retail Store segment is witnessing exponential growth within the protein bar industry, significantly contributing to market expansion. This channel offers unparalleled convenience, a vast product selection, and competitive pricing, appealing to a broad spectrum of consumers from urban dwellers to those in remote areas. E-commerce platforms have become crucial for brand visibility and accessibility, enabling smaller brands to compete with established giants.
- North America's Dominance: Driven by strong health consciousness and consumer spending power.
- United States as a Key Market: High adoption rates and demand for innovative products.
- Online Retail Store Segment's Ascendancy:
- Convenience: 24/7 accessibility and home delivery.
- Product Variety: Access to a wider range of brands and specialized products.
- Price Competitiveness: Online retailers often offer better deals and discounts.
- Direct-to-Consumer (DTC) Opportunities: Brands can directly engage with consumers, fostering loyalty and gathering valuable data.
- Influencer Marketing: Online platforms facilitate effective influencer collaborations to drive awareness and sales.
- Global Reach: E-commerce allows manufacturers to tap into international markets more readily.
The widespread availability of broadband internet and smartphones further bolsters the growth of online retail for protein bars. This trend is expected to continue, with online channels potentially surpassing traditional retail in terms of market share for certain product categories within the protein bar industry.
Protein Bar Industry Product Landscape
The protein bar product landscape is characterized by rapid innovation, driven by evolving consumer demands and scientific advancements. Key product innovations include the integration of diverse protein sources such as whey, casein, soy, pea, rice, and even novel options like cricket protein. Applications are expanding beyond athletic recovery to encompass weight management, meal replacement, and general healthy snacking. Performance metrics are increasingly focused on macronutrient profiles, with an emphasis on high protein content (often 20 grams or more), low sugar (typically under 5 grams), and the inclusion of fiber and beneficial fats. Unique selling propositions often revolve around "clean label" formulations, allergen-free options, and appealing flavor profiles that mimic indulgence while delivering functional benefits. Technological advancements in processing and formulation allow for improved texture, shelf stability, and bioavailability of nutrients, enhancing the overall consumer experience and driving repeat purchases in the competitive nutrition bar market.
Key Drivers, Barriers & Challenges in Protein Bar Industry
Key Drivers:
- Growing Health and Wellness Consciousness: Consumers are actively seeking healthier food options to support active lifestyles and overall well-being.
- Demand for Convenient Nutrition: Busy lifestyles drive the need for portable, protein-rich snacks that can be consumed on-the-go.
- Rising Popularity of Fitness and Sports: Increased participation in physical activities fuels the demand for sports nutrition products like protein bars.
- Innovations in Product Formulation and Taste: Continuous development of appealing flavors and textures, along with the use of diverse protein sources, attracts a wider consumer base.
- Increasing Availability and Accessibility: Wider distribution channels, including online retail and mainstream supermarkets, make protein bars more accessible.
Barriers & Challenges:
- Intense Competition: A crowded market with numerous brands and private labels can make differentiation difficult.
- Perception of "Processed Food": Some consumers remain skeptical about the healthiness of processed snacks, including protein bars.
- Price Sensitivity: Premium ingredients and specialized formulations can lead to higher retail prices, impacting affordability for some segments.
- Supply Chain Volatility: Sourcing of key ingredients, especially plant-based proteins, can be subject to fluctuations in availability and cost.
- Regulatory Scrutiny: Evolving regulations regarding health claims and ingredient labeling require ongoing compliance and adaptation.
- Taste and Texture Challenges: Achieving a balance between nutritional goals and palatable taste/texture can be a persistent hurdle for manufacturers.
Emerging Opportunities in Protein Bar Industry
Emerging opportunities in the protein bar industry lie in catering to specific dietary needs and preferences. The demand for plant-based and vegan protein bars is rapidly growing, presenting a significant untapped market for manufacturers to innovate with diverse vegetable and legume-based protein sources. Furthermore, functional protein bars incorporating adaptogens, probiotics, or specific vitamins and minerals for targeted benefits (e.g., sleep support, stress reduction) represent a growing niche. The development of sustainable packaging solutions and ethically sourced ingredients is also becoming a key differentiator, appealing to environmentally conscious consumers. Exploring international markets with burgeoning health consciousness, particularly in emerging economies, offers substantial growth potential.
Growth Accelerators in the Protein Bar Industry Industry
Several catalysts are accelerating the long-term growth of the protein bar industry. Technological breakthroughs in protein extraction and processing are enabling the creation of more palatable and nutrient-dense bars. Strategic partnerships between ingredient suppliers and bar manufacturers are fostering innovation and cost efficiencies. Market expansion strategies, including targeting new demographic segments like busy professionals and seniors, are broadening the consumer base. The increasing integration of protein bars into broader wellness ecosystems, such as fitness apps and corporate wellness programs, is further driving adoption. Continued investment in research and development for novel protein sources and functional ingredients will undoubtedly sustain and amplify market expansion.
Key Players Shaping the Protein Bar Industry Market
- Caveman Foods LLC
- Simply Good Foods Co
- General Mills Inc.
- PepsiCo Inc.
- Lotus Bakeries
- GNC Holdings LLC
- Naturell India Pvt Ltd
- Mars Incorporated
- Fitshit Health Solutions Pvt Ltd
- The Hershey Company
- Associated British Foods PLC
- Stayfit Enterprize Private Limited
- Glanbia Plc
- Kellogg Company
Notable Milestones in Protein Bar Industry Sector
- May 2023: General Mills Inc. announced the expansion of its Nature Valley brand with the introduction of Nature Valley Savory Nut Crunch Bars.
- April 2023: The Hershey Company, under the brand ONE Brands, launched the limited-edition Peanut Butter & Jelly Flavored Protein Bar, featuring 20 grams of protein and 1 gram of sugar.
- January 2023: The Hershey Company introduced caffeinated protein bars in two flavors: vanilla latte and caramel macchiato, catering to consumers seeking an energy boost.
In-Depth Protein Bar Industry Market Outlook
The protein bar industry is on an upward trajectory, fueled by sustained consumer demand for convenient, health-oriented food options. Future market potential is immense, driven by ongoing product innovation in areas like plant-based alternatives and functional ingredients. Strategic opportunities abound for companies that can effectively address evolving consumer preferences for clean labels, sustainable practices, and personalized nutrition. Expansion into underserved geographical markets and the development of targeted product lines for specific lifestyles and dietary needs will be critical for capturing market share. The industry's ability to adapt to regulatory changes and overcome supply chain challenges will further solidify its growth trajectory.
Protein Bar Industry Segmentation
-
1. Distribution Channel
- 1.1. Convenience Store
- 1.2. Online Retail Store
- 1.3. Supermarket/Hypermarket
- 1.4. Others
Protein Bar Industry Segmentation By Geography
-
1. North America
- 1.1. United States
- 1.2. Canada
- 1.3. Mexico
-
2. South America
- 2.1. Brazil
- 2.2. Argentina
- 2.3. Rest of South America
-
3. Europe
- 3.1. United Kingdom
- 3.2. Germany
- 3.3. France
- 3.4. Italy
- 3.5. Spain
- 3.6. Russia
- 3.7. Benelux
- 3.8. Nordics
- 3.9. Rest of Europe
-
4. Middle East & Africa
- 4.1. Turkey
- 4.2. Israel
- 4.3. GCC
- 4.4. North Africa
- 4.5. South Africa
- 4.6. Rest of Middle East & Africa
-
5. Asia Pacific
- 5.1. China
- 5.2. India
- 5.3. Japan
- 5.4. South Korea
- 5.5. ASEAN
- 5.6. Oceania
- 5.7. Rest of Asia Pacific
Protein Bar Industry Regional Market Share
Geographic Coverage of Protein Bar Industry
Protein Bar Industry REPORT HIGHLIGHTS
| Aspects | Details |
|---|---|
| Study Period | 2020-2034 |
| Base Year | 2025 |
| Estimated Year | 2026 |
| Forecast Period | 2026-2034 |
| Historical Period | 2020-2025 |
| Growth Rate | CAGR of 6.10% from 2020-2034 |
| Segmentation |
|
Table of Contents
- 1. Introduction
- 1.1. Research Scope
- 1.2. Market Segmentation
- 1.3. Research Methodology
- 1.4. Definitions and Assumptions
- 2. Executive Summary
- 2.1. Introduction
- 3. Market Dynamics
- 3.1. Introduction
- 3.2. Market Drivers
- 3.2.1. Increasing Demand for Low-Fat and Fat-Free Food Products; Expanding Cosmetic and Personal Care Industries Utilize Gelatin for Various Purposes
- 3.3. Market Restrains
- 3.3.1. Fluctuations in Raw Material Proces Affecting Production Costs
- 3.4. Market Trends
- 3.4.1. OTHER KEY INDUSTRY TRENDS COVERED IN THE REPORT
- 4. Market Factor Analysis
- 4.1. Porters Five Forces
- 4.2. Supply/Value Chain
- 4.3. PESTEL analysis
- 4.4. Market Entropy
- 4.5. Patent/Trademark Analysis
- 5. Global Protein Bar Industry Analysis, Insights and Forecast, 2020-2032
- 5.1. Market Analysis, Insights and Forecast - by Distribution Channel
- 5.1.1. Convenience Store
- 5.1.2. Online Retail Store
- 5.1.3. Supermarket/Hypermarket
- 5.1.4. Others
- 5.2. Market Analysis, Insights and Forecast - by Region
- 5.2.1. North America
- 5.2.2. South America
- 5.2.3. Europe
- 5.2.4. Middle East & Africa
- 5.2.5. Asia Pacific
- 5.1. Market Analysis, Insights and Forecast - by Distribution Channel
- 6. North America Protein Bar Industry Analysis, Insights and Forecast, 2020-2032
- 6.1. Market Analysis, Insights and Forecast - by Distribution Channel
- 6.1.1. Convenience Store
- 6.1.2. Online Retail Store
- 6.1.3. Supermarket/Hypermarket
- 6.1.4. Others
- 6.1. Market Analysis, Insights and Forecast - by Distribution Channel
- 7. South America Protein Bar Industry Analysis, Insights and Forecast, 2020-2032
- 7.1. Market Analysis, Insights and Forecast - by Distribution Channel
- 7.1.1. Convenience Store
- 7.1.2. Online Retail Store
- 7.1.3. Supermarket/Hypermarket
- 7.1.4. Others
- 7.1. Market Analysis, Insights and Forecast - by Distribution Channel
- 8. Europe Protein Bar Industry Analysis, Insights and Forecast, 2020-2032
- 8.1. Market Analysis, Insights and Forecast - by Distribution Channel
- 8.1.1. Convenience Store
- 8.1.2. Online Retail Store
- 8.1.3. Supermarket/Hypermarket
- 8.1.4. Others
- 8.1. Market Analysis, Insights and Forecast - by Distribution Channel
- 9. Middle East & Africa Protein Bar Industry Analysis, Insights and Forecast, 2020-2032
- 9.1. Market Analysis, Insights and Forecast - by Distribution Channel
- 9.1.1. Convenience Store
- 9.1.2. Online Retail Store
- 9.1.3. Supermarket/Hypermarket
- 9.1.4. Others
- 9.1. Market Analysis, Insights and Forecast - by Distribution Channel
- 10. Asia Pacific Protein Bar Industry Analysis, Insights and Forecast, 2020-2032
- 10.1. Market Analysis, Insights and Forecast - by Distribution Channel
- 10.1.1. Convenience Store
- 10.1.2. Online Retail Store
- 10.1.3. Supermarket/Hypermarket
- 10.1.4. Others
- 10.1. Market Analysis, Insights and Forecast - by Distribution Channel
- 11. Competitive Analysis
- 11.1. Global Market Share Analysis 2025
- 11.2. Company Profiles
- 11.2.1 Caveman Foods LLC
- 11.2.1.1. Overview
- 11.2.1.2. Products
- 11.2.1.3. SWOT Analysis
- 11.2.1.4. Recent Developments
- 11.2.1.5. Financials (Based on Availability)
- 11.2.2 Simply Good Foods Co
- 11.2.2.1. Overview
- 11.2.2.2. Products
- 11.2.2.3. SWOT Analysis
- 11.2.2.4. Recent Developments
- 11.2.2.5. Financials (Based on Availability)
- 11.2.3 General Mills Inc
- 11.2.3.1. Overview
- 11.2.3.2. Products
- 11.2.3.3. SWOT Analysis
- 11.2.3.4. Recent Developments
- 11.2.3.5. Financials (Based on Availability)
- 11.2.4 PepsiCo Inc
- 11.2.4.1. Overview
- 11.2.4.2. Products
- 11.2.4.3. SWOT Analysis
- 11.2.4.4. Recent Developments
- 11.2.4.5. Financials (Based on Availability)
- 11.2.5 Lotus Bakeries
- 11.2.5.1. Overview
- 11.2.5.2. Products
- 11.2.5.3. SWOT Analysis
- 11.2.5.4. Recent Developments
- 11.2.5.5. Financials (Based on Availability)
- 11.2.6 GNC Holdings LLC
- 11.2.6.1. Overview
- 11.2.6.2. Products
- 11.2.6.3. SWOT Analysis
- 11.2.6.4. Recent Developments
- 11.2.6.5. Financials (Based on Availability)
- 11.2.7 Naturell India Pvt Ltd
- 11.2.7.1. Overview
- 11.2.7.2. Products
- 11.2.7.3. SWOT Analysis
- 11.2.7.4. Recent Developments
- 11.2.7.5. Financials (Based on Availability)
- 11.2.8 Mars Incorporated
- 11.2.8.1. Overview
- 11.2.8.2. Products
- 11.2.8.3. SWOT Analysis
- 11.2.8.4. Recent Developments
- 11.2.8.5. Financials (Based on Availability)
- 11.2.9 Fitshit Health Solutions Pvt Ltd
- 11.2.9.1. Overview
- 11.2.9.2. Products
- 11.2.9.3. SWOT Analysis
- 11.2.9.4. Recent Developments
- 11.2.9.5. Financials (Based on Availability)
- 11.2.10 The Hershey Compan
- 11.2.10.1. Overview
- 11.2.10.2. Products
- 11.2.10.3. SWOT Analysis
- 11.2.10.4. Recent Developments
- 11.2.10.5. Financials (Based on Availability)
- 11.2.11 Associated British Foods PLC
- 11.2.11.1. Overview
- 11.2.11.2. Products
- 11.2.11.3. SWOT Analysis
- 11.2.11.4. Recent Developments
- 11.2.11.5. Financials (Based on Availability)
- 11.2.12 Stayfit Enterprize Private Limited
- 11.2.12.1. Overview
- 11.2.12.2. Products
- 11.2.12.3. SWOT Analysis
- 11.2.12.4. Recent Developments
- 11.2.12.5. Financials (Based on Availability)
- 11.2.13 Glanbia Plc
- 11.2.13.1. Overview
- 11.2.13.2. Products
- 11.2.13.3. SWOT Analysis
- 11.2.13.4. Recent Developments
- 11.2.13.5. Financials (Based on Availability)
- 11.2.14 Kellogg Company
- 11.2.14.1. Overview
- 11.2.14.2. Products
- 11.2.14.3. SWOT Analysis
- 11.2.14.4. Recent Developments
- 11.2.14.5. Financials (Based on Availability)
- 11.2.1 Caveman Foods LLC
List of Figures
- Figure 1: Global Protein Bar Industry Revenue Breakdown (Million, %) by Region 2025 & 2033
- Figure 2: Global Protein Bar Industry Volume Breakdown (K Tons, %) by Region 2025 & 2033
- Figure 3: North America Protein Bar Industry Revenue (Million), by Distribution Channel 2025 & 2033
- Figure 4: North America Protein Bar Industry Volume (K Tons), by Distribution Channel 2025 & 2033
- Figure 5: North America Protein Bar Industry Revenue Share (%), by Distribution Channel 2025 & 2033
- Figure 6: North America Protein Bar Industry Volume Share (%), by Distribution Channel 2025 & 2033
- Figure 7: North America Protein Bar Industry Revenue (Million), by Country 2025 & 2033
- Figure 8: North America Protein Bar Industry Volume (K Tons), by Country 2025 & 2033
- Figure 9: North America Protein Bar Industry Revenue Share (%), by Country 2025 & 2033
- Figure 10: North America Protein Bar Industry Volume Share (%), by Country 2025 & 2033
- Figure 11: South America Protein Bar Industry Revenue (Million), by Distribution Channel 2025 & 2033
- Figure 12: South America Protein Bar Industry Volume (K Tons), by Distribution Channel 2025 & 2033
- Figure 13: South America Protein Bar Industry Revenue Share (%), by Distribution Channel 2025 & 2033
- Figure 14: South America Protein Bar Industry Volume Share (%), by Distribution Channel 2025 & 2033
- Figure 15: South America Protein Bar Industry Revenue (Million), by Country 2025 & 2033
- Figure 16: South America Protein Bar Industry Volume (K Tons), by Country 2025 & 2033
- Figure 17: South America Protein Bar Industry Revenue Share (%), by Country 2025 & 2033
- Figure 18: South America Protein Bar Industry Volume Share (%), by Country 2025 & 2033
- Figure 19: Europe Protein Bar Industry Revenue (Million), by Distribution Channel 2025 & 2033
- Figure 20: Europe Protein Bar Industry Volume (K Tons), by Distribution Channel 2025 & 2033
- Figure 21: Europe Protein Bar Industry Revenue Share (%), by Distribution Channel 2025 & 2033
- Figure 22: Europe Protein Bar Industry Volume Share (%), by Distribution Channel 2025 & 2033
- Figure 23: Europe Protein Bar Industry Revenue (Million), by Country 2025 & 2033
- Figure 24: Europe Protein Bar Industry Volume (K Tons), by Country 2025 & 2033
- Figure 25: Europe Protein Bar Industry Revenue Share (%), by Country 2025 & 2033
- Figure 26: Europe Protein Bar Industry Volume Share (%), by Country 2025 & 2033
- Figure 27: Middle East & Africa Protein Bar Industry Revenue (Million), by Distribution Channel 2025 & 2033
- Figure 28: Middle East & Africa Protein Bar Industry Volume (K Tons), by Distribution Channel 2025 & 2033
- Figure 29: Middle East & Africa Protein Bar Industry Revenue Share (%), by Distribution Channel 2025 & 2033
- Figure 30: Middle East & Africa Protein Bar Industry Volume Share (%), by Distribution Channel 2025 & 2033
- Figure 31: Middle East & Africa Protein Bar Industry Revenue (Million), by Country 2025 & 2033
- Figure 32: Middle East & Africa Protein Bar Industry Volume (K Tons), by Country 2025 & 2033
- Figure 33: Middle East & Africa Protein Bar Industry Revenue Share (%), by Country 2025 & 2033
- Figure 34: Middle East & Africa Protein Bar Industry Volume Share (%), by Country 2025 & 2033
- Figure 35: Asia Pacific Protein Bar Industry Revenue (Million), by Distribution Channel 2025 & 2033
- Figure 36: Asia Pacific Protein Bar Industry Volume (K Tons), by Distribution Channel 2025 & 2033
- Figure 37: Asia Pacific Protein Bar Industry Revenue Share (%), by Distribution Channel 2025 & 2033
- Figure 38: Asia Pacific Protein Bar Industry Volume Share (%), by Distribution Channel 2025 & 2033
- Figure 39: Asia Pacific Protein Bar Industry Revenue (Million), by Country 2025 & 2033
- Figure 40: Asia Pacific Protein Bar Industry Volume (K Tons), by Country 2025 & 2033
- Figure 41: Asia Pacific Protein Bar Industry Revenue Share (%), by Country 2025 & 2033
- Figure 42: Asia Pacific Protein Bar Industry Volume Share (%), by Country 2025 & 2033
List of Tables
- Table 1: Global Protein Bar Industry Revenue Million Forecast, by Distribution Channel 2020 & 2033
- Table 2: Global Protein Bar Industry Volume K Tons Forecast, by Distribution Channel 2020 & 2033
- Table 3: Global Protein Bar Industry Revenue Million Forecast, by Region 2020 & 2033
- Table 4: Global Protein Bar Industry Volume K Tons Forecast, by Region 2020 & 2033
- Table 5: Global Protein Bar Industry Revenue Million Forecast, by Distribution Channel 2020 & 2033
- Table 6: Global Protein Bar Industry Volume K Tons Forecast, by Distribution Channel 2020 & 2033
- Table 7: Global Protein Bar Industry Revenue Million Forecast, by Country 2020 & 2033
- Table 8: Global Protein Bar Industry Volume K Tons Forecast, by Country 2020 & 2033
- Table 9: United States Protein Bar Industry Revenue (Million) Forecast, by Application 2020 & 2033
- Table 10: United States Protein Bar Industry Volume (K Tons) Forecast, by Application 2020 & 2033
- Table 11: Canada Protein Bar Industry Revenue (Million) Forecast, by Application 2020 & 2033
- Table 12: Canada Protein Bar Industry Volume (K Tons) Forecast, by Application 2020 & 2033
- Table 13: Mexico Protein Bar Industry Revenue (Million) Forecast, by Application 2020 & 2033
- Table 14: Mexico Protein Bar Industry Volume (K Tons) Forecast, by Application 2020 & 2033
- Table 15: Global Protein Bar Industry Revenue Million Forecast, by Distribution Channel 2020 & 2033
- Table 16: Global Protein Bar Industry Volume K Tons Forecast, by Distribution Channel 2020 & 2033
- Table 17: Global Protein Bar Industry Revenue Million Forecast, by Country 2020 & 2033
- Table 18: Global Protein Bar Industry Volume K Tons Forecast, by Country 2020 & 2033
- Table 19: Brazil Protein Bar Industry Revenue (Million) Forecast, by Application 2020 & 2033
- Table 20: Brazil Protein Bar Industry Volume (K Tons) Forecast, by Application 2020 & 2033
- Table 21: Argentina Protein Bar Industry Revenue (Million) Forecast, by Application 2020 & 2033
- Table 22: Argentina Protein Bar Industry Volume (K Tons) Forecast, by Application 2020 & 2033
- Table 23: Rest of South America Protein Bar Industry Revenue (Million) Forecast, by Application 2020 & 2033
- Table 24: Rest of South America Protein Bar Industry Volume (K Tons) Forecast, by Application 2020 & 2033
- Table 25: Global Protein Bar Industry Revenue Million Forecast, by Distribution Channel 2020 & 2033
- Table 26: Global Protein Bar Industry Volume K Tons Forecast, by Distribution Channel 2020 & 2033
- Table 27: Global Protein Bar Industry Revenue Million Forecast, by Country 2020 & 2033
- Table 28: Global Protein Bar Industry Volume K Tons Forecast, by Country 2020 & 2033
- Table 29: United Kingdom Protein Bar Industry Revenue (Million) Forecast, by Application 2020 & 2033
- Table 30: United Kingdom Protein Bar Industry Volume (K Tons) Forecast, by Application 2020 & 2033
- Table 31: Germany Protein Bar Industry Revenue (Million) Forecast, by Application 2020 & 2033
- Table 32: Germany Protein Bar Industry Volume (K Tons) Forecast, by Application 2020 & 2033
- Table 33: France Protein Bar Industry Revenue (Million) Forecast, by Application 2020 & 2033
- Table 34: France Protein Bar Industry Volume (K Tons) Forecast, by Application 2020 & 2033
- Table 35: Italy Protein Bar Industry Revenue (Million) Forecast, by Application 2020 & 2033
- Table 36: Italy Protein Bar Industry Volume (K Tons) Forecast, by Application 2020 & 2033
- Table 37: Spain Protein Bar Industry Revenue (Million) Forecast, by Application 2020 & 2033
- Table 38: Spain Protein Bar Industry Volume (K Tons) Forecast, by Application 2020 & 2033
- Table 39: Russia Protein Bar Industry Revenue (Million) Forecast, by Application 2020 & 2033
- Table 40: Russia Protein Bar Industry Volume (K Tons) Forecast, by Application 2020 & 2033
- Table 41: Benelux Protein Bar Industry Revenue (Million) Forecast, by Application 2020 & 2033
- Table 42: Benelux Protein Bar Industry Volume (K Tons) Forecast, by Application 2020 & 2033
- Table 43: Nordics Protein Bar Industry Revenue (Million) Forecast, by Application 2020 & 2033
- Table 44: Nordics Protein Bar Industry Volume (K Tons) Forecast, by Application 2020 & 2033
- Table 45: Rest of Europe Protein Bar Industry Revenue (Million) Forecast, by Application 2020 & 2033
- Table 46: Rest of Europe Protein Bar Industry Volume (K Tons) Forecast, by Application 2020 & 2033
- Table 47: Global Protein Bar Industry Revenue Million Forecast, by Distribution Channel 2020 & 2033
- Table 48: Global Protein Bar Industry Volume K Tons Forecast, by Distribution Channel 2020 & 2033
- Table 49: Global Protein Bar Industry Revenue Million Forecast, by Country 2020 & 2033
- Table 50: Global Protein Bar Industry Volume K Tons Forecast, by Country 2020 & 2033
- Table 51: Turkey Protein Bar Industry Revenue (Million) Forecast, by Application 2020 & 2033
- Table 52: Turkey Protein Bar Industry Volume (K Tons) Forecast, by Application 2020 & 2033
- Table 53: Israel Protein Bar Industry Revenue (Million) Forecast, by Application 2020 & 2033
- Table 54: Israel Protein Bar Industry Volume (K Tons) Forecast, by Application 2020 & 2033
- Table 55: GCC Protein Bar Industry Revenue (Million) Forecast, by Application 2020 & 2033
- Table 56: GCC Protein Bar Industry Volume (K Tons) Forecast, by Application 2020 & 2033
- Table 57: North Africa Protein Bar Industry Revenue (Million) Forecast, by Application 2020 & 2033
- Table 58: North Africa Protein Bar Industry Volume (K Tons) Forecast, by Application 2020 & 2033
- Table 59: South Africa Protein Bar Industry Revenue (Million) Forecast, by Application 2020 & 2033
- Table 60: South Africa Protein Bar Industry Volume (K Tons) Forecast, by Application 2020 & 2033
- Table 61: Rest of Middle East & Africa Protein Bar Industry Revenue (Million) Forecast, by Application 2020 & 2033
- Table 62: Rest of Middle East & Africa Protein Bar Industry Volume (K Tons) Forecast, by Application 2020 & 2033
- Table 63: Global Protein Bar Industry Revenue Million Forecast, by Distribution Channel 2020 & 2033
- Table 64: Global Protein Bar Industry Volume K Tons Forecast, by Distribution Channel 2020 & 2033
- Table 65: Global Protein Bar Industry Revenue Million Forecast, by Country 2020 & 2033
- Table 66: Global Protein Bar Industry Volume K Tons Forecast, by Country 2020 & 2033
- Table 67: China Protein Bar Industry Revenue (Million) Forecast, by Application 2020 & 2033
- Table 68: China Protein Bar Industry Volume (K Tons) Forecast, by Application 2020 & 2033
- Table 69: India Protein Bar Industry Revenue (Million) Forecast, by Application 2020 & 2033
- Table 70: India Protein Bar Industry Volume (K Tons) Forecast, by Application 2020 & 2033
- Table 71: Japan Protein Bar Industry Revenue (Million) Forecast, by Application 2020 & 2033
- Table 72: Japan Protein Bar Industry Volume (K Tons) Forecast, by Application 2020 & 2033
- Table 73: South Korea Protein Bar Industry Revenue (Million) Forecast, by Application 2020 & 2033
- Table 74: South Korea Protein Bar Industry Volume (K Tons) Forecast, by Application 2020 & 2033
- Table 75: ASEAN Protein Bar Industry Revenue (Million) Forecast, by Application 2020 & 2033
- Table 76: ASEAN Protein Bar Industry Volume (K Tons) Forecast, by Application 2020 & 2033
- Table 77: Oceania Protein Bar Industry Revenue (Million) Forecast, by Application 2020 & 2033
- Table 78: Oceania Protein Bar Industry Volume (K Tons) Forecast, by Application 2020 & 2033
- Table 79: Rest of Asia Pacific Protein Bar Industry Revenue (Million) Forecast, by Application 2020 & 2033
- Table 80: Rest of Asia Pacific Protein Bar Industry Volume (K Tons) Forecast, by Application 2020 & 2033
Frequently Asked Questions
1. What is the projected Compound Annual Growth Rate (CAGR) of the Protein Bar Industry?
The projected CAGR is approximately 6.10%.
2. Which companies are prominent players in the Protein Bar Industry?
Key companies in the market include Caveman Foods LLC, Simply Good Foods Co, General Mills Inc, PepsiCo Inc, Lotus Bakeries, GNC Holdings LLC, Naturell India Pvt Ltd, Mars Incorporated, Fitshit Health Solutions Pvt Ltd, The Hershey Compan, Associated British Foods PLC, Stayfit Enterprize Private Limited, Glanbia Plc, Kellogg Company.
3. What are the main segments of the Protein Bar Industry?
The market segments include Distribution Channel.
4. Can you provide details about the market size?
The market size is estimated to be USD 4910 Million as of 2022.
5. What are some drivers contributing to market growth?
Increasing Demand for Low-Fat and Fat-Free Food Products; Expanding Cosmetic and Personal Care Industries Utilize Gelatin for Various Purposes.
6. What are the notable trends driving market growth?
OTHER KEY INDUSTRY TRENDS COVERED IN THE REPORT.
7. Are there any restraints impacting market growth?
Fluctuations in Raw Material Proces Affecting Production Costs.
8. Can you provide examples of recent developments in the market?
May 2023: General Mills Inc. announced that it would be expanding its Nature Valley brand with the introduction of Nature Valley Savory Nut Crunch Bars.April 2023: Under the brand ONE Brands, The Hershey Company launched the Peanut Butter & Jelly Flavored Protein Bar. The ONE Limited Edition Peanut Butter & Jelly flavored bars are packed with 20 grams of protein, 1 gram of sugar, and the taste of peanut butter and strawberry jelly flavors.January 2023: The Hershey Company launched caffeinated protein bars. The range is available in two flavors: vanilla latte and caramel macchiato.
9. What pricing options are available for accessing the report?
Pricing options include single-user, multi-user, and enterprise licenses priced at USD 3800, USD 4500, and USD 5800 respectively.
10. Is the market size provided in terms of value or volume?
The market size is provided in terms of value, measured in Million and volume, measured in K Tons.
11. Are there any specific market keywords associated with the report?
Yes, the market keyword associated with the report is "Protein Bar Industry," which aids in identifying and referencing the specific market segment covered.
12. How do I determine which pricing option suits my needs best?
The pricing options vary based on user requirements and access needs. Individual users may opt for single-user licenses, while businesses requiring broader access may choose multi-user or enterprise licenses for cost-effective access to the report.
13. Are there any additional resources or data provided in the Protein Bar Industry report?
While the report offers comprehensive insights, it's advisable to review the specific contents or supplementary materials provided to ascertain if additional resources or data are available.
14. How can I stay updated on further developments or reports in the Protein Bar Industry?
To stay informed about further developments, trends, and reports in the Protein Bar Industry, consider subscribing to industry newsletters, following relevant companies and organizations, or regularly checking reputable industry news sources and publications.
Methodology
Step 1 - Identification of Relevant Samples Size from Population Database


Step 2 - Approaches for Defining Global Market Size (Value, Volume* & Price*)

Note*: In applicable scenarios
Step 3 - Data Sources
Primary Research
- Web Analytics
- Survey Reports
- Research Institute
- Latest Research Reports
- Opinion Leaders
Secondary Research
- Annual Reports
- White Paper
- Latest Press Release
- Industry Association
- Paid Database
- Investor Presentations

Step 4 - Data Triangulation
Involves using different sources of information in order to increase the validity of a study
These sources are likely to be stakeholders in a program - participants, other researchers, program staff, other community members, and so on.
Then we put all data in single framework & apply various statistical tools to find out the dynamic on the market.
During the analysis stage, feedback from the stakeholder groups would be compared to determine areas of agreement as well as areas of divergence