

Key Insights
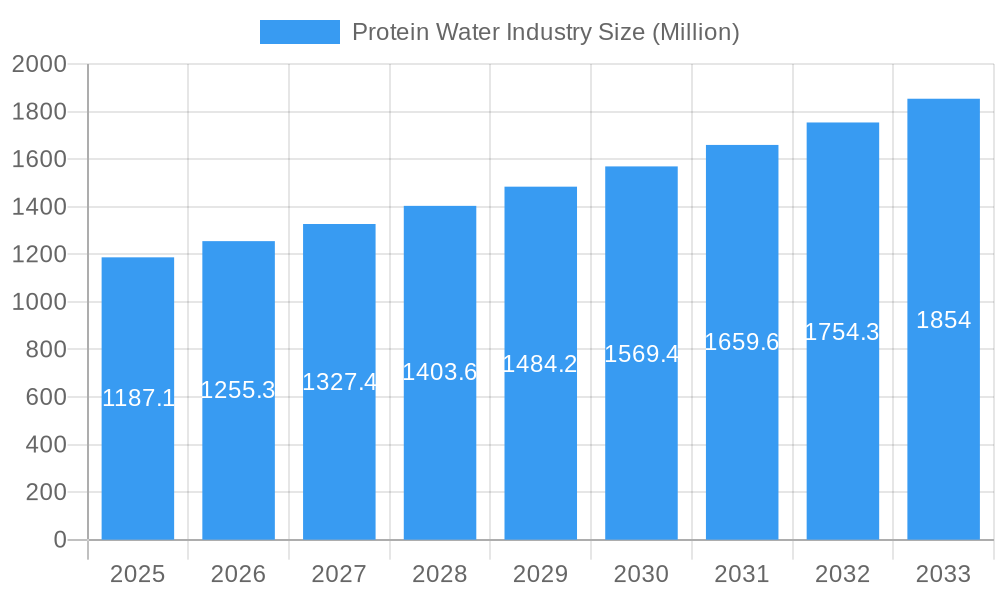
The global protein water market, valued at $1187.1 million in 2025, is projected to experience robust growth, driven by increasing health consciousness and the rising popularity of convenient, on-the-go nutrition solutions. The market's Compound Annual Growth Rate (CAGR) of 5.50% from 2025 to 2033 indicates a substantial expansion, fueled by several key factors. The growing demand for functional beverages offering both hydration and protein intake is a primary driver. Consumers, particularly those engaged in fitness and athletic activities, are increasingly seeking healthier alternatives to traditional sugary drinks. Furthermore, the diversification of product offerings, including flavored and unflavored options catering to diverse preferences, contributes to market expansion. The expanding distribution network, encompassing supermarkets, convenience stores, and online channels, ensures wider accessibility and enhances market penetration. The presence of established players like Arla Foods and Glanbia PLC, alongside emerging brands, fosters competition and innovation within the market, further stimulating growth.
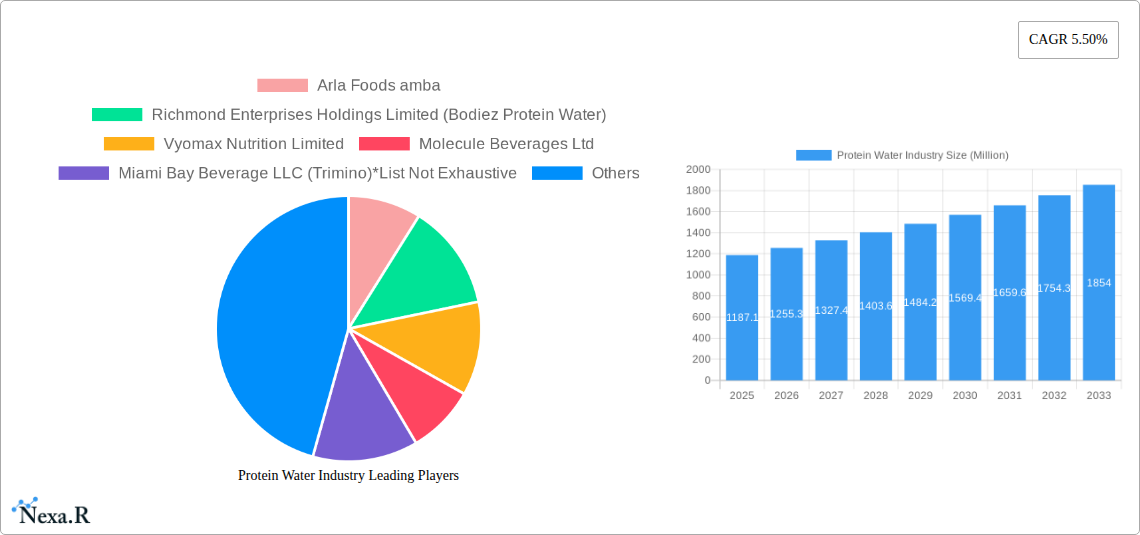
Protein Water Industry Market Size (In Billion)
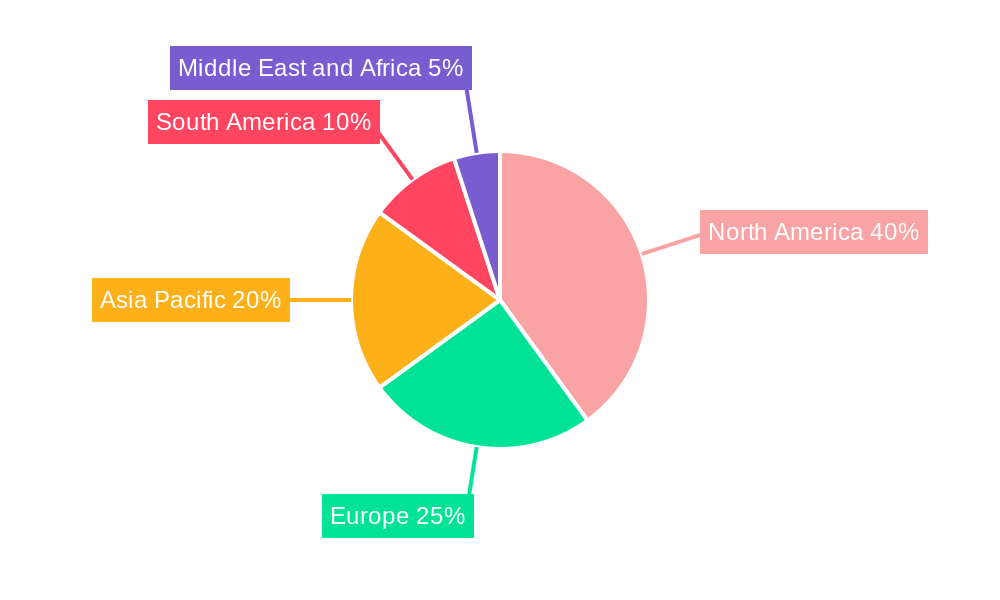
Significant regional variations exist within the protein water market. North America, with its strong health and wellness culture, is anticipated to hold a substantial market share. However, emerging markets in Asia Pacific and South America are also demonstrating significant growth potential, driven by rising disposable incomes and increasing awareness of health and fitness. The convenience store channel is expected to be a significant growth driver, particularly in densely populated areas and among younger consumers. While challenges such as ingredient sourcing and maintaining product quality might act as restraints, the overall market outlook remains positive, with continuous innovation and expansion expected in the coming years. The increasing focus on sustainable packaging practices will also influence consumer choices and shape the market dynamics.
Protein Water Industry Company Market Share
Protein Water Industry Market Report: 2019-2033
This comprehensive report provides an in-depth analysis of the global protein water market, encompassing market dynamics, growth trends, regional performance, product landscape, and key players. The study period covers 2019-2033, with 2025 serving as the base and estimated year. The forecast period extends from 2025 to 2033, while the historical period analyzed is 2019-2024. This report is essential for industry professionals, investors, and strategists seeking to understand and capitalize on the opportunities within this rapidly evolving market. The parent market is the beverage industry and the child market is the functional beverage segment.
Protein Water Industry Market Dynamics & Structure
This section analyzes the competitive landscape, technological advancements, regulatory environment, and market trends within the protein water industry. The market is characterized by a moderately fragmented structure, with several key players competing alongside smaller niche brands. Market concentration is expected to increase slightly by 2033 as larger companies continue mergers and acquisitions.
- Market Concentration: xx% (2025), projected to reach xx% by 2033.
- Technological Innovation: Focus on enhanced protein delivery systems, natural flavoring, and sustainable packaging. Innovation barriers include cost of R&D and consumer acceptance of new technologies.
- Regulatory Frameworks: Vary by region, impacting ingredient labeling, health claims, and product safety standards. These regulations influence product development and market access.
- Competitive Product Substitutes: Traditional protein shakes, energy drinks, and other functional beverages pose competition.
- End-User Demographics: Primarily health-conscious individuals, athletes, and fitness enthusiasts. Expanding into broader consumer segments is a key growth driver.
- M&A Trends: Increasing M&A activity as large players seek to consolidate market share and expand product portfolios. xx M&A deals were recorded between 2019 and 2024.
Protein Water Industry Growth Trends & Insights
The global protein water market is experiencing robust growth, driven by increasing health consciousness and demand for convenient protein sources. Market size evolution showcases significant expansion from xx Million units in 2019 to xx Million units in 2024, with a projected CAGR of xx% during 2025-2033. Technological disruptions, such as improved protein solubility and stability, are enhancing product appeal. Consumer behavior shifts show increased preference for healthier, on-the-go options, driving the popularity of protein water. Market penetration is expected to grow from xx% in 2024 to xx% by 2033, reflecting the increasing acceptance of protein water across various demographic segments.
Dominant Regions, Countries, or Segments in Protein Water Industry
North America currently dominates the protein water market, followed by Europe. The key drivers include high disposable income, health consciousness, and well-established distribution channels. Within the product segments, flavored protein water currently holds a significant market share, due to consumer preference for variety and taste. Supermarkets/Hypermarkets are the dominant distribution channel.
- North America: High market share driven by strong consumer demand and established distribution networks.
- Europe: Significant growth potential fueled by increasing health awareness and adoption of functional beverages.
- Asia-Pacific: Emerging market with considerable growth potential, driven by rising disposable incomes and increasing fitness culture.
- Flavored Protein Water: Dominates the market due to higher consumer appeal.
- Supermarkets/Hypermarkets: Major distribution channel due to broad reach and established infrastructure.
Protein Water Industry Product Landscape
Protein water products are characterized by varying protein sources (whey, casein, soy, pea), flavor profiles, and added ingredients (vitamins, minerals, electrolytes). Innovation focuses on improving taste, texture, and protein bioavailability, as well as exploring sustainable packaging solutions. Unique selling propositions include convenience, low sugar content, and ease of consumption. Technological advancements concentrate on enhancing protein stability and solubility.
Key Drivers, Barriers & Challenges in Protein Water Industry
Key Drivers:
- Growing health and fitness awareness.
- Increasing demand for convenient protein sources.
- Technological advancements improving product quality.
Key Challenges:
- Intense competition from established beverage brands.
- Price sensitivity among consumers.
- Maintaining protein stability and taste over shelf life. (This results in approximately xx% product loss annually due to spoilage).
Emerging Opportunities in Protein Water Industry
- Expansion into untapped markets in developing economies.
- Development of innovative flavors and product formulations to cater to diverse consumer preferences.
- Strategic partnerships with fitness brands and influencers to enhance brand visibility.
Growth Accelerators in the Protein Water Industry
Strategic collaborations between beverage companies and protein supplement manufacturers will drive innovation and enhance market penetration. Expansion into new geographical markets, particularly in Asia and Latin America, offers significant growth opportunities. Technological advancements, like improving protein solubility, and eco-friendly packaging options will be key drivers for the industry's growth trajectory.
Key Players Shaping the Protein Water Industry Market
- Arla Foods amba
- Richmond Enterprises Holdings Limited (Bodiez Protein Water)
- Vyomax Nutrition Limited
- Molecule Beverages Ltd
- Miami Bay Beverage LLC (Trimino)
- Aquatein
- Fizzique LLC
- Protein2o Inc
- Agropur Inc (BiPro USA)
- Glanbia PLC (Optimum Nutrition Inc)
Notable Milestones in Protein Water Industry Sector
- August 2021: Vita Coco launches PWR LIFT, a zero-sugar protein-infused water line.
- April 2022: Vieve expands its portfolio with a new range of vegan protein waters.
- July 2022: Aquatein, India's first protein water brand, launches three new products and expands distribution.
In-Depth Protein Water Industry Market Outlook
The protein water market is poised for continued robust growth, driven by a confluence of factors including escalating health consciousness, rising disposable incomes in emerging markets, and ongoing innovation within the product category. Strategic partnerships, new product development, and effective marketing campaigns will be crucial for companies aiming to gain a strong foothold in this dynamic market. The future potential rests in expanding into novel flavor profiles, developing sustainable packaging solutions, and tapping into the expanding health and wellness consumer base across the globe.
Protein Water Industry Segmentation
-
1. Type
- 1.1. Flavored
- 1.2. Unflavored
-
2. Distribution Channel
- 2.1. Supermarkets/Hypermarkets
- 2.2. Convenience Stores
- 2.3. Online Channels
- 2.4. Others
Protein Water Industry Segmentation By Geography
-
1. North America
- 1.1. United States
- 1.2. Canada
- 1.3. Mexico
- 1.4. Rest of North America
-
2. Europe
- 2.1. Spain
- 2.2. United Kingdom
- 2.3. Germany
- 2.4. France
- 2.5. Italy
- 2.6. Russia
- 2.7. Rest of Europe
-
3. Asia Pacific
- 3.1. China
- 3.2. Japan
- 3.3. India
- 3.4. Australia
- 3.5. Rest of Asia Pacific
-
4. South America
- 4.1. Brazil
- 4.2. Argentina
- 4.3. Rest of South America
-
5. Middle East and Africa
- 5.1. South Africa
- 5.2. Saudi Arabia
- 5.3. Rest of Middle East and Africa
Protein Water Industry Regional Market Share
Geographic Coverage of Protein Water Industry
Protein Water Industry REPORT HIGHLIGHTS
| Aspects | Details |
|---|---|
| Study Period | 2020-2034 |
| Base Year | 2025 |
| Estimated Year | 2026 |
| Forecast Period | 2026-2034 |
| Historical Period | 2020-2025 |
| Growth Rate | CAGR of 5.50% from 2020-2034 |
| Segmentation |
|
Table of Contents
- 1. Introduction
- 1.1. Research Scope
- 1.2. Market Segmentation
- 1.3. Research Objective
- 1.4. Definitions and Assumptions
- 2. Executive Summary
- 2.1. Market Snapshot
- 3. Market Dynamics
- 3.1. Market Drivers
- 3.2. Market Restrains
- 3.3. Market Trends
- 3.4. Market Opportunities
- 4. Market Factor Analysis
- 4.1. Porters Five Forces
- 4.1.1. Bargaining Power of Suppliers
- 4.1.2. Bargaining Power of Buyers
- 4.1.3. Threat of New Entrants
- 4.1.4. Threat of Substitutes
- 4.1.5. Competitive Rivalry
- 4.2. PESTEL analysis
- 4.3. BCG Analysis
- 4.3.1. Stars (High Growth, High Market Share)
- 4.3.2. Cash Cows (Low Growth, High Market Share)
- 4.3.3. Question Mark (High Growth, Low Market Share)
- 4.3.4. Dogs (Low Growth, Low Market Share)
- 4.4. Ansoff Matrix Analysis
- 4.5. Supply Chain Analysis
- 4.6. Regulatory Landscape
- 4.7. Current Market Potential and Opportunity Assessment (TAM–SAM–SOM Framework)
- 4.8. NRP Analyst Note
- 4.1. Porters Five Forces
- 5. Market Analysis, Insights and Forecast 2021-2033
- 5.1. Market Analysis, Insights and Forecast - by Type
- 5.1.1. Flavored
- 5.1.2. Unflavored
- 5.2. Market Analysis, Insights and Forecast - by Distribution Channel
- 5.2.1. Supermarkets/Hypermarkets
- 5.2.2. Convenience Stores
- 5.2.3. Online Channels
- 5.2.4. Others
- 5.3. Market Analysis, Insights and Forecast - by Region
- 5.3.1. North America
- 5.3.2. Europe
- 5.3.3. Asia Pacific
- 5.3.4. South America
- 5.3.5. Middle East and Africa
- 5.1. Market Analysis, Insights and Forecast - by Type
- 6. Global Protein Water Industry Analysis, Insights and Forecast, 2021-2033
- 6.1. Market Analysis, Insights and Forecast - by Type
- 6.1.1. Flavored
- 6.1.2. Unflavored
- 6.2. Market Analysis, Insights and Forecast - by Distribution Channel
- 6.2.1. Supermarkets/Hypermarkets
- 6.2.2. Convenience Stores
- 6.2.3. Online Channels
- 6.2.4. Others
- 6.1. Market Analysis, Insights and Forecast - by Type
- 7. North America Protein Water Industry Analysis, Insights and Forecast, 2020-2032
- 7.1. Market Analysis, Insights and Forecast - by Type
- 7.1.1. Flavored
- 7.1.2. Unflavored
- 7.2. Market Analysis, Insights and Forecast - by Distribution Channel
- 7.2.1. Supermarkets/Hypermarkets
- 7.2.2. Convenience Stores
- 7.2.3. Online Channels
- 7.2.4. Others
- 7.1. Market Analysis, Insights and Forecast - by Type
- 8. Europe Protein Water Industry Analysis, Insights and Forecast, 2020-2032
- 8.1. Market Analysis, Insights and Forecast - by Type
- 8.1.1. Flavored
- 8.1.2. Unflavored
- 8.2. Market Analysis, Insights and Forecast - by Distribution Channel
- 8.2.1. Supermarkets/Hypermarkets
- 8.2.2. Convenience Stores
- 8.2.3. Online Channels
- 8.2.4. Others
- 8.1. Market Analysis, Insights and Forecast - by Type
- 9. Asia Pacific Protein Water Industry Analysis, Insights and Forecast, 2020-2032
- 9.1. Market Analysis, Insights and Forecast - by Type
- 9.1.1. Flavored
- 9.1.2. Unflavored
- 9.2. Market Analysis, Insights and Forecast - by Distribution Channel
- 9.2.1. Supermarkets/Hypermarkets
- 9.2.2. Convenience Stores
- 9.2.3. Online Channels
- 9.2.4. Others
- 9.1. Market Analysis, Insights and Forecast - by Type
- 10. South America Protein Water Industry Analysis, Insights and Forecast, 2020-2032
- 10.1. Market Analysis, Insights and Forecast - by Type
- 10.1.1. Flavored
- 10.1.2. Unflavored
- 10.2. Market Analysis, Insights and Forecast - by Distribution Channel
- 10.2.1. Supermarkets/Hypermarkets
- 10.2.2. Convenience Stores
- 10.2.3. Online Channels
- 10.2.4. Others
- 10.1. Market Analysis, Insights and Forecast - by Type
- 11. Middle East and Africa Protein Water Industry Analysis, Insights and Forecast, 2020-2032
- 11.1. Market Analysis, Insights and Forecast - by Type
- 11.1.1. Flavored
- 11.1.2. Unflavored
- 11.2. Market Analysis, Insights and Forecast - by Distribution Channel
- 11.2.1. Supermarkets/Hypermarkets
- 11.2.2. Convenience Stores
- 11.2.3. Online Channels
- 11.2.4. Others
- 11.1. Market Analysis, Insights and Forecast - by Type
- 12. Competitive Analysis
- 12.1. Company Profiles
- 12.1.1 Arla Foods amba
- 12.1.1.1. Company Overview
- 12.1.1.2. Products
- 12.1.1.3. Company Financials
- 12.1.1.4. SWOT Analysis
- 12.1.2 Richmond Enterprises Holdings Limited (Bodiez Protein Water)
- 12.1.2.1. Company Overview
- 12.1.2.2. Products
- 12.1.2.3. Company Financials
- 12.1.2.4. SWOT Analysis
- 12.1.3 Vyomax Nutrition Limited
- 12.1.3.1. Company Overview
- 12.1.3.2. Products
- 12.1.3.3. Company Financials
- 12.1.3.4. SWOT Analysis
- 12.1.4 Molecule Beverages Ltd
- 12.1.4.1. Company Overview
- 12.1.4.2. Products
- 12.1.4.3. Company Financials
- 12.1.4.4. SWOT Analysis
- 12.1.5 Miami Bay Beverage LLC (Trimino)*List Not Exhaustive
- 12.1.5.1. Company Overview
- 12.1.5.2. Products
- 12.1.5.3. Company Financials
- 12.1.5.4. SWOT Analysis
- 12.1.6 Aquatein
- 12.1.6.1. Company Overview
- 12.1.6.2. Products
- 12.1.6.3. Company Financials
- 12.1.6.4. SWOT Analysis
- 12.1.7 Fizzique LLC
- 12.1.7.1. Company Overview
- 12.1.7.2. Products
- 12.1.7.3. Company Financials
- 12.1.7.4. SWOT Analysis
- 12.1.8 Protein2o Inc
- 12.1.8.1. Company Overview
- 12.1.8.2. Products
- 12.1.8.3. Company Financials
- 12.1.8.4. SWOT Analysis
- 12.1.9 Agropur Inc (BiPro USA)
- 12.1.9.1. Company Overview
- 12.1.9.2. Products
- 12.1.9.3. Company Financials
- 12.1.9.4. SWOT Analysis
- 12.1.10 Glanbia PLC (Optimum Nutrition Inc )
- 12.1.10.1. Company Overview
- 12.1.10.2. Products
- 12.1.10.3. Company Financials
- 12.1.10.4. SWOT Analysis
- 12.1.1 Arla Foods amba
- 12.2. Market Entropy
- 12.2.1 Company's Key Areas Served
- 12.2.2 Recent Developments
- 12.3. Company Market Share Analysis 2025
- 12.3.1 Top 5 Companies Market Share Analysis
- 12.3.2 Top 3 Companies Market Share Analysis
- 12.4. List of Potential Customers
- 13. Research Methodology
List of Figures
- Figure 1: Global Protein Water Industry Revenue Breakdown (Million, %) by Region 2025 & 2033
- Figure 2: Global Protein Water Industry Volume Breakdown (liter , %) by Region 2025 & 2033
- Figure 3: North America Protein Water Industry Revenue (Million), by Type 2025 & 2033
- Figure 4: North America Protein Water Industry Volume (liter ), by Type 2025 & 2033
- Figure 5: North America Protein Water Industry Revenue Share (%), by Type 2025 & 2033
- Figure 6: North America Protein Water Industry Volume Share (%), by Type 2025 & 2033
- Figure 7: North America Protein Water Industry Revenue (Million), by Distribution Channel 2025 & 2033
- Figure 8: North America Protein Water Industry Volume (liter ), by Distribution Channel 2025 & 2033
- Figure 9: North America Protein Water Industry Revenue Share (%), by Distribution Channel 2025 & 2033
- Figure 10: North America Protein Water Industry Volume Share (%), by Distribution Channel 2025 & 2033
- Figure 11: North America Protein Water Industry Revenue (Million), by Country 2025 & 2033
- Figure 12: North America Protein Water Industry Volume (liter ), by Country 2025 & 2033
- Figure 13: North America Protein Water Industry Revenue Share (%), by Country 2025 & 2033
- Figure 14: North America Protein Water Industry Volume Share (%), by Country 2025 & 2033
- Figure 15: Europe Protein Water Industry Revenue (Million), by Type 2025 & 2033
- Figure 16: Europe Protein Water Industry Volume (liter ), by Type 2025 & 2033
- Figure 17: Europe Protein Water Industry Revenue Share (%), by Type 2025 & 2033
- Figure 18: Europe Protein Water Industry Volume Share (%), by Type 2025 & 2033
- Figure 19: Europe Protein Water Industry Revenue (Million), by Distribution Channel 2025 & 2033
- Figure 20: Europe Protein Water Industry Volume (liter ), by Distribution Channel 2025 & 2033
- Figure 21: Europe Protein Water Industry Revenue Share (%), by Distribution Channel 2025 & 2033
- Figure 22: Europe Protein Water Industry Volume Share (%), by Distribution Channel 2025 & 2033
- Figure 23: Europe Protein Water Industry Revenue (Million), by Country 2025 & 2033
- Figure 24: Europe Protein Water Industry Volume (liter ), by Country 2025 & 2033
- Figure 25: Europe Protein Water Industry Revenue Share (%), by Country 2025 & 2033
- Figure 26: Europe Protein Water Industry Volume Share (%), by Country 2025 & 2033
- Figure 27: Asia Pacific Protein Water Industry Revenue (Million), by Type 2025 & 2033
- Figure 28: Asia Pacific Protein Water Industry Volume (liter ), by Type 2025 & 2033
- Figure 29: Asia Pacific Protein Water Industry Revenue Share (%), by Type 2025 & 2033
- Figure 30: Asia Pacific Protein Water Industry Volume Share (%), by Type 2025 & 2033
- Figure 31: Asia Pacific Protein Water Industry Revenue (Million), by Distribution Channel 2025 & 2033
- Figure 32: Asia Pacific Protein Water Industry Volume (liter ), by Distribution Channel 2025 & 2033
- Figure 33: Asia Pacific Protein Water Industry Revenue Share (%), by Distribution Channel 2025 & 2033
- Figure 34: Asia Pacific Protein Water Industry Volume Share (%), by Distribution Channel 2025 & 2033
- Figure 35: Asia Pacific Protein Water Industry Revenue (Million), by Country 2025 & 2033
- Figure 36: Asia Pacific Protein Water Industry Volume (liter ), by Country 2025 & 2033
- Figure 37: Asia Pacific Protein Water Industry Revenue Share (%), by Country 2025 & 2033
- Figure 38: Asia Pacific Protein Water Industry Volume Share (%), by Country 2025 & 2033
- Figure 39: South America Protein Water Industry Revenue (Million), by Type 2025 & 2033
- Figure 40: South America Protein Water Industry Volume (liter ), by Type 2025 & 2033
- Figure 41: South America Protein Water Industry Revenue Share (%), by Type 2025 & 2033
- Figure 42: South America Protein Water Industry Volume Share (%), by Type 2025 & 2033
- Figure 43: South America Protein Water Industry Revenue (Million), by Distribution Channel 2025 & 2033
- Figure 44: South America Protein Water Industry Volume (liter ), by Distribution Channel 2025 & 2033
- Figure 45: South America Protein Water Industry Revenue Share (%), by Distribution Channel 2025 & 2033
- Figure 46: South America Protein Water Industry Volume Share (%), by Distribution Channel 2025 & 2033
- Figure 47: South America Protein Water Industry Revenue (Million), by Country 2025 & 2033
- Figure 48: South America Protein Water Industry Volume (liter ), by Country 2025 & 2033
- Figure 49: South America Protein Water Industry Revenue Share (%), by Country 2025 & 2033
- Figure 50: South America Protein Water Industry Volume Share (%), by Country 2025 & 2033
- Figure 51: Middle East and Africa Protein Water Industry Revenue (Million), by Type 2025 & 2033
- Figure 52: Middle East and Africa Protein Water Industry Volume (liter ), by Type 2025 & 2033
- Figure 53: Middle East and Africa Protein Water Industry Revenue Share (%), by Type 2025 & 2033
- Figure 54: Middle East and Africa Protein Water Industry Volume Share (%), by Type 2025 & 2033
- Figure 55: Middle East and Africa Protein Water Industry Revenue (Million), by Distribution Channel 2025 & 2033
- Figure 56: Middle East and Africa Protein Water Industry Volume (liter ), by Distribution Channel 2025 & 2033
- Figure 57: Middle East and Africa Protein Water Industry Revenue Share (%), by Distribution Channel 2025 & 2033
- Figure 58: Middle East and Africa Protein Water Industry Volume Share (%), by Distribution Channel 2025 & 2033
- Figure 59: Middle East and Africa Protein Water Industry Revenue (Million), by Country 2025 & 2033
- Figure 60: Middle East and Africa Protein Water Industry Volume (liter ), by Country 2025 & 2033
- Figure 61: Middle East and Africa Protein Water Industry Revenue Share (%), by Country 2025 & 2033
- Figure 62: Middle East and Africa Protein Water Industry Volume Share (%), by Country 2025 & 2033
List of Tables
- Table 1: Global Protein Water Industry Revenue Million Forecast, by Type 2020 & 2033
- Table 2: Global Protein Water Industry Volume liter Forecast, by Type 2020 & 2033
- Table 3: Global Protein Water Industry Revenue Million Forecast, by Distribution Channel 2020 & 2033
- Table 4: Global Protein Water Industry Volume liter Forecast, by Distribution Channel 2020 & 2033
- Table 5: Global Protein Water Industry Revenue Million Forecast, by Region 2020 & 2033
- Table 6: Global Protein Water Industry Volume liter Forecast, by Region 2020 & 2033
- Table 7: Global Protein Water Industry Revenue Million Forecast, by Type 2020 & 2033
- Table 8: Global Protein Water Industry Volume liter Forecast, by Type 2020 & 2033
- Table 9: Global Protein Water Industry Revenue Million Forecast, by Distribution Channel 2020 & 2033
- Table 10: Global Protein Water Industry Volume liter Forecast, by Distribution Channel 2020 & 2033
- Table 11: Global Protein Water Industry Revenue Million Forecast, by Country 2020 & 2033
- Table 12: Global Protein Water Industry Volume liter Forecast, by Country 2020 & 2033
- Table 13: United States Protein Water Industry Revenue (Million) Forecast, by Application 2020 & 2033
- Table 14: United States Protein Water Industry Volume (liter ) Forecast, by Application 2020 & 2033
- Table 15: Canada Protein Water Industry Revenue (Million) Forecast, by Application 2020 & 2033
- Table 16: Canada Protein Water Industry Volume (liter ) Forecast, by Application 2020 & 2033
- Table 17: Mexico Protein Water Industry Revenue (Million) Forecast, by Application 2020 & 2033
- Table 18: Mexico Protein Water Industry Volume (liter ) Forecast, by Application 2020 & 2033
- Table 19: Rest of North America Protein Water Industry Revenue (Million) Forecast, by Application 2020 & 2033
- Table 20: Rest of North America Protein Water Industry Volume (liter ) Forecast, by Application 2020 & 2033
- Table 21: Global Protein Water Industry Revenue Million Forecast, by Type 2020 & 2033
- Table 22: Global Protein Water Industry Volume liter Forecast, by Type 2020 & 2033
- Table 23: Global Protein Water Industry Revenue Million Forecast, by Distribution Channel 2020 & 2033
- Table 24: Global Protein Water Industry Volume liter Forecast, by Distribution Channel 2020 & 2033
- Table 25: Global Protein Water Industry Revenue Million Forecast, by Country 2020 & 2033
- Table 26: Global Protein Water Industry Volume liter Forecast, by Country 2020 & 2033
- Table 27: Spain Protein Water Industry Revenue (Million) Forecast, by Application 2020 & 2033
- Table 28: Spain Protein Water Industry Volume (liter ) Forecast, by Application 2020 & 2033
- Table 29: United Kingdom Protein Water Industry Revenue (Million) Forecast, by Application 2020 & 2033
- Table 30: United Kingdom Protein Water Industry Volume (liter ) Forecast, by Application 2020 & 2033
- Table 31: Germany Protein Water Industry Revenue (Million) Forecast, by Application 2020 & 2033
- Table 32: Germany Protein Water Industry Volume (liter ) Forecast, by Application 2020 & 2033
- Table 33: France Protein Water Industry Revenue (Million) Forecast, by Application 2020 & 2033
- Table 34: France Protein Water Industry Volume (liter ) Forecast, by Application 2020 & 2033
- Table 35: Italy Protein Water Industry Revenue (Million) Forecast, by Application 2020 & 2033
- Table 36: Italy Protein Water Industry Volume (liter ) Forecast, by Application 2020 & 2033
- Table 37: Russia Protein Water Industry Revenue (Million) Forecast, by Application 2020 & 2033
- Table 38: Russia Protein Water Industry Volume (liter ) Forecast, by Application 2020 & 2033
- Table 39: Rest of Europe Protein Water Industry Revenue (Million) Forecast, by Application 2020 & 2033
- Table 40: Rest of Europe Protein Water Industry Volume (liter ) Forecast, by Application 2020 & 2033
- Table 41: Global Protein Water Industry Revenue Million Forecast, by Type 2020 & 2033
- Table 42: Global Protein Water Industry Volume liter Forecast, by Type 2020 & 2033
- Table 43: Global Protein Water Industry Revenue Million Forecast, by Distribution Channel 2020 & 2033
- Table 44: Global Protein Water Industry Volume liter Forecast, by Distribution Channel 2020 & 2033
- Table 45: Global Protein Water Industry Revenue Million Forecast, by Country 2020 & 2033
- Table 46: Global Protein Water Industry Volume liter Forecast, by Country 2020 & 2033
- Table 47: China Protein Water Industry Revenue (Million) Forecast, by Application 2020 & 2033
- Table 48: China Protein Water Industry Volume (liter ) Forecast, by Application 2020 & 2033
- Table 49: Japan Protein Water Industry Revenue (Million) Forecast, by Application 2020 & 2033
- Table 50: Japan Protein Water Industry Volume (liter ) Forecast, by Application 2020 & 2033
- Table 51: India Protein Water Industry Revenue (Million) Forecast, by Application 2020 & 2033
- Table 52: India Protein Water Industry Volume (liter ) Forecast, by Application 2020 & 2033
- Table 53: Australia Protein Water Industry Revenue (Million) Forecast, by Application 2020 & 2033
- Table 54: Australia Protein Water Industry Volume (liter ) Forecast, by Application 2020 & 2033
- Table 55: Rest of Asia Pacific Protein Water Industry Revenue (Million) Forecast, by Application 2020 & 2033
- Table 56: Rest of Asia Pacific Protein Water Industry Volume (liter ) Forecast, by Application 2020 & 2033
- Table 57: Global Protein Water Industry Revenue Million Forecast, by Type 2020 & 2033
- Table 58: Global Protein Water Industry Volume liter Forecast, by Type 2020 & 2033
- Table 59: Global Protein Water Industry Revenue Million Forecast, by Distribution Channel 2020 & 2033
- Table 60: Global Protein Water Industry Volume liter Forecast, by Distribution Channel 2020 & 2033
- Table 61: Global Protein Water Industry Revenue Million Forecast, by Country 2020 & 2033
- Table 62: Global Protein Water Industry Volume liter Forecast, by Country 2020 & 2033
- Table 63: Brazil Protein Water Industry Revenue (Million) Forecast, by Application 2020 & 2033
- Table 64: Brazil Protein Water Industry Volume (liter ) Forecast, by Application 2020 & 2033
- Table 65: Argentina Protein Water Industry Revenue (Million) Forecast, by Application 2020 & 2033
- Table 66: Argentina Protein Water Industry Volume (liter ) Forecast, by Application 2020 & 2033
- Table 67: Rest of South America Protein Water Industry Revenue (Million) Forecast, by Application 2020 & 2033
- Table 68: Rest of South America Protein Water Industry Volume (liter ) Forecast, by Application 2020 & 2033
- Table 69: Global Protein Water Industry Revenue Million Forecast, by Type 2020 & 2033
- Table 70: Global Protein Water Industry Volume liter Forecast, by Type 2020 & 2033
- Table 71: Global Protein Water Industry Revenue Million Forecast, by Distribution Channel 2020 & 2033
- Table 72: Global Protein Water Industry Volume liter Forecast, by Distribution Channel 2020 & 2033
- Table 73: Global Protein Water Industry Revenue Million Forecast, by Country 2020 & 2033
- Table 74: Global Protein Water Industry Volume liter Forecast, by Country 2020 & 2033
- Table 75: South Africa Protein Water Industry Revenue (Million) Forecast, by Application 2020 & 2033
- Table 76: South Africa Protein Water Industry Volume (liter ) Forecast, by Application 2020 & 2033
- Table 77: Saudi Arabia Protein Water Industry Revenue (Million) Forecast, by Application 2020 & 2033
- Table 78: Saudi Arabia Protein Water Industry Volume (liter ) Forecast, by Application 2020 & 2033
- Table 79: Rest of Middle East and Africa Protein Water Industry Revenue (Million) Forecast, by Application 2020 & 2033
- Table 80: Rest of Middle East and Africa Protein Water Industry Volume (liter ) Forecast, by Application 2020 & 2033
Frequently Asked Questions
1. What is the projected Compound Annual Growth Rate (CAGR) of the Protein Water Industry?
The projected CAGR is approximately 5.50%.
2. Which companies are prominent players in the Protein Water Industry?
Key companies in the market include Arla Foods amba, Richmond Enterprises Holdings Limited (Bodiez Protein Water), Vyomax Nutrition Limited, Molecule Beverages Ltd, Miami Bay Beverage LLC (Trimino)*List Not Exhaustive, Aquatein, Fizzique LLC, Protein2o Inc, Agropur Inc (BiPro USA), Glanbia PLC (Optimum Nutrition Inc ).
3. What are the main segments of the Protein Water Industry?
The market segments include Type, Distribution Channel.
4. Can you provide details about the market size?
The market size is estimated to be USD 1187.1 Million as of 2022.
5. What are some drivers contributing to market growth?
Increasing awareness towards fitness among consumers; Demand for convenient fortified foods.
6. What are the notable trends driving market growth?
Increased Participation in the Sports Activities.
7. Are there any restraints impacting market growth?
Increasing vegan culture in the market.
8. Can you provide examples of recent developments in the market?
In July 2022, Mumbai-based Aquatein (Athlex Beverages Private Limited), India's first protein water brand launched three new products. Through its strategic offline partnerships, the brand is all set to roll out 1200 direct points of sales and also launch the brand internationally through strategic local partnerships in the Middle East and North Africa (MENA) region.
9. What pricing options are available for accessing the report?
Pricing options include single-user, multi-user, and enterprise licenses priced at USD 4750, USD 5250, and USD 8750 respectively.
10. Is the market size provided in terms of value or volume?
The market size is provided in terms of value, measured in Million and volume, measured in liter .
11. Are there any specific market keywords associated with the report?
Yes, the market keyword associated with the report is "Protein Water Industry," which aids in identifying and referencing the specific market segment covered.
12. How do I determine which pricing option suits my needs best?
The pricing options vary based on user requirements and access needs. Individual users may opt for single-user licenses, while businesses requiring broader access may choose multi-user or enterprise licenses for cost-effective access to the report.
13. Are there any additional resources or data provided in the Protein Water Industry report?
While the report offers comprehensive insights, it's advisable to review the specific contents or supplementary materials provided to ascertain if additional resources or data are available.
14. How can I stay updated on further developments or reports in the Protein Water Industry?
To stay informed about further developments, trends, and reports in the Protein Water Industry, consider subscribing to industry newsletters, following relevant companies and organizations, or regularly checking reputable industry news sources and publications.
Methodology
Step 1 - Identification of Relevant Samples Size from Population Database


Step 2 - Approaches for Defining Global Market Size (Value, Volume* & Price*)

Note*: In applicable scenarios
Step 3 - Data Sources
Primary Research
- Web Analytics
- Survey Reports
- Research Institute
- Latest Research Reports
- Opinion Leaders
Secondary Research
- Annual Reports
- White Paper
- Latest Press Release
- Industry Association
- Paid Database
- Investor Presentations

Step 4 - Data Triangulation
Involves using different sources of information in order to increase the validity of a study
These sources are likely to be stakeholders in a program - participants, other researchers, program staff, other community members, and so on.
Then we put all data in single framework & apply various statistical tools to find out the dynamic on the market.
During the analysis stage, feedback from the stakeholder groups would be compared to determine areas of agreement as well as areas of divergence