

Key Insights
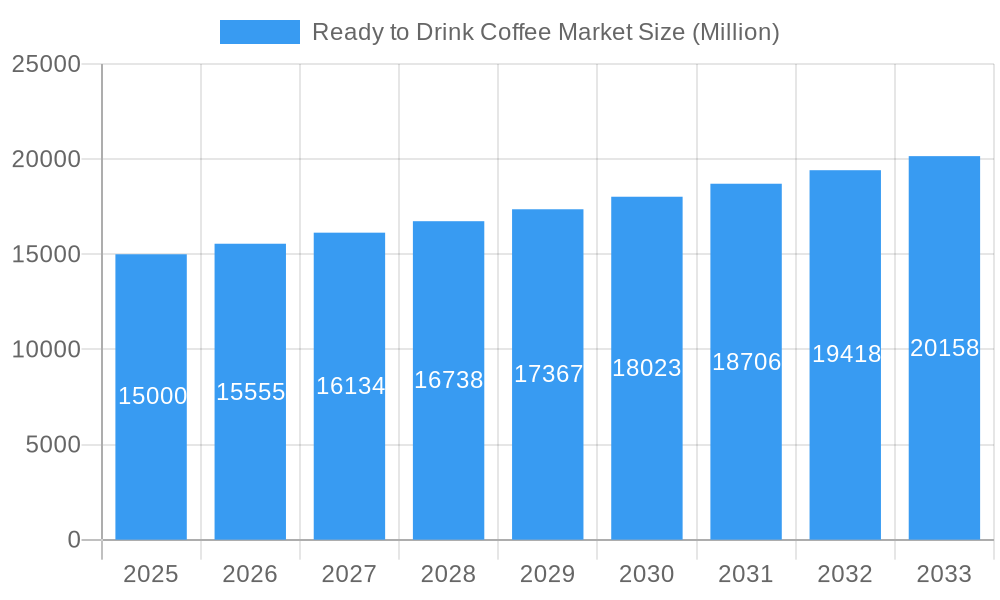
The Ready-to-Drink (RTD) coffee market is experiencing robust growth, projected to reach a substantial size by 2033. A 3.72% CAGR from 2019-2024 indicates a consistent upward trajectory fueled by several key drivers. The increasing demand for convenient and on-the-go beverage options is a significant factor, appealing to busy consumers seeking a quick caffeine fix. Furthermore, the rising popularity of cold brew coffee and innovative flavor profiles are diversifying the market and attracting new customer segments. The market segmentation reveals a diverse landscape, with on-trade channels (cafes, restaurants) and off-trade channels (retail stores, supermarkets) exhibiting strong growth, depending on regional preferences. Packaging innovations such as aseptic packages, PET bottles, and aluminum cans cater to consumer needs for portability, shelf-life, and sustainability. Leading players like Nestle, Unilever, and Coca-Cola are actively investing in R&D, expanding their product portfolios, and strategically acquiring smaller players to solidify their market positions. Geographic variations exist, with North America and Europe currently dominating the market, while Asia-Pacific shows immense potential for future growth given its burgeoning middle class and increasing coffee consumption. However, fluctuating raw material prices and intense competition could pose challenges to sustained growth.
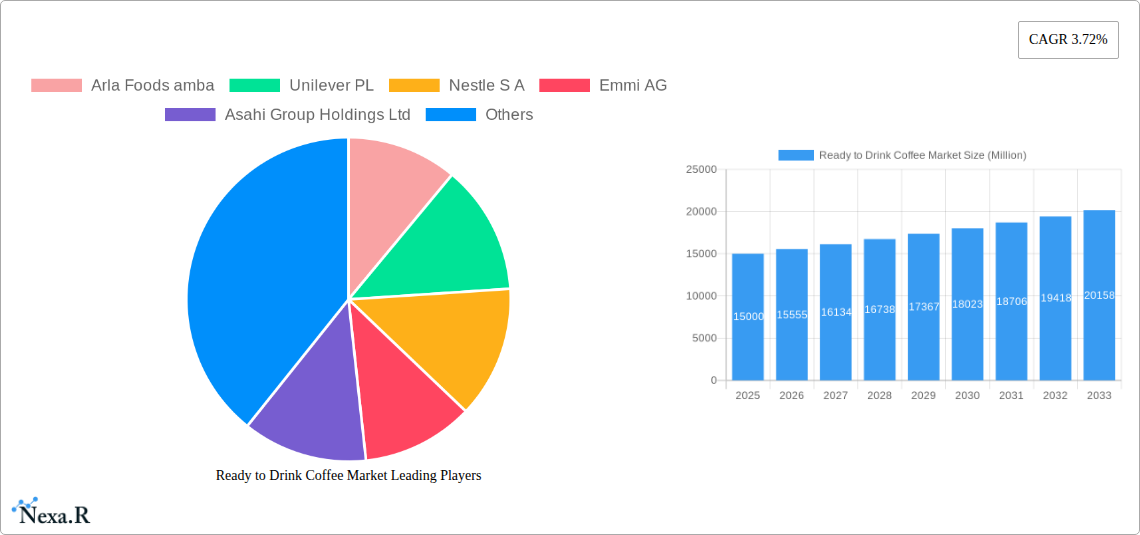
Ready to Drink Coffee Market Market Size (In Billion)
The competitive landscape is characterized by both established beverage giants and specialized coffee brands. This fosters a dynamic market where innovation and strategic partnerships play a vital role. The expanding presence of premium and specialized RTD coffee products indicates a growing preference for higher-quality options. While the on-trade channel heavily relies on immediate consumption, the off-trade channel focuses on extended shelf life and convenient packaging. Future growth will be significantly impacted by factors such as consumer health consciousness (leading to a rise in healthier sugar alternatives), sustainable packaging solutions, and successful marketing campaigns targeted towards younger demographics. Regional differences in coffee consumption patterns and cultural preferences will continue to shape the distribution strategies and product development efforts of leading brands. The market will likely see more consolidation as larger players seek to increase their market share and expand their global reach.
Ready to Drink Coffee Market Company Market Share
Ready-to-Drink (RTD) Coffee Market: A Comprehensive Report (2019-2033)
This comprehensive report provides an in-depth analysis of the global Ready-to-Drink (RTD) Coffee market, encompassing market dynamics, growth trends, regional performance, product landscape, and key player strategies. The study covers the historical period (2019-2024), base year (2025), and forecast period (2025-2033), offering valuable insights for industry professionals, investors, and stakeholders. The total market size is projected to reach xx million units by 2033.
Ready to Drink Coffee Market Dynamics & Structure
The RTD coffee market is characterized by a dynamic interplay of factors influencing its growth and structure. Market concentration is moderate, with several large players holding significant shares, but a substantial presence of smaller, niche players as well. Technological innovation, particularly in packaging and beverage formulations (e.g., cold brew, nitrogen-infused coffee), is a key driver. Regulatory frameworks concerning labeling, ingredients, and sustainability significantly impact operations. Competitive substitutes, such as tea, energy drinks, and bottled juice, exert pressure, while the rise of plant-based milks and functional beverages creates new avenues. End-user demographics, with millennials and Gen Z showing strong preference for convenient, premium coffee options, are shaping demand. M&A activity remains consistent, with an estimated xx deals recorded between 2019-2024, reflecting industry consolidation and expansion strategies.
- Market Concentration: Moderate, with top 5 players holding approximately xx% market share in 2024.
- Technological Innovation: Focus on cold brew, nitrogen infusion, and sustainable packaging.
- Regulatory Landscape: Varying regulations across regions regarding labeling and ingredients.
- Competitive Substitutes: Tea, energy drinks, and other convenient beverages.
- End-User Demographics: Strong demand from millennials and Gen Z.
- M&A Activity: xx deals completed between 2019 and 2024, with a projected increase in the forecast period.
Ready to Drink Coffee Market Growth Trends & Insights
The RTD coffee market has exhibited robust growth, achieving a CAGR of xx% during 2019-2024, driven by increasing consumer preference for convenient and high-quality coffee options. The market is expected to continue its expansion, with a projected CAGR of xx% from 2025 to 2033. Technological advancements, including improved cold brew extraction methods and innovative packaging solutions, have significantly influenced market adoption. Changing consumer lifestyles and rising disposable incomes have fueled demand, particularly in emerging markets. Furthermore, the increasing focus on sustainability and health-conscious options will further shape growth in the coming years. Market penetration is expected to reach xx% by 2033. Specific metrics regarding consumer preferences for different types of RTD coffee (e.g., cold brew, iced coffee) will be detailed within the full report.
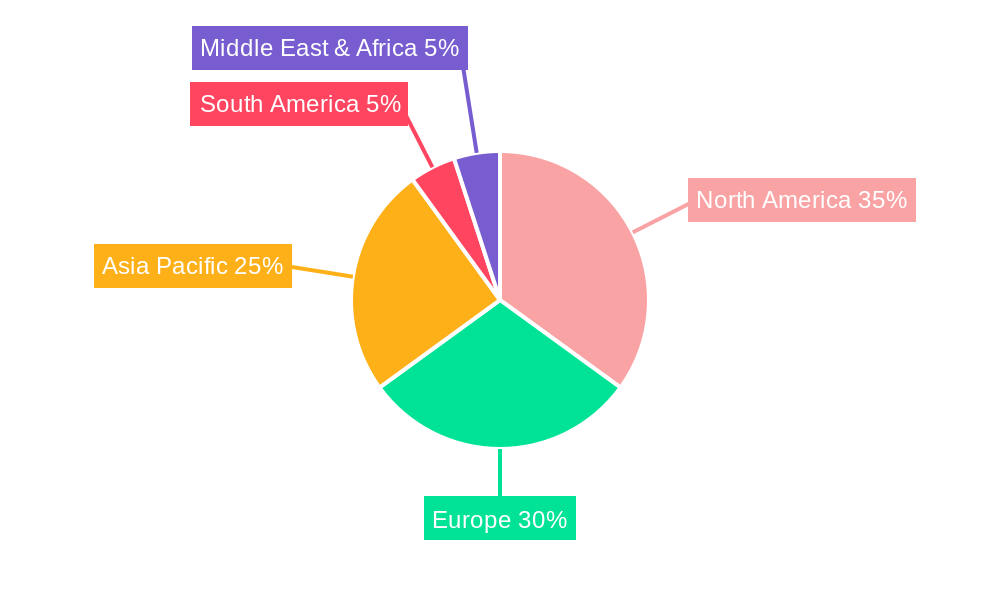
Dominant Regions, Countries, or Segments in Ready to Drink Coffee Market
The North American RTD coffee market holds the largest share globally, driven by high coffee consumption, established distribution networks, and strong consumer preference for convenience. However, Asia Pacific exhibits the fastest growth, fueled by rapid urbanization, rising disposable incomes, and increasing westernization of consumer preferences. Within the segment breakdown:
Distribution Channel: The off-trade channel (retail stores, supermarkets) currently dominates, but the on-trade (cafes, restaurants) is experiencing rapid growth.
Type: Cold coffee and iced coffee are the most popular segments, followed by other ready-to-drink coffee products. Hot coffee RTD remains a niche market.
Packaging Type: PET bottles are the most widely used packaging format, followed by metal cans and aseptic packages.
Key Drivers for North America: Established infrastructure, high per capita coffee consumption, strong brand presence.
Key Drivers for Asia Pacific: Rapid urbanization, rising disposable incomes, and increasing westernized coffee consumption.
Segment Dominance: Cold and Iced coffee drives the type segment, while PET bottles dominate packaging.
Ready to Drink Coffee Market Product Landscape
The RTD coffee market showcases a diverse range of products, from traditional coffee blends to innovative cold brew variations and functional coffee beverages. Product innovation is focused on enhancing taste, convenience, and health attributes. Key trends include the introduction of plant-based milk options, functional ingredients (e.g., vitamins, antioxidants), and sustainable packaging solutions. These product innovations cater to evolving consumer preferences, leading to higher average selling prices and greater market differentiation.
Key Drivers, Barriers & Challenges in Ready to Drink Coffee Market
Key Drivers:
- Increasing consumer demand for convenient and premium coffee options.
- Technological advancements in brewing and packaging.
- Growing popularity of cold brew coffee.
- Expansion of distribution channels.
Key Challenges:
- Intense competition from established players and new entrants.
- Fluctuations in coffee bean prices impacting production costs.
- Maintaining product quality and consistency.
- Regulatory compliance and labeling requirements.
Emerging Opportunities in Ready to Drink Coffee Market
Untapped markets in developing economies present significant growth opportunities. Innovations in functional coffee beverages, including those with added health benefits, are gaining traction. The growing demand for sustainable and ethically sourced coffee will drive market evolution. Furthermore, personalized RTD coffee products tailored to individual preferences (e.g., customized flavor profiles) represent a promising area for growth.
Growth Accelerators in the Ready to Drink Coffee Market Industry
Long-term growth is fueled by ongoing product innovations, expansion into new geographical markets, and strategic partnerships between coffee brands and distribution networks. Technological advancements, particularly in sustainable packaging and processing techniques, will drive efficiency and reduce environmental impact. The increasing popularity of cold brew and nitrogen-infused coffee will continue to fuel the market, alongside the expansion into premium and niche product segments.
Key Players Shaping the Ready to Drink Coffee Market Market
- Arla Foods amba
- Unilever PL
- Nestle S A
- Emmi AG
- Asahi Group Holdings Ltd
- PepsiCo Inc
- Rauch Fruchtsäfte GmbH & Co OG
- DyDo Group Holdings Inc
- Suntory Holdings Limited
- Luigi Lavazza S p A
- Keurig Dr Pepper Inc
- Danone S A
- The Coca-Cola Company
- Kirin Holdings Company Limited
- Sodiaal Union
Notable Milestones in Ready to Drink Coffee Market Sector
- July 2023: Keurig Dr. Pepper Inc. announced a strategic partnership with La Colombe, expanding its RTD coffee portfolio.
- July 2023: Nestlé Thailand launched new NESCAFÉ GOLD Creama Craft Latte and Americano, strengthening its presence in the Thai RTD coffee market.
- December 2023: Costa Coffee plans to open five new outlets in Morocco, enhancing brand visibility and market reach.
In-Depth Ready to Drink Coffee Market Market Outlook
The RTD coffee market is poised for continued strong growth, driven by innovation, evolving consumer preferences, and expansion into new markets. Strategic partnerships, focus on sustainability, and the development of premium and functional products will shape the market's future. The market is expected to see significant consolidation in the coming years, with larger players expanding through acquisitions and organic growth. The emphasis on convenience, premiumization, and health-conscious options will remain key factors influencing market dynamics and consumer choice.
Ready to Drink Coffee Market Segmentation
-
1. Soft Drink Type
- 1.1. Cold Brew Coffee
- 1.2. Iced coffee
- 1.3. Other RTD Coffee
-
2. Packaging Type
- 2.1. Aseptic packages
- 2.2. Glass Bottles
- 2.3. Metal Can
- 2.4. PET Bottles
-
3. Distribution Channel
-
3.1. Off-trade
- 3.1.1. Convenience Stores
- 3.1.2. Online Retail
- 3.1.3. Specialty Stores
- 3.1.4. Supermarket/Hypermarket
- 3.1.5. Others
- 3.2. On-trade
-
3.1. Off-trade
Ready to Drink Coffee Market Segmentation By Geography
-
1. North America
- 1.1. United States
- 1.2. Canada
- 1.3. Mexico
-
2. South America
- 2.1. Brazil
- 2.2. Argentina
- 2.3. Rest of South America
-
3. Europe
- 3.1. United Kingdom
- 3.2. Germany
- 3.3. France
- 3.4. Italy
- 3.5. Spain
- 3.6. Russia
- 3.7. Benelux
- 3.8. Nordics
- 3.9. Rest of Europe
-
4. Middle East & Africa
- 4.1. Turkey
- 4.2. Israel
- 4.3. GCC
- 4.4. North Africa
- 4.5. South Africa
- 4.6. Rest of Middle East & Africa
-
5. Asia Pacific
- 5.1. China
- 5.2. India
- 5.3. Japan
- 5.4. South Korea
- 5.5. ASEAN
- 5.6. Oceania
- 5.7. Rest of Asia Pacific
Ready to Drink Coffee Market Regional Market Share
Geographic Coverage of Ready to Drink Coffee Market
Ready to Drink Coffee Market REPORT HIGHLIGHTS
| Aspects | Details |
|---|---|
| Study Period | 2020-2034 |
| Base Year | 2025 |
| Estimated Year | 2026 |
| Forecast Period | 2026-2034 |
| Historical Period | 2020-2025 |
| Growth Rate | CAGR of 5.99% from 2020-2034 |
| Segmentation |
|
Table of Contents
- 1. Introduction
- 1.1. Research Scope
- 1.2. Market Segmentation
- 1.3. Research Objective
- 1.4. Definitions and Assumptions
- 2. Executive Summary
- 2.1. Market Snapshot
- 3. Market Dynamics
- 3.1. Market Drivers
- 3.2. Market Restrains
- 3.3. Market Trends
- 3.4. Market Opportunities
- 4. Market Factor Analysis
- 4.1. Porters Five Forces
- 4.1.1. Bargaining Power of Suppliers
- 4.1.2. Bargaining Power of Buyers
- 4.1.3. Threat of New Entrants
- 4.1.4. Threat of Substitutes
- 4.1.5. Competitive Rivalry
- 4.2. PESTEL analysis
- 4.3. BCG Analysis
- 4.3.1. Stars (High Growth, High Market Share)
- 4.3.2. Cash Cows (Low Growth, High Market Share)
- 4.3.3. Question Mark (High Growth, Low Market Share)
- 4.3.4. Dogs (Low Growth, Low Market Share)
- 4.4. Ansoff Matrix Analysis
- 4.5. Supply Chain Analysis
- 4.6. Regulatory Landscape
- 4.7. Current Market Potential and Opportunity Assessment (TAM–SAM–SOM Framework)
- 4.8. NRP Analyst Note
- 4.1. Porters Five Forces
- 5. Market Analysis, Insights and Forecast 2021-2033
- 5.1. Market Analysis, Insights and Forecast - by Soft Drink Type
- 5.1.1. Cold Brew Coffee
- 5.1.2. Iced coffee
- 5.1.3. Other RTD Coffee
- 5.2. Market Analysis, Insights and Forecast - by Packaging Type
- 5.2.1. Aseptic packages
- 5.2.2. Glass Bottles
- 5.2.3. Metal Can
- 5.2.4. PET Bottles
- 5.3. Market Analysis, Insights and Forecast - by Distribution Channel
- 5.3.1. Off-trade
- 5.3.1.1. Convenience Stores
- 5.3.1.2. Online Retail
- 5.3.1.3. Specialty Stores
- 5.3.1.4. Supermarket/Hypermarket
- 5.3.1.5. Others
- 5.3.2. On-trade
- 5.3.1. Off-trade
- 5.4. Market Analysis, Insights and Forecast - by Region
- 5.4.1. North America
- 5.4.2. South America
- 5.4.3. Europe
- 5.4.4. Middle East & Africa
- 5.4.5. Asia Pacific
- 5.1. Market Analysis, Insights and Forecast - by Soft Drink Type
- 6. Global Ready to Drink Coffee Market Analysis, Insights and Forecast, 2021-2033
- 6.1. Market Analysis, Insights and Forecast - by Soft Drink Type
- 6.1.1. Cold Brew Coffee
- 6.1.2. Iced coffee
- 6.1.3. Other RTD Coffee
- 6.2. Market Analysis, Insights and Forecast - by Packaging Type
- 6.2.1. Aseptic packages
- 6.2.2. Glass Bottles
- 6.2.3. Metal Can
- 6.2.4. PET Bottles
- 6.3. Market Analysis, Insights and Forecast - by Distribution Channel
- 6.3.1. Off-trade
- 6.3.1.1. Convenience Stores
- 6.3.1.2. Online Retail
- 6.3.1.3. Specialty Stores
- 6.3.1.4. Supermarket/Hypermarket
- 6.3.1.5. Others
- 6.3.2. On-trade
- 6.3.1. Off-trade
- 6.1. Market Analysis, Insights and Forecast - by Soft Drink Type
- 7. North America Ready to Drink Coffee Market Analysis, Insights and Forecast, 2020-2032
- 7.1. Market Analysis, Insights and Forecast - by Soft Drink Type
- 7.1.1. Cold Brew Coffee
- 7.1.2. Iced coffee
- 7.1.3. Other RTD Coffee
- 7.2. Market Analysis, Insights and Forecast - by Packaging Type
- 7.2.1. Aseptic packages
- 7.2.2. Glass Bottles
- 7.2.3. Metal Can
- 7.2.4. PET Bottles
- 7.3. Market Analysis, Insights and Forecast - by Distribution Channel
- 7.3.1. Off-trade
- 7.3.1.1. Convenience Stores
- 7.3.1.2. Online Retail
- 7.3.1.3. Specialty Stores
- 7.3.1.4. Supermarket/Hypermarket
- 7.3.1.5. Others
- 7.3.2. On-trade
- 7.3.1. Off-trade
- 7.1. Market Analysis, Insights and Forecast - by Soft Drink Type
- 8. South America Ready to Drink Coffee Market Analysis, Insights and Forecast, 2020-2032
- 8.1. Market Analysis, Insights and Forecast - by Soft Drink Type
- 8.1.1. Cold Brew Coffee
- 8.1.2. Iced coffee
- 8.1.3. Other RTD Coffee
- 8.2. Market Analysis, Insights and Forecast - by Packaging Type
- 8.2.1. Aseptic packages
- 8.2.2. Glass Bottles
- 8.2.3. Metal Can
- 8.2.4. PET Bottles
- 8.3. Market Analysis, Insights and Forecast - by Distribution Channel
- 8.3.1. Off-trade
- 8.3.1.1. Convenience Stores
- 8.3.1.2. Online Retail
- 8.3.1.3. Specialty Stores
- 8.3.1.4. Supermarket/Hypermarket
- 8.3.1.5. Others
- 8.3.2. On-trade
- 8.3.1. Off-trade
- 8.1. Market Analysis, Insights and Forecast - by Soft Drink Type
- 9. Europe Ready to Drink Coffee Market Analysis, Insights and Forecast, 2020-2032
- 9.1. Market Analysis, Insights and Forecast - by Soft Drink Type
- 9.1.1. Cold Brew Coffee
- 9.1.2. Iced coffee
- 9.1.3. Other RTD Coffee
- 9.2. Market Analysis, Insights and Forecast - by Packaging Type
- 9.2.1. Aseptic packages
- 9.2.2. Glass Bottles
- 9.2.3. Metal Can
- 9.2.4. PET Bottles
- 9.3. Market Analysis, Insights and Forecast - by Distribution Channel
- 9.3.1. Off-trade
- 9.3.1.1. Convenience Stores
- 9.3.1.2. Online Retail
- 9.3.1.3. Specialty Stores
- 9.3.1.4. Supermarket/Hypermarket
- 9.3.1.5. Others
- 9.3.2. On-trade
- 9.3.1. Off-trade
- 9.1. Market Analysis, Insights and Forecast - by Soft Drink Type
- 10. Middle East & Africa Ready to Drink Coffee Market Analysis, Insights and Forecast, 2020-2032
- 10.1. Market Analysis, Insights and Forecast - by Soft Drink Type
- 10.1.1. Cold Brew Coffee
- 10.1.2. Iced coffee
- 10.1.3. Other RTD Coffee
- 10.2. Market Analysis, Insights and Forecast - by Packaging Type
- 10.2.1. Aseptic packages
- 10.2.2. Glass Bottles
- 10.2.3. Metal Can
- 10.2.4. PET Bottles
- 10.3. Market Analysis, Insights and Forecast - by Distribution Channel
- 10.3.1. Off-trade
- 10.3.1.1. Convenience Stores
- 10.3.1.2. Online Retail
- 10.3.1.3. Specialty Stores
- 10.3.1.4. Supermarket/Hypermarket
- 10.3.1.5. Others
- 10.3.2. On-trade
- 10.3.1. Off-trade
- 10.1. Market Analysis, Insights and Forecast - by Soft Drink Type
- 11. Asia Pacific Ready to Drink Coffee Market Analysis, Insights and Forecast, 2020-2032
- 11.1. Market Analysis, Insights and Forecast - by Soft Drink Type
- 11.1.1. Cold Brew Coffee
- 11.1.2. Iced coffee
- 11.1.3. Other RTD Coffee
- 11.2. Market Analysis, Insights and Forecast - by Packaging Type
- 11.2.1. Aseptic packages
- 11.2.2. Glass Bottles
- 11.2.3. Metal Can
- 11.2.4. PET Bottles
- 11.3. Market Analysis, Insights and Forecast - by Distribution Channel
- 11.3.1. Off-trade
- 11.3.1.1. Convenience Stores
- 11.3.1.2. Online Retail
- 11.3.1.3. Specialty Stores
- 11.3.1.4. Supermarket/Hypermarket
- 11.3.1.5. Others
- 11.3.2. On-trade
- 11.3.1. Off-trade
- 11.1. Market Analysis, Insights and Forecast - by Soft Drink Type
- 12. Competitive Analysis
- 12.1. Company Profiles
- 12.1.1 Arla Foods amba
- 12.1.1.1. Company Overview
- 12.1.1.2. Products
- 12.1.1.3. Company Financials
- 12.1.1.4. SWOT Analysis
- 12.1.2 Unilever PL
- 12.1.2.1. Company Overview
- 12.1.2.2. Products
- 12.1.2.3. Company Financials
- 12.1.2.4. SWOT Analysis
- 12.1.3 Nestle S A
- 12.1.3.1. Company Overview
- 12.1.3.2. Products
- 12.1.3.3. Company Financials
- 12.1.3.4. SWOT Analysis
- 12.1.4 Emmi AG
- 12.1.4.1. Company Overview
- 12.1.4.2. Products
- 12.1.4.3. Company Financials
- 12.1.4.4. SWOT Analysis
- 12.1.5 Asahi Group Holdings Ltd
- 12.1.5.1. Company Overview
- 12.1.5.2. Products
- 12.1.5.3. Company Financials
- 12.1.5.4. SWOT Analysis
- 12.1.6 PepsiCo Inc
- 12.1.6.1. Company Overview
- 12.1.6.2. Products
- 12.1.6.3. Company Financials
- 12.1.6.4. SWOT Analysis
- 12.1.7 Rauch Fruchtsäfte GmbH & Co OG
- 12.1.7.1. Company Overview
- 12.1.7.2. Products
- 12.1.7.3. Company Financials
- 12.1.7.4. SWOT Analysis
- 12.1.8 DyDo Group HoldingsInc
- 12.1.8.1. Company Overview
- 12.1.8.2. Products
- 12.1.8.3. Company Financials
- 12.1.8.4. SWOT Analysis
- 12.1.9 Suntory Holdings Limited
- 12.1.9.1. Company Overview
- 12.1.9.2. Products
- 12.1.9.3. Company Financials
- 12.1.9.4. SWOT Analysis
- 12.1.10 Luigi Lavazza S p A
- 12.1.10.1. Company Overview
- 12.1.10.2. Products
- 12.1.10.3. Company Financials
- 12.1.10.4. SWOT Analysis
- 12.1.11 Keurig Dr Pepper Inc
- 12.1.11.1. Company Overview
- 12.1.11.2. Products
- 12.1.11.3. Company Financials
- 12.1.11.4. SWOT Analysis
- 12.1.12 Danone S A
- 12.1.12.1. Company Overview
- 12.1.12.2. Products
- 12.1.12.3. Company Financials
- 12.1.12.4. SWOT Analysis
- 12.1.13 The Coca-Cola Company
- 12.1.13.1. Company Overview
- 12.1.13.2. Products
- 12.1.13.3. Company Financials
- 12.1.13.4. SWOT Analysis
- 12.1.14 Kirin Holdings Company Limited
- 12.1.14.1. Company Overview
- 12.1.14.2. Products
- 12.1.14.3. Company Financials
- 12.1.14.4. SWOT Analysis
- 12.1.15 Sodiaal Union
- 12.1.15.1. Company Overview
- 12.1.15.2. Products
- 12.1.15.3. Company Financials
- 12.1.15.4. SWOT Analysis
- 12.1.1 Arla Foods amba
- 12.2. Market Entropy
- 12.2.1 Company's Key Areas Served
- 12.2.2 Recent Developments
- 12.3. Company Market Share Analysis 2025
- 12.3.1 Top 5 Companies Market Share Analysis
- 12.3.2 Top 3 Companies Market Share Analysis
- 12.4. List of Potential Customers
- 13. Research Methodology
List of Figures
- Figure 1: Global Ready to Drink Coffee Market Revenue Breakdown (billion, %) by Region 2025 & 2033
- Figure 2: North America Ready to Drink Coffee Market Revenue (billion), by Soft Drink Type 2025 & 2033
- Figure 3: North America Ready to Drink Coffee Market Revenue Share (%), by Soft Drink Type 2025 & 2033
- Figure 4: North America Ready to Drink Coffee Market Revenue (billion), by Packaging Type 2025 & 2033
- Figure 5: North America Ready to Drink Coffee Market Revenue Share (%), by Packaging Type 2025 & 2033
- Figure 6: North America Ready to Drink Coffee Market Revenue (billion), by Distribution Channel 2025 & 2033
- Figure 7: North America Ready to Drink Coffee Market Revenue Share (%), by Distribution Channel 2025 & 2033
- Figure 8: North America Ready to Drink Coffee Market Revenue (billion), by Country 2025 & 2033
- Figure 9: North America Ready to Drink Coffee Market Revenue Share (%), by Country 2025 & 2033
- Figure 10: South America Ready to Drink Coffee Market Revenue (billion), by Soft Drink Type 2025 & 2033
- Figure 11: South America Ready to Drink Coffee Market Revenue Share (%), by Soft Drink Type 2025 & 2033
- Figure 12: South America Ready to Drink Coffee Market Revenue (billion), by Packaging Type 2025 & 2033
- Figure 13: South America Ready to Drink Coffee Market Revenue Share (%), by Packaging Type 2025 & 2033
- Figure 14: South America Ready to Drink Coffee Market Revenue (billion), by Distribution Channel 2025 & 2033
- Figure 15: South America Ready to Drink Coffee Market Revenue Share (%), by Distribution Channel 2025 & 2033
- Figure 16: South America Ready to Drink Coffee Market Revenue (billion), by Country 2025 & 2033
- Figure 17: South America Ready to Drink Coffee Market Revenue Share (%), by Country 2025 & 2033
- Figure 18: Europe Ready to Drink Coffee Market Revenue (billion), by Soft Drink Type 2025 & 2033
- Figure 19: Europe Ready to Drink Coffee Market Revenue Share (%), by Soft Drink Type 2025 & 2033
- Figure 20: Europe Ready to Drink Coffee Market Revenue (billion), by Packaging Type 2025 & 2033
- Figure 21: Europe Ready to Drink Coffee Market Revenue Share (%), by Packaging Type 2025 & 2033
- Figure 22: Europe Ready to Drink Coffee Market Revenue (billion), by Distribution Channel 2025 & 2033
- Figure 23: Europe Ready to Drink Coffee Market Revenue Share (%), by Distribution Channel 2025 & 2033
- Figure 24: Europe Ready to Drink Coffee Market Revenue (billion), by Country 2025 & 2033
- Figure 25: Europe Ready to Drink Coffee Market Revenue Share (%), by Country 2025 & 2033
- Figure 26: Middle East & Africa Ready to Drink Coffee Market Revenue (billion), by Soft Drink Type 2025 & 2033
- Figure 27: Middle East & Africa Ready to Drink Coffee Market Revenue Share (%), by Soft Drink Type 2025 & 2033
- Figure 28: Middle East & Africa Ready to Drink Coffee Market Revenue (billion), by Packaging Type 2025 & 2033
- Figure 29: Middle East & Africa Ready to Drink Coffee Market Revenue Share (%), by Packaging Type 2025 & 2033
- Figure 30: Middle East & Africa Ready to Drink Coffee Market Revenue (billion), by Distribution Channel 2025 & 2033
- Figure 31: Middle East & Africa Ready to Drink Coffee Market Revenue Share (%), by Distribution Channel 2025 & 2033
- Figure 32: Middle East & Africa Ready to Drink Coffee Market Revenue (billion), by Country 2025 & 2033
- Figure 33: Middle East & Africa Ready to Drink Coffee Market Revenue Share (%), by Country 2025 & 2033
- Figure 34: Asia Pacific Ready to Drink Coffee Market Revenue (billion), by Soft Drink Type 2025 & 2033
- Figure 35: Asia Pacific Ready to Drink Coffee Market Revenue Share (%), by Soft Drink Type 2025 & 2033
- Figure 36: Asia Pacific Ready to Drink Coffee Market Revenue (billion), by Packaging Type 2025 & 2033
- Figure 37: Asia Pacific Ready to Drink Coffee Market Revenue Share (%), by Packaging Type 2025 & 2033
- Figure 38: Asia Pacific Ready to Drink Coffee Market Revenue (billion), by Distribution Channel 2025 & 2033
- Figure 39: Asia Pacific Ready to Drink Coffee Market Revenue Share (%), by Distribution Channel 2025 & 2033
- Figure 40: Asia Pacific Ready to Drink Coffee Market Revenue (billion), by Country 2025 & 2033
- Figure 41: Asia Pacific Ready to Drink Coffee Market Revenue Share (%), by Country 2025 & 2033
List of Tables
- Table 1: Global Ready to Drink Coffee Market Revenue billion Forecast, by Soft Drink Type 2020 & 2033
- Table 2: Global Ready to Drink Coffee Market Revenue billion Forecast, by Packaging Type 2020 & 2033
- Table 3: Global Ready to Drink Coffee Market Revenue billion Forecast, by Distribution Channel 2020 & 2033
- Table 4: Global Ready to Drink Coffee Market Revenue billion Forecast, by Region 2020 & 2033
- Table 5: Global Ready to Drink Coffee Market Revenue billion Forecast, by Soft Drink Type 2020 & 2033
- Table 6: Global Ready to Drink Coffee Market Revenue billion Forecast, by Packaging Type 2020 & 2033
- Table 7: Global Ready to Drink Coffee Market Revenue billion Forecast, by Distribution Channel 2020 & 2033
- Table 8: Global Ready to Drink Coffee Market Revenue billion Forecast, by Country 2020 & 2033
- Table 9: United States Ready to Drink Coffee Market Revenue (billion) Forecast, by Application 2020 & 2033
- Table 10: Canada Ready to Drink Coffee Market Revenue (billion) Forecast, by Application 2020 & 2033
- Table 11: Mexico Ready to Drink Coffee Market Revenue (billion) Forecast, by Application 2020 & 2033
- Table 12: Global Ready to Drink Coffee Market Revenue billion Forecast, by Soft Drink Type 2020 & 2033
- Table 13: Global Ready to Drink Coffee Market Revenue billion Forecast, by Packaging Type 2020 & 2033
- Table 14: Global Ready to Drink Coffee Market Revenue billion Forecast, by Distribution Channel 2020 & 2033
- Table 15: Global Ready to Drink Coffee Market Revenue billion Forecast, by Country 2020 & 2033
- Table 16: Brazil Ready to Drink Coffee Market Revenue (billion) Forecast, by Application 2020 & 2033
- Table 17: Argentina Ready to Drink Coffee Market Revenue (billion) Forecast, by Application 2020 & 2033
- Table 18: Rest of South America Ready to Drink Coffee Market Revenue (billion) Forecast, by Application 2020 & 2033
- Table 19: Global Ready to Drink Coffee Market Revenue billion Forecast, by Soft Drink Type 2020 & 2033
- Table 20: Global Ready to Drink Coffee Market Revenue billion Forecast, by Packaging Type 2020 & 2033
- Table 21: Global Ready to Drink Coffee Market Revenue billion Forecast, by Distribution Channel 2020 & 2033
- Table 22: Global Ready to Drink Coffee Market Revenue billion Forecast, by Country 2020 & 2033
- Table 23: United Kingdom Ready to Drink Coffee Market Revenue (billion) Forecast, by Application 2020 & 2033
- Table 24: Germany Ready to Drink Coffee Market Revenue (billion) Forecast, by Application 2020 & 2033
- Table 25: France Ready to Drink Coffee Market Revenue (billion) Forecast, by Application 2020 & 2033
- Table 26: Italy Ready to Drink Coffee Market Revenue (billion) Forecast, by Application 2020 & 2033
- Table 27: Spain Ready to Drink Coffee Market Revenue (billion) Forecast, by Application 2020 & 2033
- Table 28: Russia Ready to Drink Coffee Market Revenue (billion) Forecast, by Application 2020 & 2033
- Table 29: Benelux Ready to Drink Coffee Market Revenue (billion) Forecast, by Application 2020 & 2033
- Table 30: Nordics Ready to Drink Coffee Market Revenue (billion) Forecast, by Application 2020 & 2033
- Table 31: Rest of Europe Ready to Drink Coffee Market Revenue (billion) Forecast, by Application 2020 & 2033
- Table 32: Global Ready to Drink Coffee Market Revenue billion Forecast, by Soft Drink Type 2020 & 2033
- Table 33: Global Ready to Drink Coffee Market Revenue billion Forecast, by Packaging Type 2020 & 2033
- Table 34: Global Ready to Drink Coffee Market Revenue billion Forecast, by Distribution Channel 2020 & 2033
- Table 35: Global Ready to Drink Coffee Market Revenue billion Forecast, by Country 2020 & 2033
- Table 36: Turkey Ready to Drink Coffee Market Revenue (billion) Forecast, by Application 2020 & 2033
- Table 37: Israel Ready to Drink Coffee Market Revenue (billion) Forecast, by Application 2020 & 2033
- Table 38: GCC Ready to Drink Coffee Market Revenue (billion) Forecast, by Application 2020 & 2033
- Table 39: North Africa Ready to Drink Coffee Market Revenue (billion) Forecast, by Application 2020 & 2033
- Table 40: South Africa Ready to Drink Coffee Market Revenue (billion) Forecast, by Application 2020 & 2033
- Table 41: Rest of Middle East & Africa Ready to Drink Coffee Market Revenue (billion) Forecast, by Application 2020 & 2033
- Table 42: Global Ready to Drink Coffee Market Revenue billion Forecast, by Soft Drink Type 2020 & 2033
- Table 43: Global Ready to Drink Coffee Market Revenue billion Forecast, by Packaging Type 2020 & 2033
- Table 44: Global Ready to Drink Coffee Market Revenue billion Forecast, by Distribution Channel 2020 & 2033
- Table 45: Global Ready to Drink Coffee Market Revenue billion Forecast, by Country 2020 & 2033
- Table 46: China Ready to Drink Coffee Market Revenue (billion) Forecast, by Application 2020 & 2033
- Table 47: India Ready to Drink Coffee Market Revenue (billion) Forecast, by Application 2020 & 2033
- Table 48: Japan Ready to Drink Coffee Market Revenue (billion) Forecast, by Application 2020 & 2033
- Table 49: South Korea Ready to Drink Coffee Market Revenue (billion) Forecast, by Application 2020 & 2033
- Table 50: ASEAN Ready to Drink Coffee Market Revenue (billion) Forecast, by Application 2020 & 2033
- Table 51: Oceania Ready to Drink Coffee Market Revenue (billion) Forecast, by Application 2020 & 2033
- Table 52: Rest of Asia Pacific Ready to Drink Coffee Market Revenue (billion) Forecast, by Application 2020 & 2033
Frequently Asked Questions
1. What is the projected Compound Annual Growth Rate (CAGR) of the Ready to Drink Coffee Market?
The projected CAGR is approximately 5.99%.
2. Which companies are prominent players in the Ready to Drink Coffee Market?
Key companies in the market include Arla Foods amba, Unilever PL, Nestle S A, Emmi AG, Asahi Group Holdings Ltd, PepsiCo Inc, Rauch Fruchtsäfte GmbH & Co OG, DyDo Group HoldingsInc, Suntory Holdings Limited, Luigi Lavazza S p A, Keurig Dr Pepper Inc, Danone S A, The Coca-Cola Company, Kirin Holdings Company Limited, Sodiaal Union.
3. What are the main segments of the Ready to Drink Coffee Market?
The market segments include Soft Drink Type, Packaging Type, Distribution Channel.
4. Can you provide details about the market size?
The market size is estimated to be USD 119.7 billion as of 2022.
5. What are some drivers contributing to market growth?
Rising Consumer Awareness about Health and Fitness; Increasing the Use of Casein and Caseinate in Food and Beverage Industry.
6. What are the notable trends driving market growth?
OTHER KEY INDUSTRY TRENDS COVERED IN THE REPORT.
7. Are there any restraints impacting market growth?
High Competition From Alternative Protein Sources.
8. Can you provide examples of recent developments in the market?
December 2023: Costa Coffee’s Moroccan franchisee Goldex Morocco has planned to launch five new outlets in Morocco by the end of Q3 2023 at a cost of USD m. Two will be in Casablanca, two in Rabat and the final outlet will be opened in Bouskoura.July 2023: Keurig Dr. Pepper Inc. announced a strategic partnership with La Colombe, including a long-term sales and distribution agreement for La Colombe's ready-to-drink coffee. Keurig Dr Pepper will also make an equity investment in La Colombe, enabling KDP to participate in the value creation upside expected from the partnership.July 2023: Nestlé Thailand has launched the new NESCAFÉ GOLD Creama Craft Latte and NESCAFÉ GOLD Creama Craft Americano in the RTD coffee category in Thailand.
9. What pricing options are available for accessing the report?
Pricing options include single-user, multi-user, and enterprise licenses priced at USD 3800, USD 4500, and USD 5800 respectively.
10. Is the market size provided in terms of value or volume?
The market size is provided in terms of value, measured in billion.
11. Are there any specific market keywords associated with the report?
Yes, the market keyword associated with the report is "Ready to Drink Coffee Market," which aids in identifying and referencing the specific market segment covered.
12. How do I determine which pricing option suits my needs best?
The pricing options vary based on user requirements and access needs. Individual users may opt for single-user licenses, while businesses requiring broader access may choose multi-user or enterprise licenses for cost-effective access to the report.
13. Are there any additional resources or data provided in the Ready to Drink Coffee Market report?
While the report offers comprehensive insights, it's advisable to review the specific contents or supplementary materials provided to ascertain if additional resources or data are available.
14. How can I stay updated on further developments or reports in the Ready to Drink Coffee Market?
To stay informed about further developments, trends, and reports in the Ready to Drink Coffee Market, consider subscribing to industry newsletters, following relevant companies and organizations, or regularly checking reputable industry news sources and publications.
Methodology
Step 1 - Identification of Relevant Samples Size from Population Database


Step 2 - Approaches for Defining Global Market Size (Value, Volume* & Price*)

Note*: In applicable scenarios
Step 3 - Data Sources
Primary Research
- Web Analytics
- Survey Reports
- Research Institute
- Latest Research Reports
- Opinion Leaders
Secondary Research
- Annual Reports
- White Paper
- Latest Press Release
- Industry Association
- Paid Database
- Investor Presentations

Step 4 - Data Triangulation
Involves using different sources of information in order to increase the validity of a study
These sources are likely to be stakeholders in a program - participants, other researchers, program staff, other community members, and so on.
Then we put all data in single framework & apply various statistical tools to find out the dynamic on the market.
During the analysis stage, feedback from the stakeholder groups would be compared to determine areas of agreement as well as areas of divergence