

Key Insights
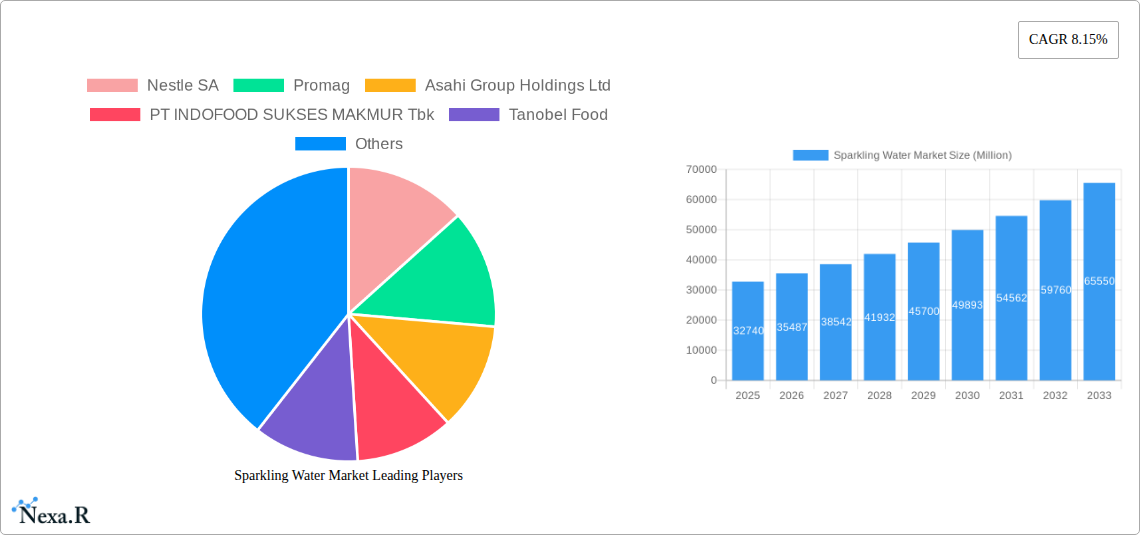
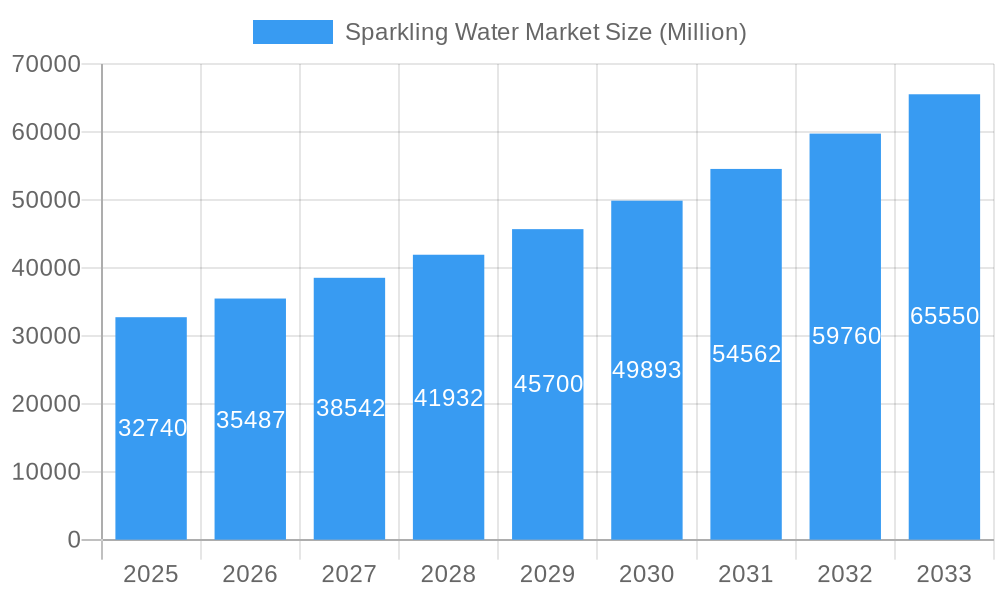
The European sparkling water market, valued at approximately €32.74 billion in 2025, is experiencing robust growth, projected to expand at a Compound Annual Growth Rate (CAGR) of 8.15% from 2025 to 2033. This growth is driven by several key factors. Increasing health consciousness among consumers is fueling demand for healthier beverage alternatives to sugary sodas. The rising popularity of active lifestyles and wellness trends further contributes to this shift. Furthermore, the innovative development of flavored and functional sparkling waters, enriched with vitamins, minerals, or electrolytes, caters to a wider consumer base seeking both refreshment and added health benefits. The convenience of readily available sparkling water in supermarkets, convenience stores, and online channels also plays a crucial role in driving market expansion. Competition is intense, with major players like Nestle, Coca-Cola, and Danone alongside regional brands vying for market share through product diversification, marketing campaigns, and strategic distribution partnerships.
Sparkling Water Market Market Size (In Billion)
The market segmentation reveals significant opportunities within different distribution channels. Supermarkets and hypermarkets remain the dominant channel, benefiting from established distribution networks and consumer shopping habits. However, the growing popularity of online retail and e-commerce platforms provides a significant avenue for expansion, particularly for specialized or premium sparkling water brands. The on-trade sector (restaurants, bars, etc.) also presents a substantial market segment, offering opportunities for strategic partnerships and product placement. While potential restraints such as fluctuating raw material prices and environmental concerns related to plastic packaging exist, the overall positive trend of health-conscious consumer behavior and product innovation strongly suggests continued market growth throughout the forecast period. The continued expansion of functional waters, with their health and wellness benefits, is expected to fuel the highest growth within market segments.
Sparkling Water Market Company Market Share
Sparkling Water Market: A Comprehensive Market Report (2019-2033)
This in-depth report provides a comprehensive analysis of the global sparkling water market, encompassing market dynamics, growth trends, regional segmentation, product landscape, key players, and future outlook. The report covers the period from 2019 to 2033, with 2025 as the base year and a forecast period from 2025 to 2033. The study delves into the parent market of bottled water and the child market of flavored sparkling water, offering granular insights for industry professionals. The total market size in 2025 is estimated at xx Million units.
Sparkling Water Market Dynamics & Structure
The sparkling water market is characterized by a moderately concentrated structure, with key players like Nestle SA, The Coca-Cola Company, and Danone S.A. holding significant market share. Technological innovation, particularly in packaging and flavor development, is a key driver. Stringent regulatory frameworks concerning water safety and labeling influence market dynamics. The competitive landscape includes substitutes like carbonated soft drinks and juices, impacting market share. End-user demographics, particularly health-conscious millennials and Gen Z, are significantly influencing consumption patterns. M&A activity within the beverage sector, including water, has been moderate in recent years, with approximately xx deals annually between 2020 and 2024, representing a xx% market share.
- Market Concentration: Moderately concentrated, with top players holding xx% market share in 2024.
- Innovation Drivers: Sustainable packaging, functional additions (e.g., electrolytes, vitamins), and novel flavor profiles.
- Regulatory Frameworks: Stringent regulations regarding water purity and labeling impact product development and market entry.
- Competitive Substitutes: Carbonated soft drinks, juices, and other beverages compete for consumer preference.
- End-User Demographics: Health-conscious consumers (Millennials and Gen Z) are driving demand.
- M&A Trends: Moderate M&A activity, with xx deals per year between 2020-2024, indicating consolidation.
Sparkling Water Market Growth Trends & Insights
The global sparkling water market exhibits a robust growth trajectory, driven by increasing health consciousness, growing preference for healthier alternatives to sugary drinks, and expanding distribution channels. The market size has witnessed a Compound Annual Growth Rate (CAGR) of xx% from 2019 to 2024 and is projected to maintain a CAGR of xx% from 2025 to 2033, reaching an estimated xx Million units by 2033. Market penetration remains relatively high in developed nations, with significant growth potential in emerging economies. Technological disruptions, such as improved packaging and on-demand delivery services, further fuel market expansion. Consumer behavior shifts toward convenience and premiumization are also influencing the market's growth.
Dominant Regions, Countries, or Segments in Sparkling Water Market
North America and Europe currently dominate the sparkling water market, driven by high consumer awareness of health and wellness, coupled with robust distribution networks. Within these regions, the United States and Germany, respectively, stand out as leading countries. However, significant growth potential exists in Asia-Pacific and Latin America, fueled by rising disposable incomes and increasing preference for healthier beverages. Within product segments, sparkling water outperforms still and functional water in terms of growth, primarily due to its perceived refreshment and health benefits. The supermarket/hypermarket channel accounts for the largest distribution share, followed by convenience stores and online retailers.
- Leading Region: North America (xx% market share in 2024).
- Leading Country: United States (xx% of North American market share in 2024).
- Fastest Growing Segment (Type): Sparkling Water (xx% CAGR from 2025-2033).
- Dominant Distribution Channel: Supermarkets/Hypermarkets (xx% of total sales in 2024).
- Key Drivers: Rising disposable incomes, changing consumer preferences (health & wellness), and expanding distribution networks in emerging markets.
Sparkling Water Market Product Landscape
The sparkling water market showcases a diverse range of products, encompassing various flavor profiles, packaging formats, and functional additions (e.g., electrolytes, vitamins). Innovations focus on sustainable packaging (e.g., recycled PET bottles) and unique flavor combinations to cater to evolving consumer preferences. Performance metrics such as consumer satisfaction, repeat purchase rates, and brand loyalty are vital indicators of product success. The key differentiators are premiumization, unique flavors, and sustainable packaging. Technological advancements in carbonation techniques and flavor delivery systems contribute to enhanced product quality and appeal.
Key Drivers, Barriers & Challenges in Sparkling Water Market
Key Drivers:
- Increasing health consciousness and the shift towards healthier beverages.
- Growing demand for convenient and refreshing options.
- Expanding distribution channels, especially e-commerce.
- The rise of premiumization and specialized flavors.
Key Challenges:
- Intense competition from established beverage brands.
- Fluctuating raw material costs (e.g., PET plastic).
- Concerns regarding environmental sustainability.
- Regulatory compliance and labeling requirements, varying across regions.
Emerging Opportunities in Sparkling Water Market
- Expansion into untapped markets in developing economies.
- Development of innovative flavors and functional water products.
- Increased focus on sustainable packaging and supply chain solutions.
- Growing popularity of sparkling water in foodservice channels (restaurants, cafes).
Growth Accelerators in the Sparkling Water Market Industry
Strategic partnerships and collaborations between beverage manufacturers and ingredient suppliers are driving innovation. Technological advancements in packaging materials and flavor technologies contribute to product differentiation and enhanced consumer experience. Expansion into new markets through strategic acquisitions and joint ventures enables broader reach and market penetration. The adoption of sustainable practices and environmentally friendly packaging is essential for long-term growth and brand enhancement.
Key Players Shaping the Sparkling Water Market Market
- Nestle SA
- Promag
- Asahi Group Holdings Ltd
- PT INDOFOOD SUKSES MAKMUR Tbk
- Tanobel Food
- Fraser and Neave Limited
- Danone S.A
- Blue Band
- The Coca-Cola Company
- Indo Food
- Kosme Group
Notable Milestones in Sparkling Water Market Sector
- June 2021: Nestlé Waters announced its expanded efforts in responsible water management and regional solutions.
- January 2022: Danone-AQUA launched AQUA LIFE using 100% recycled PET bottles in Indonesia.
- August 2022: Kosme Group launched Jiwater in Indonesia, a natural artesian water with Japanese processing.
In-Depth Sparkling Water Market Market Outlook
The sparkling water market is poised for sustained growth, driven by ongoing consumer preference for healthier alternatives and continuous innovation. Strategic partnerships, sustainable practices, and expansion into emerging markets will be crucial for maximizing market potential. Future opportunities lie in developing unique flavor profiles, functional waters, and sustainable packaging solutions that cater to evolving consumer demands, driving market expansion further.
Sparkling Water Market Segmentation
-
1. Type
- 1.1. Still Water
- 1.2. Sparkling Water
- 1.3. Functional Water
-
2. Distribution Channel
- 2.1. Supermarkets/Hypermarkets
- 2.2. Convenience Stores
- 2.3. Online Retailers
- 2.4. On-trade
- 2.5. Other Distribution Channels
Sparkling Water Market Segmentation By Geography
-
1. North America
- 1.1. United States
- 1.2. Canada
- 1.3. Mexico
-
2. South America
- 2.1. Brazil
- 2.2. Argentina
- 2.3. Rest of South America
-
3. Europe
- 3.1. United Kingdom
- 3.2. Germany
- 3.3. France
- 3.4. Italy
- 3.5. Spain
- 3.6. Russia
- 3.7. Benelux
- 3.8. Nordics
- 3.9. Rest of Europe
-
4. Middle East & Africa
- 4.1. Turkey
- 4.2. Israel
- 4.3. GCC
- 4.4. North Africa
- 4.5. South Africa
- 4.6. Rest of Middle East & Africa
-
5. Asia Pacific
- 5.1. China
- 5.2. India
- 5.3. Japan
- 5.4. South Korea
- 5.5. ASEAN
- 5.6. Oceania
- 5.7. Rest of Asia Pacific
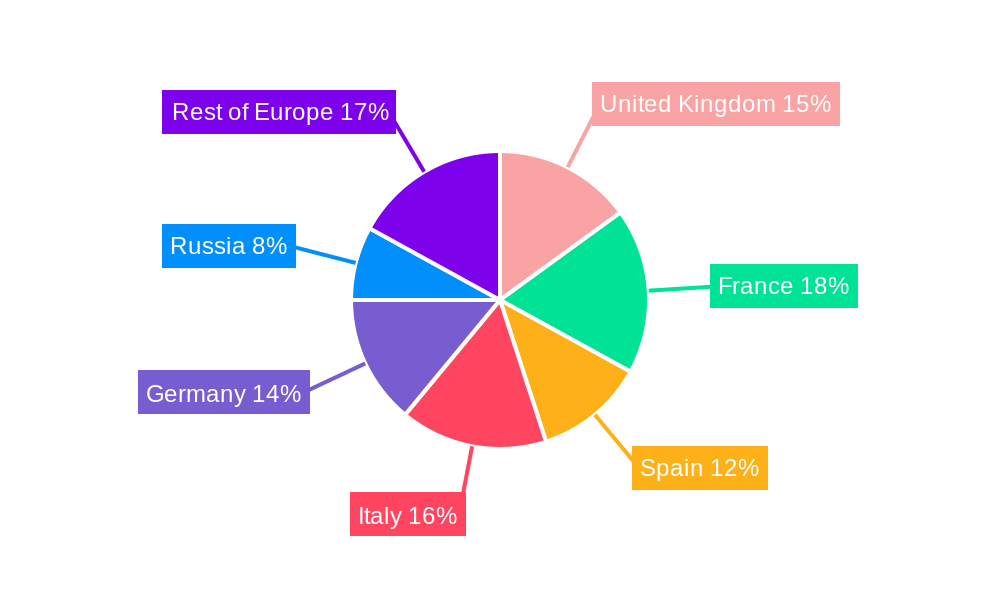
Sparkling Water Market Regional Market Share
Geographic Coverage of Sparkling Water Market
Sparkling Water Market REPORT HIGHLIGHTS
| Aspects | Details |
|---|---|
| Study Period | 2020-2034 |
| Base Year | 2025 |
| Estimated Year | 2026 |
| Forecast Period | 2026-2034 |
| Historical Period | 2020-2025 |
| Growth Rate | CAGR of 8.15% from 2020-2034 |
| Segmentation |
|
Table of Contents
- 1. Introduction
- 1.1. Research Scope
- 1.2. Market Segmentation
- 1.3. Research Objective
- 1.4. Definitions and Assumptions
- 2. Executive Summary
- 2.1. Market Snapshot
- 3. Market Dynamics
- 3.1. Market Drivers
- 3.2. Market Restrains
- 3.3. Market Trends
- 3.4. Market Opportunities
- 4. Market Factor Analysis
- 4.1. Porters Five Forces
- 4.1.1. Bargaining Power of Suppliers
- 4.1.2. Bargaining Power of Buyers
- 4.1.3. Threat of New Entrants
- 4.1.4. Threat of Substitutes
- 4.1.5. Competitive Rivalry
- 4.2. PESTEL analysis
- 4.3. BCG Analysis
- 4.3.1. Stars (High Growth, High Market Share)
- 4.3.2. Cash Cows (Low Growth, High Market Share)
- 4.3.3. Question Mark (High Growth, Low Market Share)
- 4.3.4. Dogs (Low Growth, Low Market Share)
- 4.4. Ansoff Matrix Analysis
- 4.5. Supply Chain Analysis
- 4.6. Regulatory Landscape
- 4.7. Current Market Potential and Opportunity Assessment (TAM–SAM–SOM Framework)
- 4.8. NRP Analyst Note
- 4.1. Porters Five Forces
- 5. Market Analysis, Insights and Forecast 2021-2033
- 5.1. Market Analysis, Insights and Forecast - by Type
- 5.1.1. Still Water
- 5.1.2. Sparkling Water
- 5.1.3. Functional Water
- 5.2. Market Analysis, Insights and Forecast - by Distribution Channel
- 5.2.1. Supermarkets/Hypermarkets
- 5.2.2. Convenience Stores
- 5.2.3. Online Retailers
- 5.2.4. On-trade
- 5.2.5. Other Distribution Channels
- 5.3. Market Analysis, Insights and Forecast - by Region
- 5.3.1. North America
- 5.3.2. South America
- 5.3.3. Europe
- 5.3.4. Middle East & Africa
- 5.3.5. Asia Pacific
- 5.1. Market Analysis, Insights and Forecast - by Type
- 6. Global Sparkling Water Market Analysis, Insights and Forecast, 2021-2033
- 6.1. Market Analysis, Insights and Forecast - by Type
- 6.1.1. Still Water
- 6.1.2. Sparkling Water
- 6.1.3. Functional Water
- 6.2. Market Analysis, Insights and Forecast - by Distribution Channel
- 6.2.1. Supermarkets/Hypermarkets
- 6.2.2. Convenience Stores
- 6.2.3. Online Retailers
- 6.2.4. On-trade
- 6.2.5. Other Distribution Channels
- 6.1. Market Analysis, Insights and Forecast - by Type
- 7. North America Sparkling Water Market Analysis, Insights and Forecast, 2020-2032
- 7.1. Market Analysis, Insights and Forecast - by Type
- 7.1.1. Still Water
- 7.1.2. Sparkling Water
- 7.1.3. Functional Water
- 7.2. Market Analysis, Insights and Forecast - by Distribution Channel
- 7.2.1. Supermarkets/Hypermarkets
- 7.2.2. Convenience Stores
- 7.2.3. Online Retailers
- 7.2.4. On-trade
- 7.2.5. Other Distribution Channels
- 7.1. Market Analysis, Insights and Forecast - by Type
- 8. South America Sparkling Water Market Analysis, Insights and Forecast, 2020-2032
- 8.1. Market Analysis, Insights and Forecast - by Type
- 8.1.1. Still Water
- 8.1.2. Sparkling Water
- 8.1.3. Functional Water
- 8.2. Market Analysis, Insights and Forecast - by Distribution Channel
- 8.2.1. Supermarkets/Hypermarkets
- 8.2.2. Convenience Stores
- 8.2.3. Online Retailers
- 8.2.4. On-trade
- 8.2.5. Other Distribution Channels
- 8.1. Market Analysis, Insights and Forecast - by Type
- 9. Europe Sparkling Water Market Analysis, Insights and Forecast, 2020-2032
- 9.1. Market Analysis, Insights and Forecast - by Type
- 9.1.1. Still Water
- 9.1.2. Sparkling Water
- 9.1.3. Functional Water
- 9.2. Market Analysis, Insights and Forecast - by Distribution Channel
- 9.2.1. Supermarkets/Hypermarkets
- 9.2.2. Convenience Stores
- 9.2.3. Online Retailers
- 9.2.4. On-trade
- 9.2.5. Other Distribution Channels
- 9.1. Market Analysis, Insights and Forecast - by Type
- 10. Middle East & Africa Sparkling Water Market Analysis, Insights and Forecast, 2020-2032
- 10.1. Market Analysis, Insights and Forecast - by Type
- 10.1.1. Still Water
- 10.1.2. Sparkling Water
- 10.1.3. Functional Water
- 10.2. Market Analysis, Insights and Forecast - by Distribution Channel
- 10.2.1. Supermarkets/Hypermarkets
- 10.2.2. Convenience Stores
- 10.2.3. Online Retailers
- 10.2.4. On-trade
- 10.2.5. Other Distribution Channels
- 10.1. Market Analysis, Insights and Forecast - by Type
- 11. Asia Pacific Sparkling Water Market Analysis, Insights and Forecast, 2020-2032
- 11.1. Market Analysis, Insights and Forecast - by Type
- 11.1.1. Still Water
- 11.1.2. Sparkling Water
- 11.1.3. Functional Water
- 11.2. Market Analysis, Insights and Forecast - by Distribution Channel
- 11.2.1. Supermarkets/Hypermarkets
- 11.2.2. Convenience Stores
- 11.2.3. Online Retailers
- 11.2.4. On-trade
- 11.2.5. Other Distribution Channels
- 11.1. Market Analysis, Insights and Forecast - by Type
- 12. Competitive Analysis
- 12.1. Company Profiles
- 12.1.1 Nestle SA
- 12.1.1.1. Company Overview
- 12.1.1.2. Products
- 12.1.1.3. Company Financials
- 12.1.1.4. SWOT Analysis
- 12.1.2 Promag
- 12.1.2.1. Company Overview
- 12.1.2.2. Products
- 12.1.2.3. Company Financials
- 12.1.2.4. SWOT Analysis
- 12.1.3 Asahi Group Holdings Ltd
- 12.1.3.1. Company Overview
- 12.1.3.2. Products
- 12.1.3.3. Company Financials
- 12.1.3.4. SWOT Analysis
- 12.1.4 PT INDOFOOD SUKSES MAKMUR Tbk
- 12.1.4.1. Company Overview
- 12.1.4.2. Products
- 12.1.4.3. Company Financials
- 12.1.4.4. SWOT Analysis
- 12.1.5 Tanobel Food
- 12.1.5.1. Company Overview
- 12.1.5.2. Products
- 12.1.5.3. Company Financials
- 12.1.5.4. SWOT Analysis
- 12.1.6 Fraser and Neave Limited
- 12.1.6.1. Company Overview
- 12.1.6.2. Products
- 12.1.6.3. Company Financials
- 12.1.6.4. SWOT Analysis
- 12.1.7 Danone S A
- 12.1.7.1. Company Overview
- 12.1.7.2. Products
- 12.1.7.3. Company Financials
- 12.1.7.4. SWOT Analysis
- 12.1.8 Blue Band
- 12.1.8.1. Company Overview
- 12.1.8.2. Products
- 12.1.8.3. Company Financials
- 12.1.8.4. SWOT Analysis
- 12.1.9 The Coca-Cola Company
- 12.1.9.1. Company Overview
- 12.1.9.2. Products
- 12.1.9.3. Company Financials
- 12.1.9.4. SWOT Analysis
- 12.1.10 Indo Food
- 12.1.10.1. Company Overview
- 12.1.10.2. Products
- 12.1.10.3. Company Financials
- 12.1.10.4. SWOT Analysis
- 12.1.11 Kosme Group*List Not Exhaustive
- 12.1.11.1. Company Overview
- 12.1.11.2. Products
- 12.1.11.3. Company Financials
- 12.1.11.4. SWOT Analysis
- 12.1.1 Nestle SA
- 12.2. Market Entropy
- 12.2.1 Company's Key Areas Served
- 12.2.2 Recent Developments
- 12.3. Company Market Share Analysis 2025
- 12.3.1 Top 5 Companies Market Share Analysis
- 12.3.2 Top 3 Companies Market Share Analysis
- 12.4. List of Potential Customers
- 13. Research Methodology
List of Figures
- Figure 1: Global Sparkling Water Market Revenue Breakdown (Million, %) by Region 2025 & 2033
- Figure 2: Global Sparkling Water Market Volume Breakdown (liter , %) by Region 2025 & 2033
- Figure 3: North America Sparkling Water Market Revenue (Million), by Type 2025 & 2033
- Figure 4: North America Sparkling Water Market Volume (liter ), by Type 2025 & 2033
- Figure 5: North America Sparkling Water Market Revenue Share (%), by Type 2025 & 2033
- Figure 6: North America Sparkling Water Market Volume Share (%), by Type 2025 & 2033
- Figure 7: North America Sparkling Water Market Revenue (Million), by Distribution Channel 2025 & 2033
- Figure 8: North America Sparkling Water Market Volume (liter ), by Distribution Channel 2025 & 2033
- Figure 9: North America Sparkling Water Market Revenue Share (%), by Distribution Channel 2025 & 2033
- Figure 10: North America Sparkling Water Market Volume Share (%), by Distribution Channel 2025 & 2033
- Figure 11: North America Sparkling Water Market Revenue (Million), by Country 2025 & 2033
- Figure 12: North America Sparkling Water Market Volume (liter ), by Country 2025 & 2033
- Figure 13: North America Sparkling Water Market Revenue Share (%), by Country 2025 & 2033
- Figure 14: North America Sparkling Water Market Volume Share (%), by Country 2025 & 2033
- Figure 15: South America Sparkling Water Market Revenue (Million), by Type 2025 & 2033
- Figure 16: South America Sparkling Water Market Volume (liter ), by Type 2025 & 2033
- Figure 17: South America Sparkling Water Market Revenue Share (%), by Type 2025 & 2033
- Figure 18: South America Sparkling Water Market Volume Share (%), by Type 2025 & 2033
- Figure 19: South America Sparkling Water Market Revenue (Million), by Distribution Channel 2025 & 2033
- Figure 20: South America Sparkling Water Market Volume (liter ), by Distribution Channel 2025 & 2033
- Figure 21: South America Sparkling Water Market Revenue Share (%), by Distribution Channel 2025 & 2033
- Figure 22: South America Sparkling Water Market Volume Share (%), by Distribution Channel 2025 & 2033
- Figure 23: South America Sparkling Water Market Revenue (Million), by Country 2025 & 2033
- Figure 24: South America Sparkling Water Market Volume (liter ), by Country 2025 & 2033
- Figure 25: South America Sparkling Water Market Revenue Share (%), by Country 2025 & 2033
- Figure 26: South America Sparkling Water Market Volume Share (%), by Country 2025 & 2033
- Figure 27: Europe Sparkling Water Market Revenue (Million), by Type 2025 & 2033
- Figure 28: Europe Sparkling Water Market Volume (liter ), by Type 2025 & 2033
- Figure 29: Europe Sparkling Water Market Revenue Share (%), by Type 2025 & 2033
- Figure 30: Europe Sparkling Water Market Volume Share (%), by Type 2025 & 2033
- Figure 31: Europe Sparkling Water Market Revenue (Million), by Distribution Channel 2025 & 2033
- Figure 32: Europe Sparkling Water Market Volume (liter ), by Distribution Channel 2025 & 2033
- Figure 33: Europe Sparkling Water Market Revenue Share (%), by Distribution Channel 2025 & 2033
- Figure 34: Europe Sparkling Water Market Volume Share (%), by Distribution Channel 2025 & 2033
- Figure 35: Europe Sparkling Water Market Revenue (Million), by Country 2025 & 2033
- Figure 36: Europe Sparkling Water Market Volume (liter ), by Country 2025 & 2033
- Figure 37: Europe Sparkling Water Market Revenue Share (%), by Country 2025 & 2033
- Figure 38: Europe Sparkling Water Market Volume Share (%), by Country 2025 & 2033
- Figure 39: Middle East & Africa Sparkling Water Market Revenue (Million), by Type 2025 & 2033
- Figure 40: Middle East & Africa Sparkling Water Market Volume (liter ), by Type 2025 & 2033
- Figure 41: Middle East & Africa Sparkling Water Market Revenue Share (%), by Type 2025 & 2033
- Figure 42: Middle East & Africa Sparkling Water Market Volume Share (%), by Type 2025 & 2033
- Figure 43: Middle East & Africa Sparkling Water Market Revenue (Million), by Distribution Channel 2025 & 2033
- Figure 44: Middle East & Africa Sparkling Water Market Volume (liter ), by Distribution Channel 2025 & 2033
- Figure 45: Middle East & Africa Sparkling Water Market Revenue Share (%), by Distribution Channel 2025 & 2033
- Figure 46: Middle East & Africa Sparkling Water Market Volume Share (%), by Distribution Channel 2025 & 2033
- Figure 47: Middle East & Africa Sparkling Water Market Revenue (Million), by Country 2025 & 2033
- Figure 48: Middle East & Africa Sparkling Water Market Volume (liter ), by Country 2025 & 2033
- Figure 49: Middle East & Africa Sparkling Water Market Revenue Share (%), by Country 2025 & 2033
- Figure 50: Middle East & Africa Sparkling Water Market Volume Share (%), by Country 2025 & 2033
- Figure 51: Asia Pacific Sparkling Water Market Revenue (Million), by Type 2025 & 2033
- Figure 52: Asia Pacific Sparkling Water Market Volume (liter ), by Type 2025 & 2033
- Figure 53: Asia Pacific Sparkling Water Market Revenue Share (%), by Type 2025 & 2033
- Figure 54: Asia Pacific Sparkling Water Market Volume Share (%), by Type 2025 & 2033
- Figure 55: Asia Pacific Sparkling Water Market Revenue (Million), by Distribution Channel 2025 & 2033
- Figure 56: Asia Pacific Sparkling Water Market Volume (liter ), by Distribution Channel 2025 & 2033
- Figure 57: Asia Pacific Sparkling Water Market Revenue Share (%), by Distribution Channel 2025 & 2033
- Figure 58: Asia Pacific Sparkling Water Market Volume Share (%), by Distribution Channel 2025 & 2033
- Figure 59: Asia Pacific Sparkling Water Market Revenue (Million), by Country 2025 & 2033
- Figure 60: Asia Pacific Sparkling Water Market Volume (liter ), by Country 2025 & 2033
- Figure 61: Asia Pacific Sparkling Water Market Revenue Share (%), by Country 2025 & 2033
- Figure 62: Asia Pacific Sparkling Water Market Volume Share (%), by Country 2025 & 2033
List of Tables
- Table 1: Global Sparkling Water Market Revenue Million Forecast, by Type 2020 & 2033
- Table 2: Global Sparkling Water Market Volume liter Forecast, by Type 2020 & 2033
- Table 3: Global Sparkling Water Market Revenue Million Forecast, by Distribution Channel 2020 & 2033
- Table 4: Global Sparkling Water Market Volume liter Forecast, by Distribution Channel 2020 & 2033
- Table 5: Global Sparkling Water Market Revenue Million Forecast, by Region 2020 & 2033
- Table 6: Global Sparkling Water Market Volume liter Forecast, by Region 2020 & 2033
- Table 7: Global Sparkling Water Market Revenue Million Forecast, by Type 2020 & 2033
- Table 8: Global Sparkling Water Market Volume liter Forecast, by Type 2020 & 2033
- Table 9: Global Sparkling Water Market Revenue Million Forecast, by Distribution Channel 2020 & 2033
- Table 10: Global Sparkling Water Market Volume liter Forecast, by Distribution Channel 2020 & 2033
- Table 11: Global Sparkling Water Market Revenue Million Forecast, by Country 2020 & 2033
- Table 12: Global Sparkling Water Market Volume liter Forecast, by Country 2020 & 2033
- Table 13: United States Sparkling Water Market Revenue (Million) Forecast, by Application 2020 & 2033
- Table 14: United States Sparkling Water Market Volume (liter ) Forecast, by Application 2020 & 2033
- Table 15: Canada Sparkling Water Market Revenue (Million) Forecast, by Application 2020 & 2033
- Table 16: Canada Sparkling Water Market Volume (liter ) Forecast, by Application 2020 & 2033
- Table 17: Mexico Sparkling Water Market Revenue (Million) Forecast, by Application 2020 & 2033
- Table 18: Mexico Sparkling Water Market Volume (liter ) Forecast, by Application 2020 & 2033
- Table 19: Global Sparkling Water Market Revenue Million Forecast, by Type 2020 & 2033
- Table 20: Global Sparkling Water Market Volume liter Forecast, by Type 2020 & 2033
- Table 21: Global Sparkling Water Market Revenue Million Forecast, by Distribution Channel 2020 & 2033
- Table 22: Global Sparkling Water Market Volume liter Forecast, by Distribution Channel 2020 & 2033
- Table 23: Global Sparkling Water Market Revenue Million Forecast, by Country 2020 & 2033
- Table 24: Global Sparkling Water Market Volume liter Forecast, by Country 2020 & 2033
- Table 25: Brazil Sparkling Water Market Revenue (Million) Forecast, by Application 2020 & 2033
- Table 26: Brazil Sparkling Water Market Volume (liter ) Forecast, by Application 2020 & 2033
- Table 27: Argentina Sparkling Water Market Revenue (Million) Forecast, by Application 2020 & 2033
- Table 28: Argentina Sparkling Water Market Volume (liter ) Forecast, by Application 2020 & 2033
- Table 29: Rest of South America Sparkling Water Market Revenue (Million) Forecast, by Application 2020 & 2033
- Table 30: Rest of South America Sparkling Water Market Volume (liter ) Forecast, by Application 2020 & 2033
- Table 31: Global Sparkling Water Market Revenue Million Forecast, by Type 2020 & 2033
- Table 32: Global Sparkling Water Market Volume liter Forecast, by Type 2020 & 2033
- Table 33: Global Sparkling Water Market Revenue Million Forecast, by Distribution Channel 2020 & 2033
- Table 34: Global Sparkling Water Market Volume liter Forecast, by Distribution Channel 2020 & 2033
- Table 35: Global Sparkling Water Market Revenue Million Forecast, by Country 2020 & 2033
- Table 36: Global Sparkling Water Market Volume liter Forecast, by Country 2020 & 2033
- Table 37: United Kingdom Sparkling Water Market Revenue (Million) Forecast, by Application 2020 & 2033
- Table 38: United Kingdom Sparkling Water Market Volume (liter ) Forecast, by Application 2020 & 2033
- Table 39: Germany Sparkling Water Market Revenue (Million) Forecast, by Application 2020 & 2033
- Table 40: Germany Sparkling Water Market Volume (liter ) Forecast, by Application 2020 & 2033
- Table 41: France Sparkling Water Market Revenue (Million) Forecast, by Application 2020 & 2033
- Table 42: France Sparkling Water Market Volume (liter ) Forecast, by Application 2020 & 2033
- Table 43: Italy Sparkling Water Market Revenue (Million) Forecast, by Application 2020 & 2033
- Table 44: Italy Sparkling Water Market Volume (liter ) Forecast, by Application 2020 & 2033
- Table 45: Spain Sparkling Water Market Revenue (Million) Forecast, by Application 2020 & 2033
- Table 46: Spain Sparkling Water Market Volume (liter ) Forecast, by Application 2020 & 2033
- Table 47: Russia Sparkling Water Market Revenue (Million) Forecast, by Application 2020 & 2033
- Table 48: Russia Sparkling Water Market Volume (liter ) Forecast, by Application 2020 & 2033
- Table 49: Benelux Sparkling Water Market Revenue (Million) Forecast, by Application 2020 & 2033
- Table 50: Benelux Sparkling Water Market Volume (liter ) Forecast, by Application 2020 & 2033
- Table 51: Nordics Sparkling Water Market Revenue (Million) Forecast, by Application 2020 & 2033
- Table 52: Nordics Sparkling Water Market Volume (liter ) Forecast, by Application 2020 & 2033
- Table 53: Rest of Europe Sparkling Water Market Revenue (Million) Forecast, by Application 2020 & 2033
- Table 54: Rest of Europe Sparkling Water Market Volume (liter ) Forecast, by Application 2020 & 2033
- Table 55: Global Sparkling Water Market Revenue Million Forecast, by Type 2020 & 2033
- Table 56: Global Sparkling Water Market Volume liter Forecast, by Type 2020 & 2033
- Table 57: Global Sparkling Water Market Revenue Million Forecast, by Distribution Channel 2020 & 2033
- Table 58: Global Sparkling Water Market Volume liter Forecast, by Distribution Channel 2020 & 2033
- Table 59: Global Sparkling Water Market Revenue Million Forecast, by Country 2020 & 2033
- Table 60: Global Sparkling Water Market Volume liter Forecast, by Country 2020 & 2033
- Table 61: Turkey Sparkling Water Market Revenue (Million) Forecast, by Application 2020 & 2033
- Table 62: Turkey Sparkling Water Market Volume (liter ) Forecast, by Application 2020 & 2033
- Table 63: Israel Sparkling Water Market Revenue (Million) Forecast, by Application 2020 & 2033
- Table 64: Israel Sparkling Water Market Volume (liter ) Forecast, by Application 2020 & 2033
- Table 65: GCC Sparkling Water Market Revenue (Million) Forecast, by Application 2020 & 2033
- Table 66: GCC Sparkling Water Market Volume (liter ) Forecast, by Application 2020 & 2033
- Table 67: North Africa Sparkling Water Market Revenue (Million) Forecast, by Application 2020 & 2033
- Table 68: North Africa Sparkling Water Market Volume (liter ) Forecast, by Application 2020 & 2033
- Table 69: South Africa Sparkling Water Market Revenue (Million) Forecast, by Application 2020 & 2033
- Table 70: South Africa Sparkling Water Market Volume (liter ) Forecast, by Application 2020 & 2033
- Table 71: Rest of Middle East & Africa Sparkling Water Market Revenue (Million) Forecast, by Application 2020 & 2033
- Table 72: Rest of Middle East & Africa Sparkling Water Market Volume (liter ) Forecast, by Application 2020 & 2033
- Table 73: Global Sparkling Water Market Revenue Million Forecast, by Type 2020 & 2033
- Table 74: Global Sparkling Water Market Volume liter Forecast, by Type 2020 & 2033
- Table 75: Global Sparkling Water Market Revenue Million Forecast, by Distribution Channel 2020 & 2033
- Table 76: Global Sparkling Water Market Volume liter Forecast, by Distribution Channel 2020 & 2033
- Table 77: Global Sparkling Water Market Revenue Million Forecast, by Country 2020 & 2033
- Table 78: Global Sparkling Water Market Volume liter Forecast, by Country 2020 & 2033
- Table 79: China Sparkling Water Market Revenue (Million) Forecast, by Application 2020 & 2033
- Table 80: China Sparkling Water Market Volume (liter ) Forecast, by Application 2020 & 2033
- Table 81: India Sparkling Water Market Revenue (Million) Forecast, by Application 2020 & 2033
- Table 82: India Sparkling Water Market Volume (liter ) Forecast, by Application 2020 & 2033
- Table 83: Japan Sparkling Water Market Revenue (Million) Forecast, by Application 2020 & 2033
- Table 84: Japan Sparkling Water Market Volume (liter ) Forecast, by Application 2020 & 2033
- Table 85: South Korea Sparkling Water Market Revenue (Million) Forecast, by Application 2020 & 2033
- Table 86: South Korea Sparkling Water Market Volume (liter ) Forecast, by Application 2020 & 2033
- Table 87: ASEAN Sparkling Water Market Revenue (Million) Forecast, by Application 2020 & 2033
- Table 88: ASEAN Sparkling Water Market Volume (liter ) Forecast, by Application 2020 & 2033
- Table 89: Oceania Sparkling Water Market Revenue (Million) Forecast, by Application 2020 & 2033
- Table 90: Oceania Sparkling Water Market Volume (liter ) Forecast, by Application 2020 & 2033
- Table 91: Rest of Asia Pacific Sparkling Water Market Revenue (Million) Forecast, by Application 2020 & 2033
- Table 92: Rest of Asia Pacific Sparkling Water Market Volume (liter ) Forecast, by Application 2020 & 2033
Frequently Asked Questions
1. What is the projected Compound Annual Growth Rate (CAGR) of the Sparkling Water Market?
The projected CAGR is approximately 8.15%.
2. Which companies are prominent players in the Sparkling Water Market?
Key companies in the market include Nestle SA, Promag, Asahi Group Holdings Ltd, PT INDOFOOD SUKSES MAKMUR Tbk, Tanobel Food, Fraser and Neave Limited, Danone S A, Blue Band, The Coca-Cola Company, Indo Food, Kosme Group*List Not Exhaustive.
3. What are the main segments of the Sparkling Water Market?
The market segments include Type, Distribution Channel.
4. Can you provide details about the market size?
The market size is estimated to be USD 32740 Million as of 2022.
5. What are some drivers contributing to market growth?
Increasing Demand for Alcoholic Beverages; Health Conscious Consumers Accelerating Demand For Gluten-free Beer.
6. What are the notable trends driving market growth?
Increasing Expenditure on Drinking Water Due to Lack of Safe Drinking Water Availability.
7. Are there any restraints impacting market growth?
Threat From Other Alcoholic Beverages.
8. Can you provide examples of recent developments in the market?
August 2022: Kosme Group has launched Jiwater in Indonesia. Jiwater is natural artesian water that has undergone Japanese technological processing. The pH range of the new mineral water is between 7.5 and 8.
9. What pricing options are available for accessing the report?
Pricing options include single-user, multi-user, and enterprise licenses priced at USD 3800, USD 4500, and USD 5800 respectively.
10. Is the market size provided in terms of value or volume?
The market size is provided in terms of value, measured in Million and volume, measured in liter .
11. Are there any specific market keywords associated with the report?
Yes, the market keyword associated with the report is "Sparkling Water Market," which aids in identifying and referencing the specific market segment covered.
12. How do I determine which pricing option suits my needs best?
The pricing options vary based on user requirements and access needs. Individual users may opt for single-user licenses, while businesses requiring broader access may choose multi-user or enterprise licenses for cost-effective access to the report.
13. Are there any additional resources or data provided in the Sparkling Water Market report?
While the report offers comprehensive insights, it's advisable to review the specific contents or supplementary materials provided to ascertain if additional resources or data are available.
14. How can I stay updated on further developments or reports in the Sparkling Water Market?
To stay informed about further developments, trends, and reports in the Sparkling Water Market, consider subscribing to industry newsletters, following relevant companies and organizations, or regularly checking reputable industry news sources and publications.
Methodology
Step 1 - Identification of Relevant Samples Size from Population Database


Step 2 - Approaches for Defining Global Market Size (Value, Volume* & Price*)

Note*: In applicable scenarios
Step 3 - Data Sources
Primary Research
- Web Analytics
- Survey Reports
- Research Institute
- Latest Research Reports
- Opinion Leaders
Secondary Research
- Annual Reports
- White Paper
- Latest Press Release
- Industry Association
- Paid Database
- Investor Presentations

Step 4 - Data Triangulation
Involves using different sources of information in order to increase the validity of a study
These sources are likely to be stakeholders in a program - participants, other researchers, program staff, other community members, and so on.
Then we put all data in single framework & apply various statistical tools to find out the dynamic on the market.
During the analysis stage, feedback from the stakeholder groups would be compared to determine areas of agreement as well as areas of divergence