

Key Insights
The Indian sports drinks market is projected to reach $3.4 billion by 2024, with a robust Compound Annual Growth Rate (CAGR) of 15.6%. This significant growth is attributed to increasing health consciousness among India's expanding middle class, driving demand for functional beverages such as electrolyte-enhanced and protein-based sports drinks. Growing participation in fitness activities, including marathons, gym workouts, and team sports, further propels market expansion. Evolving lifestyles and a preference for convenient, on-the-go hydration solutions are also key contributors. The market is segmented by drink type (electrolyte-enhanced water, isotonic, hypotonic, hypertonic, protein-based), packaging (PET bottles, metal cans, aseptic packages), and distribution channels (supermarkets, convenience stores, online retail, specialty stores). While convenience stores currently lead, online retail is expected to experience substantial growth due to increased internet penetration and e-commerce adoption.
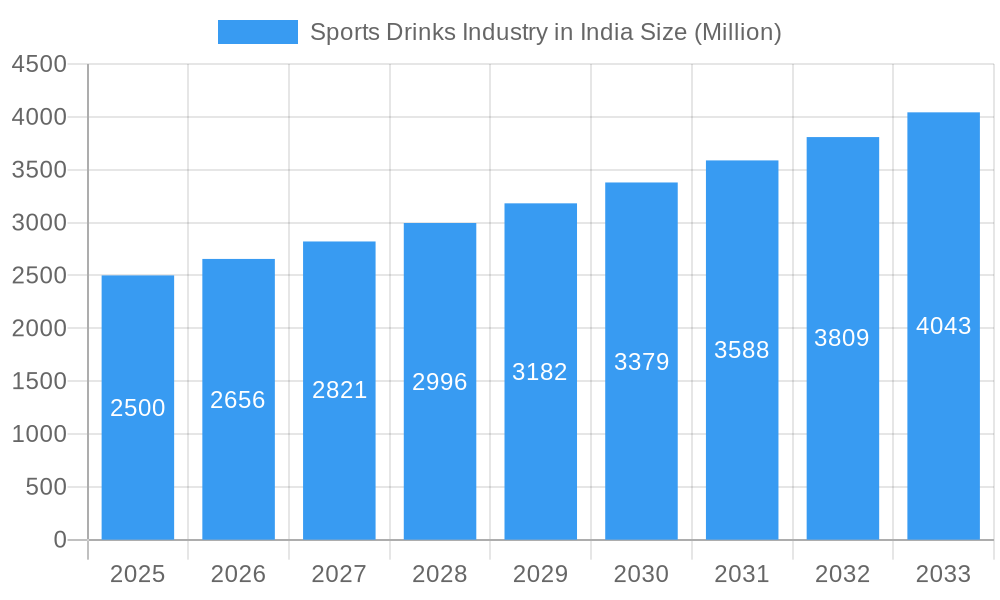
Sports Drinks Industry in India Market Size (In Billion)
Key challenges include pricing and affordability concerns for a segment of the population. The market faces intense competition from established global brands and emerging regional players focusing on niche segments. Continuous innovation and product diversification are essential to meet evolving consumer preferences. Regional consumption patterns, with higher demand in North and South India influenced by lifestyle, climate, and consumer preferences, shape market dynamics. Success will depend on leveraging digital marketing, building strong distribution networks, and executing targeted campaigns.
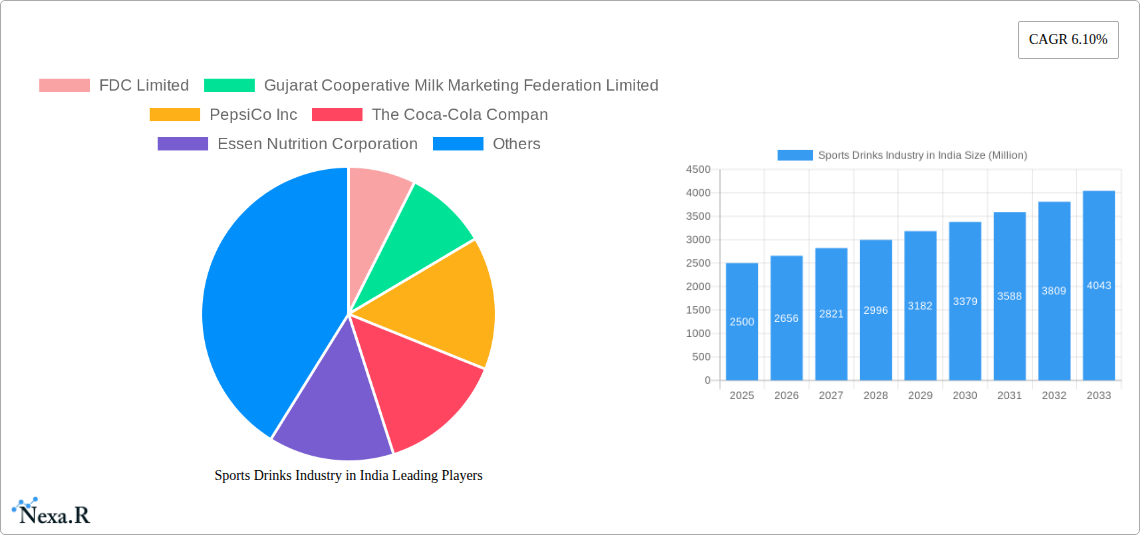
Sports Drinks Industry in India Company Market Share
This report offers a comprehensive analysis of the Indian sports drinks market, detailing market size, growth trajectories, competitive dynamics, and future opportunities. The analysis covers the period from 2019 to 2033, with 2024 serving as the base year and the forecast extending to 2033. The study provides actionable intelligence for industry professionals, investors, and stakeholders.
Sports Drinks Industry in India Market Dynamics & Structure
The Indian sports drinks market is characterized by a dynamic interplay of factors influencing its structure and growth. Market concentration is moderately high, with a few major players dominating the landscape alongside several regional and emerging brands. Technological innovation, primarily focused on enhancing hydration and functional benefits, plays a crucial role. Regulatory frameworks governing food and beverage safety significantly impact product formulation and marketing claims. The presence of substitute products like energy drinks and fruit juices influences market share. Consumer demographics, particularly the rising young and health-conscious population, are driving demand. The market has witnessed several mergers and acquisitions (M&A) activities, but volume is xx Million units over the study period.
- Market Concentration: The top 5 players hold an estimated xx% market share in 2025.
- Technological Innovation: Focus on enhanced electrolyte profiles, natural ingredients, and functional benefits.
- Regulatory Framework: Stringent food safety regulations influence product development and labeling.
- Competitive Substitutes: Energy drinks, fruit juices, and plain water are key substitutes.
- End-User Demographics: Growth driven by young adults, athletes, and health-conscious individuals.
- M&A Trends: xx M&A deals recorded between 2019 and 2024, with a value of xx Million units. Innovation barriers include high R&D costs and stringent regulatory approvals.
Sports Drinks Industry in India Growth Trends & Insights
The Indian sports drinks market has witnessed substantial growth during the historical period (2019-2024). The market size expanded from xx Million units in 2019 to xx Million units in 2024, registering a Compound Annual Growth Rate (CAGR) of xx%. This growth is attributed to several factors, including rising disposable incomes, increasing health awareness, and the growing popularity of fitness activities. Technological disruptions, such as the introduction of innovative formulations and packaging, have further boosted market expansion. Consumer behavior is shifting towards healthier and more functional beverages, resulting in higher demand for sports drinks with added benefits like electrolytes, vitamins, and protein. Market penetration remains relatively low, with significant untapped potential across various demographics and regions. This trend is expected to continue, driven by increasing urbanization, changing lifestyles, and rising participation in sports and fitness activities. The forecast period (2025-2033) projects a CAGR of xx%, with the market expected to reach xx Million units by 2033.
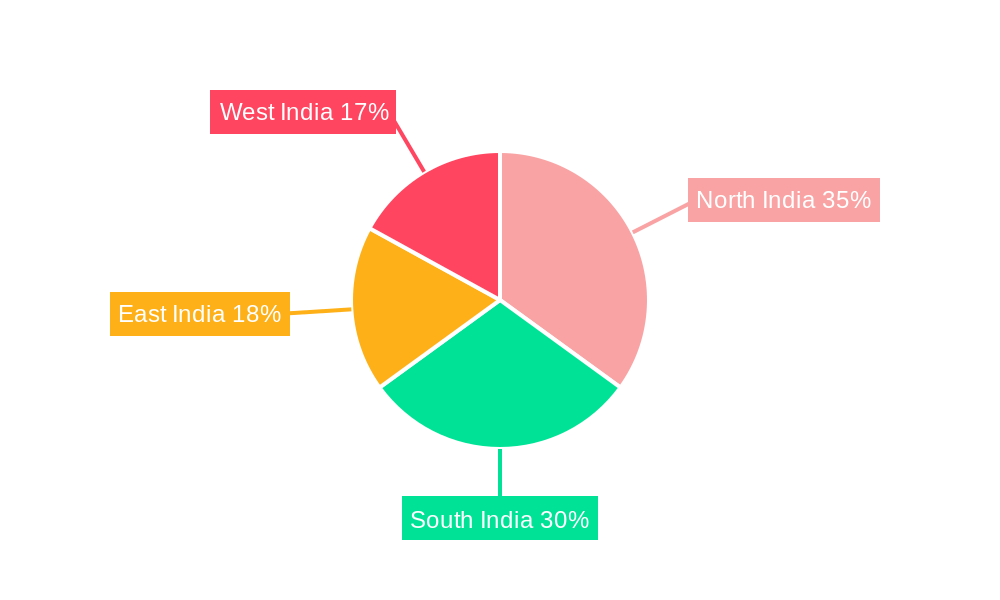
Dominant Regions, Countries, or Segments in Sports Drinks Industry in India
The Indian sports drinks market exhibits regional variations in consumption patterns and growth rates. Urban areas, particularly major metropolitan cities, exhibit higher consumption rates compared to rural regions. Among the different segments, the isotonic sports drinks segment holds the largest market share, driven by its effectiveness in rehydration and electrolyte replenishment. PET bottles are the most prevalent packaging format, owing to their convenience and cost-effectiveness. Supermarket/hypermarkets and convenience stores constitute the primary distribution channels.
- Key Drivers: Rising disposable incomes, increased health consciousness, expanding retail infrastructure, favorable government policies promoting sports and fitness.
- Dominance Factors: Isotonic segment dominance due to efficacy; PET bottles due to convenience; Supermarket/Hypermarket and Convenience Stores due to wide reach.
- Growth Potential: Untapped potential in rural markets and emerging segments like protein-based sports drinks and electrolyte-enhanced waters.
Sports Drinks Industry in India Product Landscape
The Indian sports drinks market offers a diverse range of products, including isotonic, hypotonic, hypertonic, electrolyte-enhanced water, and protein-based drinks. Product innovation focuses on enhanced functionality, natural ingredients, and improved taste profiles. Many brands offer unique selling propositions (USPs), such as natural sweeteners, specific electrolyte blends, and added vitamins. Technological advancements in packaging, such as aseptic packaging and lightweight PET bottles, also contribute to product differentiation.
Key Drivers, Barriers & Challenges in Sports Drinks Industry in India
Key Drivers:
- Rising health consciousness among consumers.
- Growing popularity of fitness and sports activities.
- Increasing disposable incomes and urbanization.
- Technological advancements leading to improved product formulations and packaging.
Challenges & Restraints:
- Intense competition from established players and new entrants.
- Price sensitivity among consumers, limiting premium product adoption.
- Regulatory hurdles and stringent food safety standards.
- Supply chain inefficiencies, leading to uneven distribution across regions. (Estimated impact: xx% reduction in sales in 2024).
Emerging Opportunities in Sports Drinks Industry in India
- Untapped Rural Markets: Expanding distribution networks and targeting rural consumers through effective marketing strategies.
- Functional Sports Drinks: Developing products with added benefits like vitamins, minerals, and protein.
- Premiumization: Catering to the growing demand for premium and natural sports drinks.
- Online Retail Expansion: Leveraging e-commerce platforms to expand reach and access a wider consumer base.
Growth Accelerators in the Sports Drinks Industry in India Industry
Technological advancements, strategic partnerships (such as collaborations with fitness brands and athletes), and aggressive marketing campaigns are key growth accelerators. Expanding distribution networks to reach untapped markets, especially rural areas, will also play a crucial role. Furthermore, focusing on product innovation and developing functional sports drinks tailored to specific consumer needs can drive significant growth.
Key Players Shaping the Sports Drinks Industry in India Market
- FDC Limited
- Gujarat Cooperative Milk Marketing Federation Limited
- PepsiCo Inc
- The Coca-Cola Company
- Essen Nutrition Corporation
- Cipla Limited
- Thai Beverages PCL
- Congo Brands
Notable Milestones in Sports Drinks Industry in India Sector
- September 2023: Launch of Limca Sportz ION4 by Coca-Cola India.
- May 2022: Coca-Cola India extends the Limca brand into the sports drinks category with Limca Sportz.
- January 2022: FDC Limited launches Electral Z+ (ORS+Zinc Solution).
In-Depth Sports Drinks Industry in India Market Outlook
The Indian sports drinks market is poised for continued growth over the forecast period (2025-2033), driven by factors like rising health awareness, increasing participation in sports and fitness activities, and favorable demographic trends. Strategic investments in product innovation, marketing, and distribution will be crucial for capturing market share. The focus should be on leveraging technological advancements to develop superior products that cater to specific consumer needs and preferences. Expanding into untapped markets and fostering strategic partnerships with key stakeholders will be vital for sustained long-term success in this promising sector.
Sports Drinks Industry in India Segmentation
-
1. Soft Drink Type
- 1.1. Electrolyte-Enhanced Water
- 1.2. Hypertonic
- 1.3. Hypotonic
- 1.4. Isotonic
- 1.5. Protein-based Sport Drinks
-
2. Packaging Type
- 2.1. Aseptic packages
- 2.2. Metal Can
- 2.3. PET Bottles
-
3. Sub Distribution Channel
- 3.1. Convenience Stores
- 3.2. Online Retail
- 3.3. Specialty Stores
- 3.4. Supermarket/Hypermarket
- 3.5. Others
Sports Drinks Industry in India Segmentation By Geography
-
1. North America
- 1.1. United States
- 1.2. Canada
- 1.3. Mexico
-
2. South America
- 2.1. Brazil
- 2.2. Argentina
- 2.3. Rest of South America
-
3. Europe
- 3.1. United Kingdom
- 3.2. Germany
- 3.3. France
- 3.4. Italy
- 3.5. Spain
- 3.6. Russia
- 3.7. Benelux
- 3.8. Nordics
- 3.9. Rest of Europe
-
4. Middle East & Africa
- 4.1. Turkey
- 4.2. Israel
- 4.3. GCC
- 4.4. North Africa
- 4.5. South Africa
- 4.6. Rest of Middle East & Africa
-
5. Asia Pacific
- 5.1. China
- 5.2. India
- 5.3. Japan
- 5.4. South Korea
- 5.5. ASEAN
- 5.6. Oceania
- 5.7. Rest of Asia Pacific
Sports Drinks Industry in India Regional Market Share
Geographic Coverage of Sports Drinks Industry in India
Sports Drinks Industry in India REPORT HIGHLIGHTS
| Aspects | Details |
|---|---|
| Study Period | 2020-2034 |
| Base Year | 2025 |
| Estimated Year | 2026 |
| Forecast Period | 2026-2034 |
| Historical Period | 2020-2025 |
| Growth Rate | CAGR of 15.6% from 2020-2034 |
| Segmentation |
|
Table of Contents
- 1. Introduction
- 1.1. Research Scope
- 1.2. Market Segmentation
- 1.3. Research Objective
- 1.4. Definitions and Assumptions
- 2. Executive Summary
- 2.1. Market Snapshot
- 3. Market Dynamics
- 3.1. Market Drivers
- 3.2. Market Restrains
- 3.3. Market Trends
- 3.4. Market Opportunities
- 4. Market Factor Analysis
- 4.1. Porters Five Forces
- 4.1.1. Bargaining Power of Suppliers
- 4.1.2. Bargaining Power of Buyers
- 4.1.3. Threat of New Entrants
- 4.1.4. Threat of Substitutes
- 4.1.5. Competitive Rivalry
- 4.2. PESTEL analysis
- 4.3. BCG Analysis
- 4.3.1. Stars (High Growth, High Market Share)
- 4.3.2. Cash Cows (Low Growth, High Market Share)
- 4.3.3. Question Mark (High Growth, Low Market Share)
- 4.3.4. Dogs (Low Growth, Low Market Share)
- 4.4. Ansoff Matrix Analysis
- 4.5. Supply Chain Analysis
- 4.6. Regulatory Landscape
- 4.7. Current Market Potential and Opportunity Assessment (TAM–SAM–SOM Framework)
- 4.8. NRP Analyst Note
- 4.1. Porters Five Forces
- 5. Market Analysis, Insights and Forecast 2021-2033
- 5.1. Market Analysis, Insights and Forecast - by Soft Drink Type
- 5.1.1. Electrolyte-Enhanced Water
- 5.1.2. Hypertonic
- 5.1.3. Hypotonic
- 5.1.4. Isotonic
- 5.1.5. Protein-based Sport Drinks
- 5.2. Market Analysis, Insights and Forecast - by Packaging Type
- 5.2.1. Aseptic packages
- 5.2.2. Metal Can
- 5.2.3. PET Bottles
- 5.3. Market Analysis, Insights and Forecast - by Sub Distribution Channel
- 5.3.1. Convenience Stores
- 5.3.2. Online Retail
- 5.3.3. Specialty Stores
- 5.3.4. Supermarket/Hypermarket
- 5.3.5. Others
- 5.4. Market Analysis, Insights and Forecast - by Region
- 5.4.1. North America
- 5.4.2. South America
- 5.4.3. Europe
- 5.4.4. Middle East & Africa
- 5.4.5. Asia Pacific
- 5.1. Market Analysis, Insights and Forecast - by Soft Drink Type
- 6. Global Sports Drinks Industry in India Analysis, Insights and Forecast, 2021-2033
- 6.1. Market Analysis, Insights and Forecast - by Soft Drink Type
- 6.1.1. Electrolyte-Enhanced Water
- 6.1.2. Hypertonic
- 6.1.3. Hypotonic
- 6.1.4. Isotonic
- 6.1.5. Protein-based Sport Drinks
- 6.2. Market Analysis, Insights and Forecast - by Packaging Type
- 6.2.1. Aseptic packages
- 6.2.2. Metal Can
- 6.2.3. PET Bottles
- 6.3. Market Analysis, Insights and Forecast - by Sub Distribution Channel
- 6.3.1. Convenience Stores
- 6.3.2. Online Retail
- 6.3.3. Specialty Stores
- 6.3.4. Supermarket/Hypermarket
- 6.3.5. Others
- 6.1. Market Analysis, Insights and Forecast - by Soft Drink Type
- 7. North America Sports Drinks Industry in India Analysis, Insights and Forecast, 2020-2032
- 7.1. Market Analysis, Insights and Forecast - by Soft Drink Type
- 7.1.1. Electrolyte-Enhanced Water
- 7.1.2. Hypertonic
- 7.1.3. Hypotonic
- 7.1.4. Isotonic
- 7.1.5. Protein-based Sport Drinks
- 7.2. Market Analysis, Insights and Forecast - by Packaging Type
- 7.2.1. Aseptic packages
- 7.2.2. Metal Can
- 7.2.3. PET Bottles
- 7.3. Market Analysis, Insights and Forecast - by Sub Distribution Channel
- 7.3.1. Convenience Stores
- 7.3.2. Online Retail
- 7.3.3. Specialty Stores
- 7.3.4. Supermarket/Hypermarket
- 7.3.5. Others
- 7.1. Market Analysis, Insights and Forecast - by Soft Drink Type
- 8. South America Sports Drinks Industry in India Analysis, Insights and Forecast, 2020-2032
- 8.1. Market Analysis, Insights and Forecast - by Soft Drink Type
- 8.1.1. Electrolyte-Enhanced Water
- 8.1.2. Hypertonic
- 8.1.3. Hypotonic
- 8.1.4. Isotonic
- 8.1.5. Protein-based Sport Drinks
- 8.2. Market Analysis, Insights and Forecast - by Packaging Type
- 8.2.1. Aseptic packages
- 8.2.2. Metal Can
- 8.2.3. PET Bottles
- 8.3. Market Analysis, Insights and Forecast - by Sub Distribution Channel
- 8.3.1. Convenience Stores
- 8.3.2. Online Retail
- 8.3.3. Specialty Stores
- 8.3.4. Supermarket/Hypermarket
- 8.3.5. Others
- 8.1. Market Analysis, Insights and Forecast - by Soft Drink Type
- 9. Europe Sports Drinks Industry in India Analysis, Insights and Forecast, 2020-2032
- 9.1. Market Analysis, Insights and Forecast - by Soft Drink Type
- 9.1.1. Electrolyte-Enhanced Water
- 9.1.2. Hypertonic
- 9.1.3. Hypotonic
- 9.1.4. Isotonic
- 9.1.5. Protein-based Sport Drinks
- 9.2. Market Analysis, Insights and Forecast - by Packaging Type
- 9.2.1. Aseptic packages
- 9.2.2. Metal Can
- 9.2.3. PET Bottles
- 9.3. Market Analysis, Insights and Forecast - by Sub Distribution Channel
- 9.3.1. Convenience Stores
- 9.3.2. Online Retail
- 9.3.3. Specialty Stores
- 9.3.4. Supermarket/Hypermarket
- 9.3.5. Others
- 9.1. Market Analysis, Insights and Forecast - by Soft Drink Type
- 10. Middle East & Africa Sports Drinks Industry in India Analysis, Insights and Forecast, 2020-2032
- 10.1. Market Analysis, Insights and Forecast - by Soft Drink Type
- 10.1.1. Electrolyte-Enhanced Water
- 10.1.2. Hypertonic
- 10.1.3. Hypotonic
- 10.1.4. Isotonic
- 10.1.5. Protein-based Sport Drinks
- 10.2. Market Analysis, Insights and Forecast - by Packaging Type
- 10.2.1. Aseptic packages
- 10.2.2. Metal Can
- 10.2.3. PET Bottles
- 10.3. Market Analysis, Insights and Forecast - by Sub Distribution Channel
- 10.3.1. Convenience Stores
- 10.3.2. Online Retail
- 10.3.3. Specialty Stores
- 10.3.4. Supermarket/Hypermarket
- 10.3.5. Others
- 10.1. Market Analysis, Insights and Forecast - by Soft Drink Type
- 11. Asia Pacific Sports Drinks Industry in India Analysis, Insights and Forecast, 2020-2032
- 11.1. Market Analysis, Insights and Forecast - by Soft Drink Type
- 11.1.1. Electrolyte-Enhanced Water
- 11.1.2. Hypertonic
- 11.1.3. Hypotonic
- 11.1.4. Isotonic
- 11.1.5. Protein-based Sport Drinks
- 11.2. Market Analysis, Insights and Forecast - by Packaging Type
- 11.2.1. Aseptic packages
- 11.2.2. Metal Can
- 11.2.3. PET Bottles
- 11.3. Market Analysis, Insights and Forecast - by Sub Distribution Channel
- 11.3.1. Convenience Stores
- 11.3.2. Online Retail
- 11.3.3. Specialty Stores
- 11.3.4. Supermarket/Hypermarket
- 11.3.5. Others
- 11.1. Market Analysis, Insights and Forecast - by Soft Drink Type
- 12. Competitive Analysis
- 12.1. Company Profiles
- 12.1.1 FDC Limited
- 12.1.1.1. Company Overview
- 12.1.1.2. Products
- 12.1.1.3. Company Financials
- 12.1.1.4. SWOT Analysis
- 12.1.2 Gujarat Cooperative Milk Marketing Federation Limited
- 12.1.2.1. Company Overview
- 12.1.2.2. Products
- 12.1.2.3. Company Financials
- 12.1.2.4. SWOT Analysis
- 12.1.3 PepsiCo Inc
- 12.1.3.1. Company Overview
- 12.1.3.2. Products
- 12.1.3.3. Company Financials
- 12.1.3.4. SWOT Analysis
- 12.1.4 The Coca-Cola Compan
- 12.1.4.1. Company Overview
- 12.1.4.2. Products
- 12.1.4.3. Company Financials
- 12.1.4.4. SWOT Analysis
- 12.1.5 Essen Nutrition Corporation
- 12.1.5.1. Company Overview
- 12.1.5.2. Products
- 12.1.5.3. Company Financials
- 12.1.5.4. SWOT Analysis
- 12.1.6 Cipla Limited
- 12.1.6.1. Company Overview
- 12.1.6.2. Products
- 12.1.6.3. Company Financials
- 12.1.6.4. SWOT Analysis
- 12.1.7 Thai Beverages PCL
- 12.1.7.1. Company Overview
- 12.1.7.2. Products
- 12.1.7.3. Company Financials
- 12.1.7.4. SWOT Analysis
- 12.1.8 Congo Brands
- 12.1.8.1. Company Overview
- 12.1.8.2. Products
- 12.1.8.3. Company Financials
- 12.1.8.4. SWOT Analysis
- 12.1.1 FDC Limited
- 12.2. Market Entropy
- 12.2.1 Company's Key Areas Served
- 12.2.2 Recent Developments
- 12.3. Company Market Share Analysis 2025
- 12.3.1 Top 5 Companies Market Share Analysis
- 12.3.2 Top 3 Companies Market Share Analysis
- 12.4. List of Potential Customers
- 13. Research Methodology
List of Figures
- Figure 1: Global Sports Drinks Industry in India Revenue Breakdown (billion, %) by Region 2025 & 2033
- Figure 2: North America Sports Drinks Industry in India Revenue (billion), by Soft Drink Type 2025 & 2033
- Figure 3: North America Sports Drinks Industry in India Revenue Share (%), by Soft Drink Type 2025 & 2033
- Figure 4: North America Sports Drinks Industry in India Revenue (billion), by Packaging Type 2025 & 2033
- Figure 5: North America Sports Drinks Industry in India Revenue Share (%), by Packaging Type 2025 & 2033
- Figure 6: North America Sports Drinks Industry in India Revenue (billion), by Sub Distribution Channel 2025 & 2033
- Figure 7: North America Sports Drinks Industry in India Revenue Share (%), by Sub Distribution Channel 2025 & 2033
- Figure 8: North America Sports Drinks Industry in India Revenue (billion), by Country 2025 & 2033
- Figure 9: North America Sports Drinks Industry in India Revenue Share (%), by Country 2025 & 2033
- Figure 10: South America Sports Drinks Industry in India Revenue (billion), by Soft Drink Type 2025 & 2033
- Figure 11: South America Sports Drinks Industry in India Revenue Share (%), by Soft Drink Type 2025 & 2033
- Figure 12: South America Sports Drinks Industry in India Revenue (billion), by Packaging Type 2025 & 2033
- Figure 13: South America Sports Drinks Industry in India Revenue Share (%), by Packaging Type 2025 & 2033
- Figure 14: South America Sports Drinks Industry in India Revenue (billion), by Sub Distribution Channel 2025 & 2033
- Figure 15: South America Sports Drinks Industry in India Revenue Share (%), by Sub Distribution Channel 2025 & 2033
- Figure 16: South America Sports Drinks Industry in India Revenue (billion), by Country 2025 & 2033
- Figure 17: South America Sports Drinks Industry in India Revenue Share (%), by Country 2025 & 2033
- Figure 18: Europe Sports Drinks Industry in India Revenue (billion), by Soft Drink Type 2025 & 2033
- Figure 19: Europe Sports Drinks Industry in India Revenue Share (%), by Soft Drink Type 2025 & 2033
- Figure 20: Europe Sports Drinks Industry in India Revenue (billion), by Packaging Type 2025 & 2033
- Figure 21: Europe Sports Drinks Industry in India Revenue Share (%), by Packaging Type 2025 & 2033
- Figure 22: Europe Sports Drinks Industry in India Revenue (billion), by Sub Distribution Channel 2025 & 2033
- Figure 23: Europe Sports Drinks Industry in India Revenue Share (%), by Sub Distribution Channel 2025 & 2033
- Figure 24: Europe Sports Drinks Industry in India Revenue (billion), by Country 2025 & 2033
- Figure 25: Europe Sports Drinks Industry in India Revenue Share (%), by Country 2025 & 2033
- Figure 26: Middle East & Africa Sports Drinks Industry in India Revenue (billion), by Soft Drink Type 2025 & 2033
- Figure 27: Middle East & Africa Sports Drinks Industry in India Revenue Share (%), by Soft Drink Type 2025 & 2033
- Figure 28: Middle East & Africa Sports Drinks Industry in India Revenue (billion), by Packaging Type 2025 & 2033
- Figure 29: Middle East & Africa Sports Drinks Industry in India Revenue Share (%), by Packaging Type 2025 & 2033
- Figure 30: Middle East & Africa Sports Drinks Industry in India Revenue (billion), by Sub Distribution Channel 2025 & 2033
- Figure 31: Middle East & Africa Sports Drinks Industry in India Revenue Share (%), by Sub Distribution Channel 2025 & 2033
- Figure 32: Middle East & Africa Sports Drinks Industry in India Revenue (billion), by Country 2025 & 2033
- Figure 33: Middle East & Africa Sports Drinks Industry in India Revenue Share (%), by Country 2025 & 2033
- Figure 34: Asia Pacific Sports Drinks Industry in India Revenue (billion), by Soft Drink Type 2025 & 2033
- Figure 35: Asia Pacific Sports Drinks Industry in India Revenue Share (%), by Soft Drink Type 2025 & 2033
- Figure 36: Asia Pacific Sports Drinks Industry in India Revenue (billion), by Packaging Type 2025 & 2033
- Figure 37: Asia Pacific Sports Drinks Industry in India Revenue Share (%), by Packaging Type 2025 & 2033
- Figure 38: Asia Pacific Sports Drinks Industry in India Revenue (billion), by Sub Distribution Channel 2025 & 2033
- Figure 39: Asia Pacific Sports Drinks Industry in India Revenue Share (%), by Sub Distribution Channel 2025 & 2033
- Figure 40: Asia Pacific Sports Drinks Industry in India Revenue (billion), by Country 2025 & 2033
- Figure 41: Asia Pacific Sports Drinks Industry in India Revenue Share (%), by Country 2025 & 2033
List of Tables
- Table 1: Global Sports Drinks Industry in India Revenue billion Forecast, by Soft Drink Type 2020 & 2033
- Table 2: Global Sports Drinks Industry in India Revenue billion Forecast, by Packaging Type 2020 & 2033
- Table 3: Global Sports Drinks Industry in India Revenue billion Forecast, by Sub Distribution Channel 2020 & 2033
- Table 4: Global Sports Drinks Industry in India Revenue billion Forecast, by Region 2020 & 2033
- Table 5: Global Sports Drinks Industry in India Revenue billion Forecast, by Soft Drink Type 2020 & 2033
- Table 6: Global Sports Drinks Industry in India Revenue billion Forecast, by Packaging Type 2020 & 2033
- Table 7: Global Sports Drinks Industry in India Revenue billion Forecast, by Sub Distribution Channel 2020 & 2033
- Table 8: Global Sports Drinks Industry in India Revenue billion Forecast, by Country 2020 & 2033
- Table 9: United States Sports Drinks Industry in India Revenue (billion) Forecast, by Application 2020 & 2033
- Table 10: Canada Sports Drinks Industry in India Revenue (billion) Forecast, by Application 2020 & 2033
- Table 11: Mexico Sports Drinks Industry in India Revenue (billion) Forecast, by Application 2020 & 2033
- Table 12: Global Sports Drinks Industry in India Revenue billion Forecast, by Soft Drink Type 2020 & 2033
- Table 13: Global Sports Drinks Industry in India Revenue billion Forecast, by Packaging Type 2020 & 2033
- Table 14: Global Sports Drinks Industry in India Revenue billion Forecast, by Sub Distribution Channel 2020 & 2033
- Table 15: Global Sports Drinks Industry in India Revenue billion Forecast, by Country 2020 & 2033
- Table 16: Brazil Sports Drinks Industry in India Revenue (billion) Forecast, by Application 2020 & 2033
- Table 17: Argentina Sports Drinks Industry in India Revenue (billion) Forecast, by Application 2020 & 2033
- Table 18: Rest of South America Sports Drinks Industry in India Revenue (billion) Forecast, by Application 2020 & 2033
- Table 19: Global Sports Drinks Industry in India Revenue billion Forecast, by Soft Drink Type 2020 & 2033
- Table 20: Global Sports Drinks Industry in India Revenue billion Forecast, by Packaging Type 2020 & 2033
- Table 21: Global Sports Drinks Industry in India Revenue billion Forecast, by Sub Distribution Channel 2020 & 2033
- Table 22: Global Sports Drinks Industry in India Revenue billion Forecast, by Country 2020 & 2033
- Table 23: United Kingdom Sports Drinks Industry in India Revenue (billion) Forecast, by Application 2020 & 2033
- Table 24: Germany Sports Drinks Industry in India Revenue (billion) Forecast, by Application 2020 & 2033
- Table 25: France Sports Drinks Industry in India Revenue (billion) Forecast, by Application 2020 & 2033
- Table 26: Italy Sports Drinks Industry in India Revenue (billion) Forecast, by Application 2020 & 2033
- Table 27: Spain Sports Drinks Industry in India Revenue (billion) Forecast, by Application 2020 & 2033
- Table 28: Russia Sports Drinks Industry in India Revenue (billion) Forecast, by Application 2020 & 2033
- Table 29: Benelux Sports Drinks Industry in India Revenue (billion) Forecast, by Application 2020 & 2033
- Table 30: Nordics Sports Drinks Industry in India Revenue (billion) Forecast, by Application 2020 & 2033
- Table 31: Rest of Europe Sports Drinks Industry in India Revenue (billion) Forecast, by Application 2020 & 2033
- Table 32: Global Sports Drinks Industry in India Revenue billion Forecast, by Soft Drink Type 2020 & 2033
- Table 33: Global Sports Drinks Industry in India Revenue billion Forecast, by Packaging Type 2020 & 2033
- Table 34: Global Sports Drinks Industry in India Revenue billion Forecast, by Sub Distribution Channel 2020 & 2033
- Table 35: Global Sports Drinks Industry in India Revenue billion Forecast, by Country 2020 & 2033
- Table 36: Turkey Sports Drinks Industry in India Revenue (billion) Forecast, by Application 2020 & 2033
- Table 37: Israel Sports Drinks Industry in India Revenue (billion) Forecast, by Application 2020 & 2033
- Table 38: GCC Sports Drinks Industry in India Revenue (billion) Forecast, by Application 2020 & 2033
- Table 39: North Africa Sports Drinks Industry in India Revenue (billion) Forecast, by Application 2020 & 2033
- Table 40: South Africa Sports Drinks Industry in India Revenue (billion) Forecast, by Application 2020 & 2033
- Table 41: Rest of Middle East & Africa Sports Drinks Industry in India Revenue (billion) Forecast, by Application 2020 & 2033
- Table 42: Global Sports Drinks Industry in India Revenue billion Forecast, by Soft Drink Type 2020 & 2033
- Table 43: Global Sports Drinks Industry in India Revenue billion Forecast, by Packaging Type 2020 & 2033
- Table 44: Global Sports Drinks Industry in India Revenue billion Forecast, by Sub Distribution Channel 2020 & 2033
- Table 45: Global Sports Drinks Industry in India Revenue billion Forecast, by Country 2020 & 2033
- Table 46: China Sports Drinks Industry in India Revenue (billion) Forecast, by Application 2020 & 2033
- Table 47: India Sports Drinks Industry in India Revenue (billion) Forecast, by Application 2020 & 2033
- Table 48: Japan Sports Drinks Industry in India Revenue (billion) Forecast, by Application 2020 & 2033
- Table 49: South Korea Sports Drinks Industry in India Revenue (billion) Forecast, by Application 2020 & 2033
- Table 50: ASEAN Sports Drinks Industry in India Revenue (billion) Forecast, by Application 2020 & 2033
- Table 51: Oceania Sports Drinks Industry in India Revenue (billion) Forecast, by Application 2020 & 2033
- Table 52: Rest of Asia Pacific Sports Drinks Industry in India Revenue (billion) Forecast, by Application 2020 & 2033
Frequently Asked Questions
1. What is the projected Compound Annual Growth Rate (CAGR) of the Sports Drinks Industry in India?
The projected CAGR is approximately 15.6%.
2. Which companies are prominent players in the Sports Drinks Industry in India?
Key companies in the market include FDC Limited, Gujarat Cooperative Milk Marketing Federation Limited, PepsiCo Inc, The Coca-Cola Compan, Essen Nutrition Corporation, Cipla Limited, Thai Beverages PCL, Congo Brands.
3. What are the main segments of the Sports Drinks Industry in India?
The market segments include Soft Drink Type, Packaging Type, Sub Distribution Channel.
4. Can you provide details about the market size?
The market size is estimated to be USD 3.4 billion as of 2022.
5. What are some drivers contributing to market growth?
Increasing Demand for Functional and Fortified Food; Multi-functionality and Wide Application of Riboflavin.
6. What are the notable trends driving market growth?
OTHER KEY INDUSTRY TRENDS COVERED IN THE REPORT.
7. Are there any restraints impacting market growth?
Low Stability of Riboflavin on Exposure to Light and Heat.
8. Can you provide examples of recent developments in the market?
September 2023: Limca Sportz, the sports drink from Coca-Cola India's home-grown brand Limca, is thrilled to announce the launch of its new variant Limca Sportz ION4 in India.May 2022: Coca-Cola India extended the brand Limca into the hydrating sports drinks category, with the product Limca sportz. This will be the first brand extension for Limca, which was acquired from Ramesh Chauhan’s Parle Bisleri Ltd. in the early 1990s along with other valuable brands such as Thums Up, Maaza, and Gold Spot. Limca stands at number four within Coca-Cola India’s sparkling portfolio.January 2022: FDC limited expanded its portfolio with launch of its brand ‘Electral Z+ (ORS+Zinc Solution)’ which is a ready-to-drink OTC product, having unique formulation manufactured by Halewood Laboratories Private Ltd.
9. What pricing options are available for accessing the report?
Pricing options include single-user, multi-user, and enterprise licenses priced at USD 3800, USD 4500, and USD 5800 respectively.
10. Is the market size provided in terms of value or volume?
The market size is provided in terms of value, measured in billion.
11. Are there any specific market keywords associated with the report?
Yes, the market keyword associated with the report is "Sports Drinks Industry in India," which aids in identifying and referencing the specific market segment covered.
12. How do I determine which pricing option suits my needs best?
The pricing options vary based on user requirements and access needs. Individual users may opt for single-user licenses, while businesses requiring broader access may choose multi-user or enterprise licenses for cost-effective access to the report.
13. Are there any additional resources or data provided in the Sports Drinks Industry in India report?
While the report offers comprehensive insights, it's advisable to review the specific contents or supplementary materials provided to ascertain if additional resources or data are available.
14. How can I stay updated on further developments or reports in the Sports Drinks Industry in India?
To stay informed about further developments, trends, and reports in the Sports Drinks Industry in India, consider subscribing to industry newsletters, following relevant companies and organizations, or regularly checking reputable industry news sources and publications.
Methodology
Step 1 - Identification of Relevant Samples Size from Population Database


Step 2 - Approaches for Defining Global Market Size (Value, Volume* & Price*)

Note*: In applicable scenarios
Step 3 - Data Sources
Primary Research
- Web Analytics
- Survey Reports
- Research Institute
- Latest Research Reports
- Opinion Leaders
Secondary Research
- Annual Reports
- White Paper
- Latest Press Release
- Industry Association
- Paid Database
- Investor Presentations

Step 4 - Data Triangulation
Involves using different sources of information in order to increase the validity of a study
These sources are likely to be stakeholders in a program - participants, other researchers, program staff, other community members, and so on.
Then we put all data in single framework & apply various statistical tools to find out the dynamic on the market.
During the analysis stage, feedback from the stakeholder groups would be compared to determine areas of agreement as well as areas of divergence